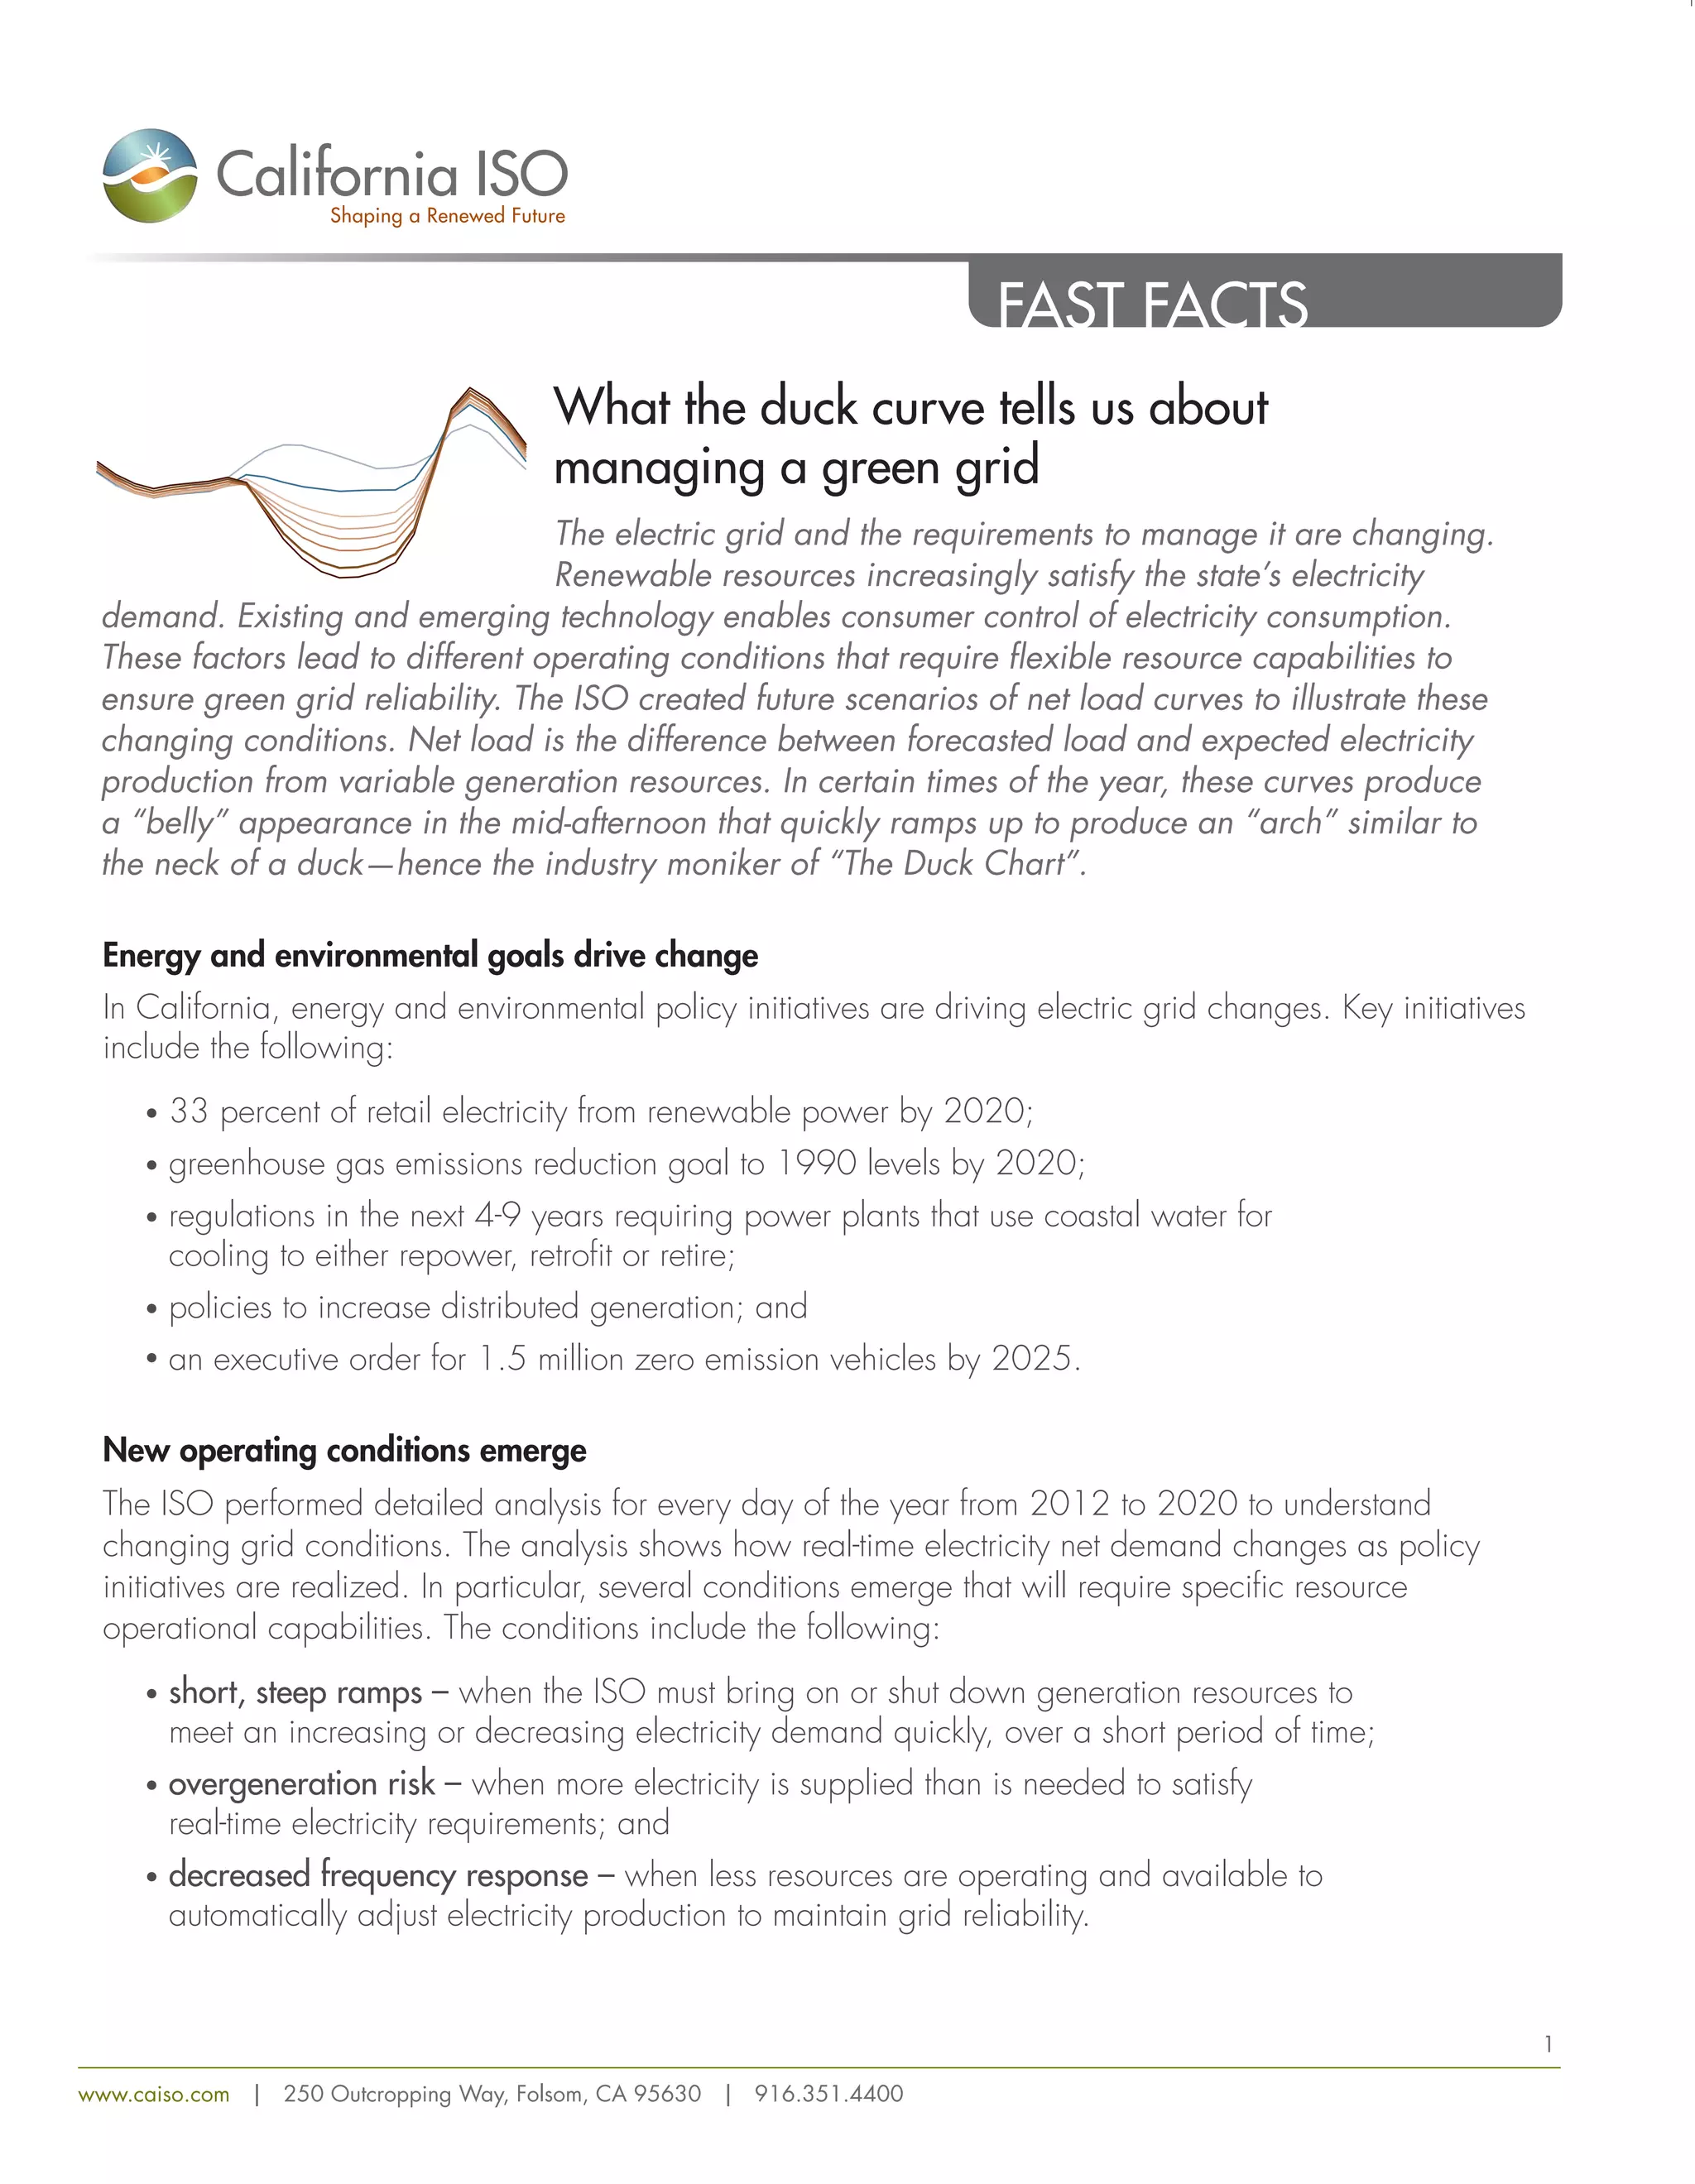
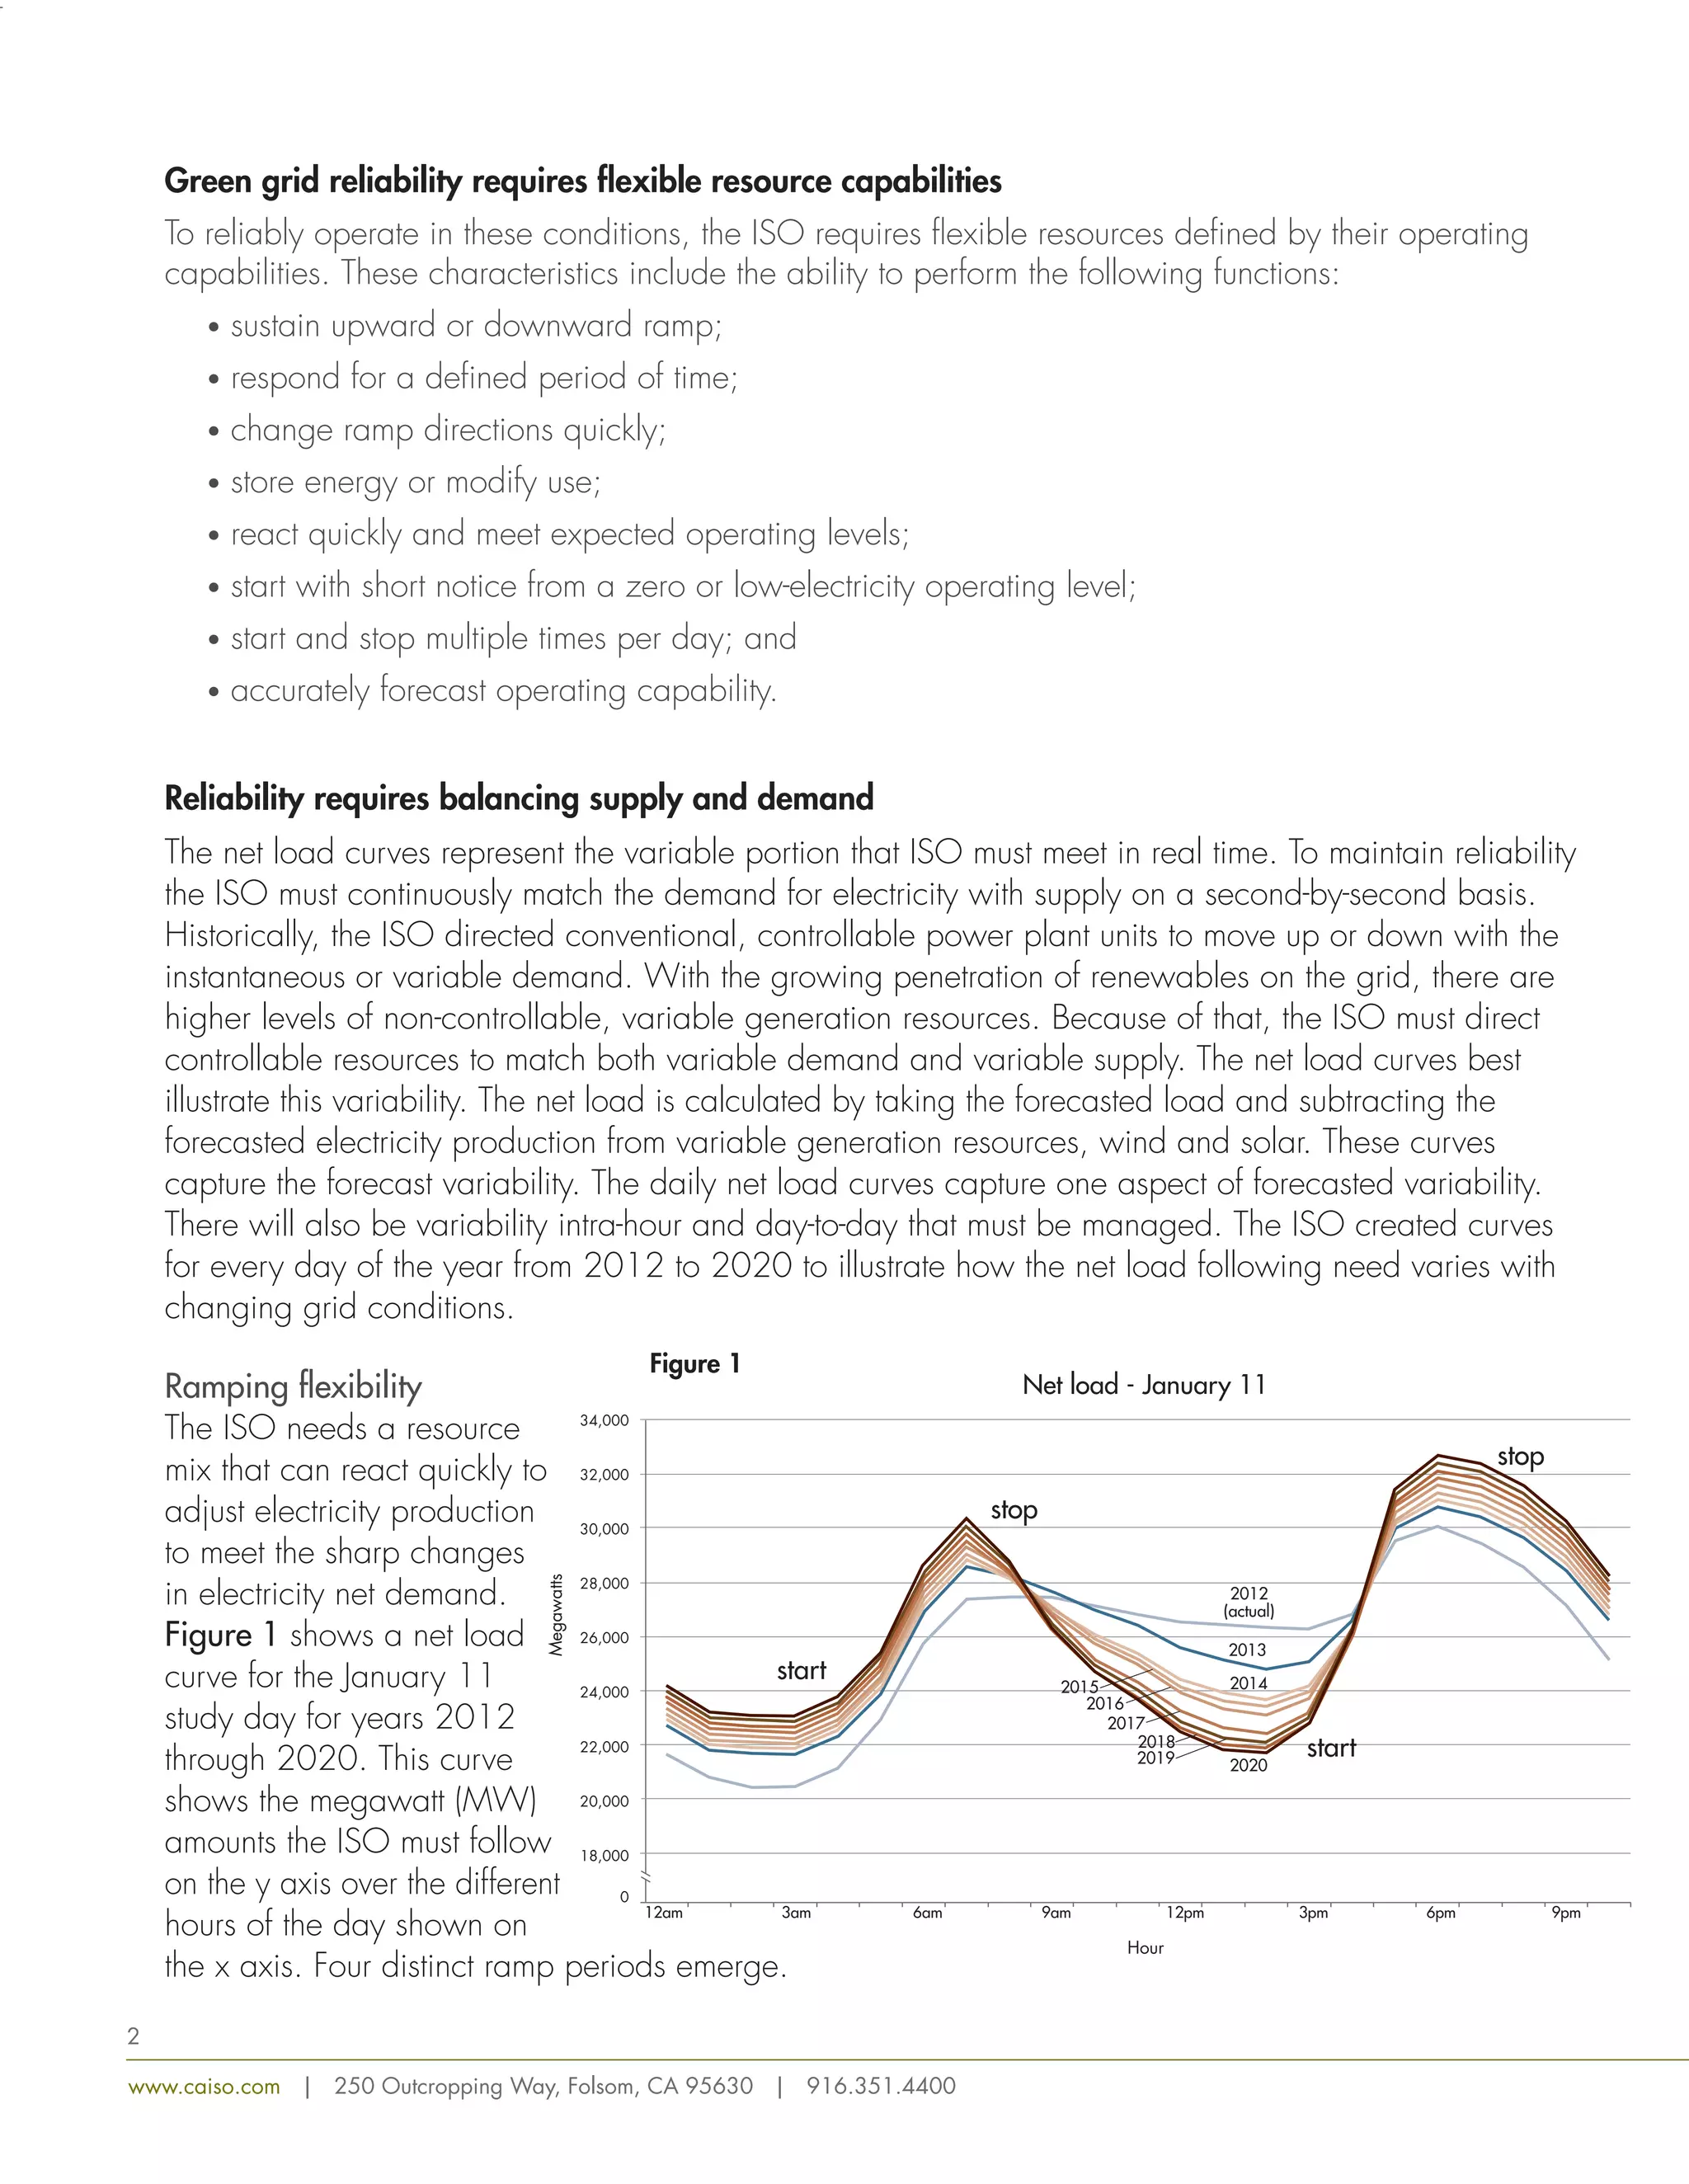
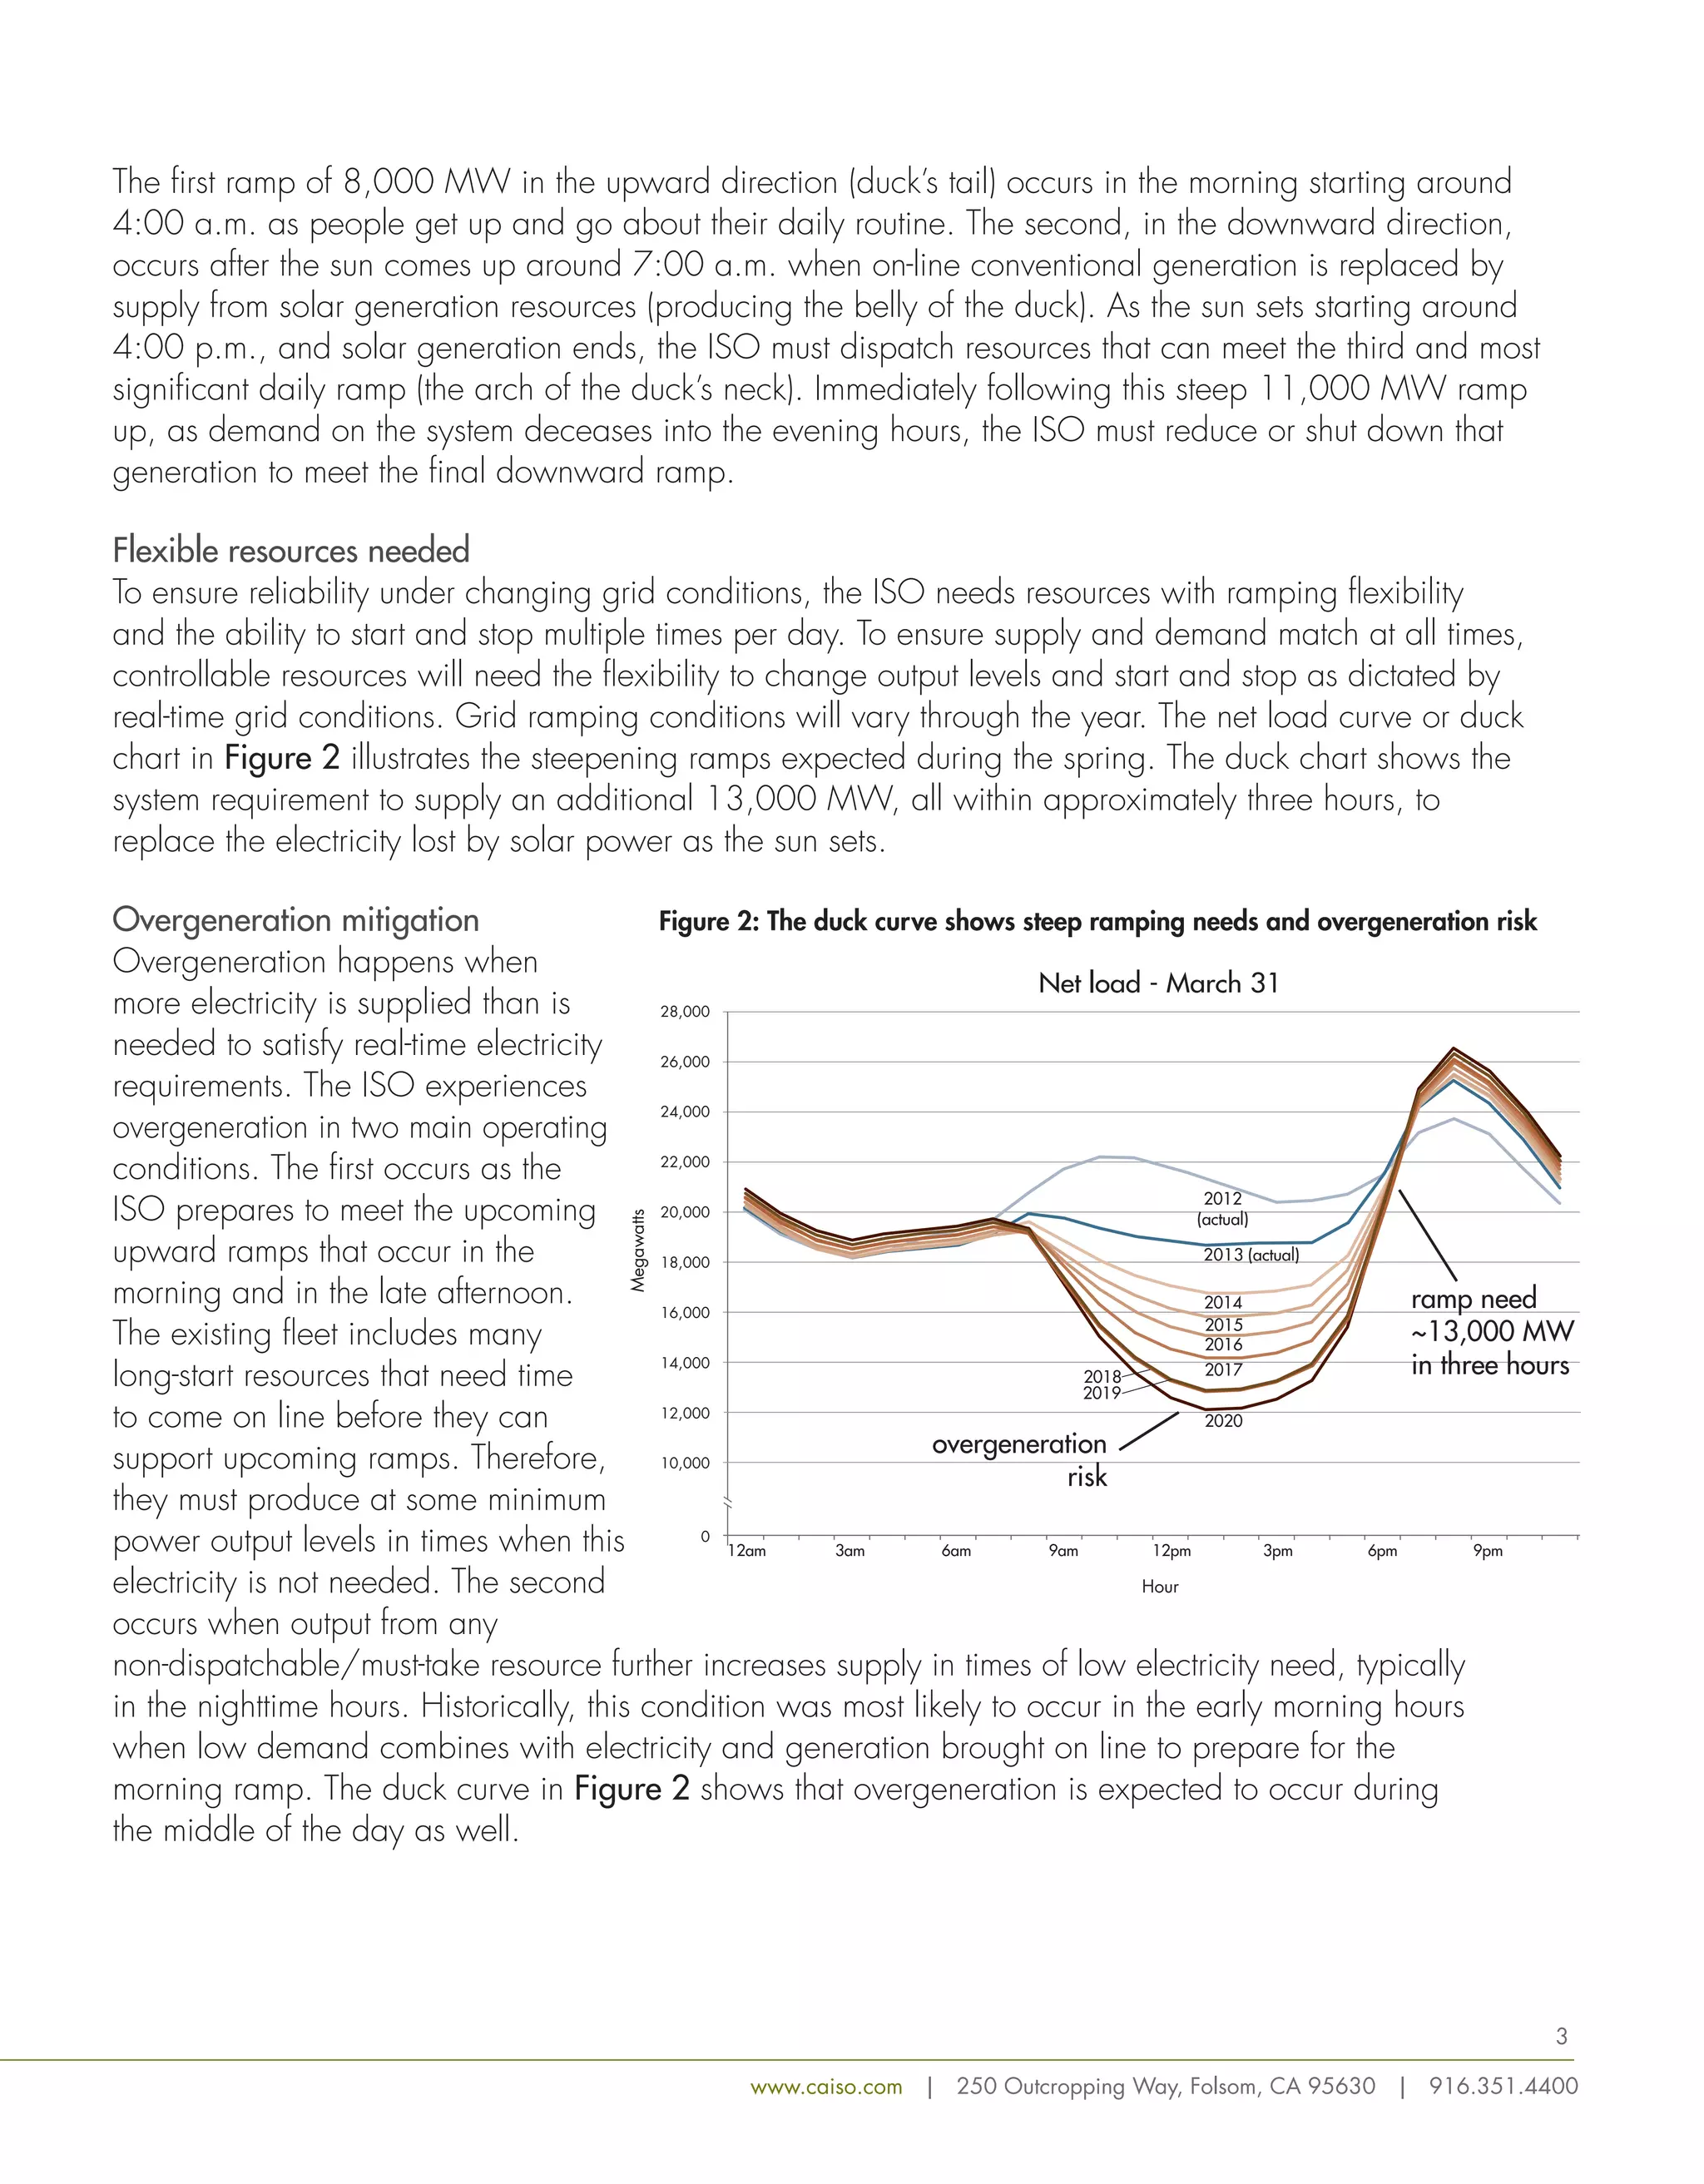
This document discusses how the increasing use of renewable energy is changing net load patterns on the electric grid in California. It introduces the concept of the "duck curve" which depicts steep ramps in net load in the mornings and evenings as solar power comes online and offline. To reliably operate under these changing conditions, the grid requires flexible resources that can quickly adjust power production through ramping, storage and demand response. Issues like overgeneration and reduced frequency response may occur and will require mitigation strategies to maintain reliability as renewable penetration increases.
The electric grid and the requirements to manage it are changing.
Renewable resources increasingly satisfy the state’s electricity
demand. Existing and emerging technology enables consumer control of electricity consumption. These factors lead to different operating conditions that require flexible resource capabilities to ensure green grid reliability. The ISO created future scenarios of net load curves to illustrate these changing conditions. Net load is the difference between forecasted load and expected electricity production from variable generation resources. In certain times of the year, these curves produce
a “belly” appearance in the mid-afternoon that quickly ramps up to produce an “arch” similar to
the neck of a duck—hence the industry moniker of “The Duck Chart”.
DC-Coupled Solar Plus Storage: Results from the FieldNicole Green
Dynapower will join Duke Energy to explain the decision-making process, challenges and opportunities and conclusions of a DC-Coupled Solar plus Storage project, including data from Duke Energy's Mt. Holly R&D Lab.
DC-Coupled Solar Plus Storage: Results from the FieldNicole Green
Dynapower will join Duke Energy to explain the decision-making process, challenges and opportunities and conclusions of a DC-Coupled Solar plus Storage project, including data from Duke Energy's Mt. Holly R&D Lab.
Montecito Community Microgrid: Renewables-driven resilience for critical faci...Clean Coalition
Craig Lewis, Executive Director for the Clean Coalition, was a panelist at the Rebuilding Montecito: Pathways to a Resilient Future event, which took place on February 20, 2018 in Santa Barbara, CA.
Improving the voltage quality of Abu Hummus network in Egypt IJECEIAES
In this paper the performance of the electrical network of Egypt is studied by considering a small part on the network (Abu Hummus city). The transmission network of Abu Hummus city was created for 66 kV, 11 kV, and 0.4 kV in the digital simulation and electrical network calculation (DIgSILENT power factory software) to study the voltage profiles. The load flow operational analysis was performed to obtain the voltage magnitudes at every bus bar. The voltage magnitudes in 11 kV and 0.4 kV networks were 10% to 15% less than the nominal value due to overloading off the transmission lines and the voltage magnitudes in 66 kV was within permissible limits. By using automatic tap-changing transformer or Static VAR System, the main idea of this paper is to obtain the voltage profiles at every bus bar to improve the voltage quality of the networks, so as to achieve better voltage profiles on the low voltage side without much effect on high voltage side under various operating conditions.
Asoka Technologies offer latest IEEE Electrical projects for BTech and MTech. We have many projects and we do provide abstract, paper explanation, simulink model explanation and exact results within time.
We do develop your own ideas also.
Rural electrification by Lakshmi.Nidoni-seminar pptlakshmi nidoni
ABSTRACT
In India, more than 200 million people live in rural areas without access to grid-connected power. A convenient & cost-effective solution would be hybrid power systems which can reduce dependency on grid supply, improve reliability. For a typical domestic load a solar –wind hybrid system is designed with charge controller to charge a conventional battery. To optimize system efficiency, a simple algorithm is developed for system sizing. Total cost of unit is calculated using life cycle cost analysis and payback period.
Presentation given at the Indian Cold Chain Show by Mr. Manoj Pande highlighting the method , need and execution of India's most successful solar cold storage.
For More Details write to us at info@statconenergiaa.com
Or visit us at www.statconenergiaa.com
Alexey Khokhlov, Head of Power and Utilities Research. DISCLAIMER: Stockholm Institute of Transition Economics (SITE) got permission to upload the presentation slides from the speaker. The presentation was held during the SITE Energy Talk 2021 called "Energy storage: Opportunities and challenges".
EirGrid plc is the independent electricity Transmission System
Operator (TSO) in Ireland and the Market Operator in the
wholesale electricity trading system. EirGrid’s role is to deliver
services to generators, suppliers and customers across the
high voltage electricity system, and to put in place the grid
infrastructure needed to support Ireland’s economy. EirGrid
develops, maintains and operates a safe, secure, reliable,
economical and efficient transmission system.
Electricity is an essential and convenient service
provided to two million electricity consumers, including
domestic customers, small and medium industry, farms and
agribusiness, and large high-technology industrial customers.
This illustrates the vital nature of the service EirGrid provides.
The International Journal of Engineering & Science is aimed at providing a platform for researchers, engineers, scientists, or educators to publish their original research results, to exchange new ideas, to disseminate information in innovative designs, engineering experiences and technological skills. It is also the Journal's objective to promote engineering and technology education. All papers submitted to the Journal will be blind peer-reviewed. Only original articles will be published.
The papers for publication in The International Journal of Engineering& Science are selected through rigorous peer reviews to ensure originality, timeliness, relevance, and readability.
Grid Integration of Renewable Energy in India under Mitigation of High Penetration Challenges of Renewables into the Grid: Storage, Demand Response and Interconnections
The function of a power station is to de-
liver power to a large number of consum
ers. However, the power demands of dif-
ferent consumers vary in accordance with their
activities. The result of this variation in demand
is that load on a power station is never constant,
rather it varies from time to time. Most of the
complexities of modern power plant operation
arise from the inherent variability of the load de-
manded by the users. Unfortunately, electrical
power cannot be stored and, therefore, the power
station must produce power as and when de-
manded to meet the requirements of the consum-
ers. On one hand, the power engineer would like
that the alternators in the power station should
run at their rated capacity for maximum efficiency
and on the other hand, the demands of the con-
sumers have wide variations. This makes the
design of a power station highly complex. In this
chapter, we shall focus our attention on the prob-
lems of variable load on power stations.
A Review on Power Flexibility, Generation and Distribution Systemijtsrd
Distributed power generation is the latest field because of the ability to accommodate various types of Renewable alternative energy sources, its hidden potential to improve the energy efficiency and power system capability, and its promise for power reliability and security. Many distributed energy sources exist such solar energy, fuel cell, micro turbine, and wind energy. Distributed power generation concept has been implemented in various places with various degree of complexity. A comprehensive review on the distributed power generation is presented in this paper. Rahul Gokhle | Pramod Kumar Rathore "A Review on Power Flexibility, Generation and Distribution System" Published in International Journal of Trend in Scientific Research and Development (ijtsrd), ISSN: 2456-6470, Volume-5 | Issue-6 , October 2021, URL: https://www.ijtsrd.com/papers/ijtsrd46379.pdf Paper URL : https://www.ijtsrd.com/engineering/electrical-engineering/46379/a-review-on-power-flexibility-generation-and-distribution-system/rahul-gokhle
Similar to What the duck curve tells us about managing a green grid (20)
Hybrid resources: Challenges, Implications, Opportunities, and InnovationAndrew Gelston
Publication in the IEEE power & energy magazine November/December 2021 Issue on Hybrid renewable + Storage resources.
Layman explanation of why 1+1 = 3, rather then 2, with Hybrid co-optimizing internally as a single resource
NextEra Energy and Hawaiian Electric Industries to Combine (December 2014)Andrew Gelston
Achieving a More Affordable Clean Energy Future For Hawaii
Hawaiian Electric Industries Announces Plan to Spin off ASB Hawaii into an Independent Publicly Traded Company
December 3, 2014
What the duck curve tells us about managing a green grid
1. FAST FACTS
What the duck curve tells us about
managing a green grid
The electric grid and the requirements to manage it are changing.
Renewable resources increasingly satisfy the state’s electricity
demand. Existing and emerging technology enables consumer control of electricity consumption.
These factors lead to different operating conditions that require flexible resource capabilities to
ensure green grid reliability. The ISO created future scenarios of net load curves to illustrate these
changing conditions. Net load is the difference between forecasted load and expected electricity
production from variable generation resources. In certain times of the year, these curves produce
a “belly” appearance in the mid-afternoon that quickly ramps up to produce an “arch” similar to
the neck of a duck—hence the industry moniker of “The Duck Chart”.
Energy and environmental goals drive change
In California, energy and environmental policy initiatives are driving electric grid changes. Key initiatives
include the following:
• 33 percent of retail electricity from renewable power by 2020;
• greenhouse gas emissions reduction goal to 1990 levels by 2020;
• regulations in the next 4-9 years requiring power plants that use coastal water for
cooling to either repower, retrofit or retire;
• policies to increase distributed generation; and
• an executive order for 1.5 million zero emission vehicles by 2025.
New operating conditions emerge
The ISO performed detailed analysis for every day of the year from 2012 to 2020 to understand
changing grid conditions. The analysis shows how real-time electricity net demand changes as policy
initiatives are realized. In particular, several conditions emerge that will require specific resource
operational capabilities. The conditions include the following:
• short, steep ramps – when the ISO must bring on or shut down generation resources to
meet an increasing or decreasing electricity demand quickly, over a short period of time;
• overgeneration risk – when more electricity is supplied than is needed to satisfy
real-time electricity requirements; and
• decreased frequency response – when less resources are operating and available to
automatically adjust electricity production to maintain grid reliability.
www.caiso.com | 250 Outcropping Way, Folsom, CA 95630 | 916.351.4400
1
2. Green grid reliability requires flexible resource capabilities
To reliably operate in these conditions, the ISO requires flexible resources defined by their operating
capabilities. These characteristics include the ability to perform the following functions:
• sustain upward or downward ramp;
• respond for a defined period of time;
• change ramp directions quickly;
• store energy or modify use;
• react quickly and meet expected operating levels;
• start with short notice from a zero or low-electricity operating level;
• start and stop multiple times per day; and
• accurately forecast operating capability.
Reliability requires balancing supply and demand
The net load curves represent the variable portion that ISO must meet in real time. To maintain reliability
the ISO must continuously match the demand for electricity with supply on a second-by-second basis.
Historically, the ISO directed conventional, controllable power plant units to move up or down with the
instantaneous or variable demand. With the growing penetration of renewables on the grid, there are
higher levels of non-controllable, variable generation resources. Because of that, the ISO must direct
controllable resources to match both variable demand and variable supply. The net load curves best
illustrate this variability. The net load is calculated by taking the forecasted load and subtracting the
forecasted electricity production from variable generation resources, wind and solar. These curves
capture the forecast variability. The daily net load curves capture one aspect of forecasted variability.
There will also be variability intra-hour and day-to-day that must be managed. The ISO created curves
for every day of the year from 2012 to 2020 to illustrate how the net load following need varies with
changing grid conditions.
Ramping flexibility
The ISO needs a resource
34,000
mix that can react quickly to
32,000
adjust electricity production
30,000
to meet the sharp changes
in electricity net demand.
28,000
Figure 1 shows a net load
26,000
curve for the January 11
24,000
study day for years 2012
through 2020. This curve
22,000
shows the megawatt (MW)
20,000
amounts the ISO must follow
18,000
on the y axis over the different
0
hours of the day shown on
the x axis. Four distinct ramp periods emerge.
Megawatts
Net load - January 11
2018
12am 3am 46am 79am 1012pm 13pm 6pm 9pm
Hour
2012
(actual)
2013
2014
2020
2017
2015
2016
2019
start
stop
start
stop
Figure 1
2
www.caiso.com | 250 Outcropping Way, Folsom, CA 95630 | 916.351.4400
3. The first ramp of 8,000 MW in the upward direction (duck’s tail) occurs in the morning starting around
4:00 a.m. as people get up and go about their daily routine. The second, in the downward direction,
occurs after the sun comes up around 7:00 a.m. when on-line conventional generation is replaced by
supply from solar generation resources (producing the belly of the duck). As the sun sets starting around
4:00 p.m., and solar generation ends, the ISO must dispatch resources that can meet the third and most
significant daily ramp (the arch of the duck’s neck). Immediately following this steep 11,000 MW ramp
up, as demand on the system deceases into the evening hours, the ISO must reduce or shut down that
generation to meet the final downward ramp.
Flexible resources needed
To ensure reliability under changing grid conditions, the ISO needs resources with ramping flexibility
and the ability to start and stop multiple times per day. To ensure supply and demand match at all times,
controllable resources will need the flexibility to change output levels and start and stop as dictated by
real-time grid conditions. Grid ramping conditions will vary through the year. The net load curve or duck
chart in Figure 2 illustrates the steepening ramps expected during the spring. The duck chart shows the
system requirement to supply an additional 13,000 MW, all within approximately three hours, to
replace the electricity lost by solar power as the sun sets.
Overgeneration mitigation
Figure 2: The duck curve shows steep ramping needs and overgeneration risk
Overgeneration happens when
more electricity is supplied than is
28,000
needed to satisfy real-time electricity
26,000
requirements. The ISO experiences
overgeneration in two main operating
24,000
conditions. The first occurs as the
22,000
ISO prepares to meet the upcoming
20,000
upward ramps that occur in the
18,000
morning and in the late afternoon.
The existing fleet includes many
16,000
long-start resources that need time
14,000
to come on line before they can
12,000
support upcoming ramps. Therefore,
10,000
they must produce at some minimum
power output levels in times when this
0
electricity is not needed. The second
occurs when output from any
non-dispatchable/must-take resource further increases supply in times of low electricity need, typically
in the nighttime hours. Historically, this condition was most likely to occur in the early morning hours
when low demand combines with electricity and generation brought on line to prepare for the
morning ramp. The duck curve in Figure 2 shows that overgeneration is expected to occur during
the middle of the day as well.
Megawatts
Net load - March 31
2012
(actual)
2013 (actual)
2014
2015
2016
2017
2018
12am 3am 4 5 6am 7 8 9am 10 11 12pm 13 14 3pm 16 17 6pm 19 20 9pm 22 23
Hour
2020
2019
ramp need
~13,000 MW
in three hours
overgeneration
risk
3
www.caiso.com | 250 Outcropping Way, Folsom, CA 95630 | 916.351.4400