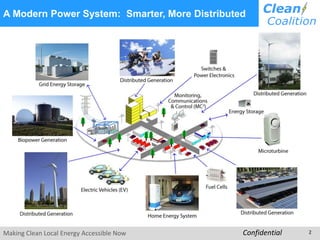
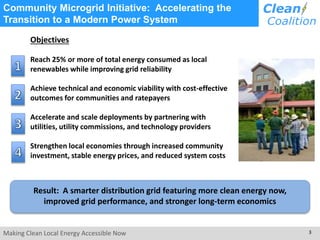
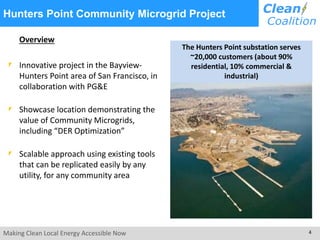
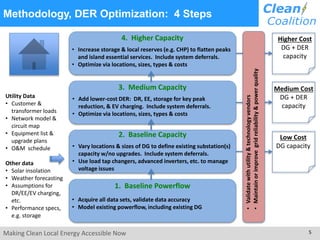
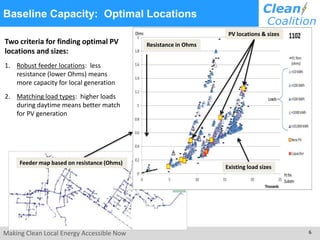
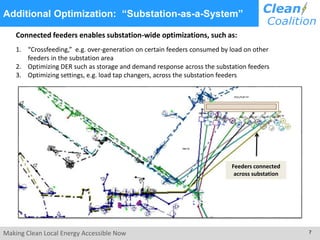
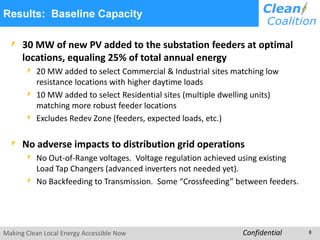
Community Microgrid Initiative 
Overview 
Greg Thomson 
Director of Programs 
Clean Coalition 
415-845-3872 mobile 
greg@clean-coalition.org 
Making Clean Local Energy Accessible Now Confidential
A Modern Power System: Smarter, More Distributed 
Making Clean Local Energy Accessible Now Confidential 2
Community Microgrid Initiative: Accelerating the 
Transition to a Modern Power System 
Objectives 
Reach 25% or more of total energy consumed as local 
renewables while improving grid reliability 
Achieve technical and economic viability with cost-effective 
outcomes for communities and ratepayers 
Accelerate and scale deployments by partnering with 
utilities, utility commissions, and technology providers 
Strengthen local economies through increased community 
investment, stable energy prices, and reduced system costs 
Result: A smarter distribution grid featuring more clean energy now, 
improved grid performance, and stronger long-term economics 
Making Clean Local Energy Accessible Now 3
Hunters Point Community Microgrid Project 
Overview 
Innovative project in the Bayview- 
Hunters Point area of San Francisco, in 
collaboration with PG&E 
Showcase location demonstrating the 
value of Community Microgrids, 
including “DER Optimization” 
Scalable approach using existing tools 
that can be replicated easily by any 
utility, for any community area 
The Hunters Point substation serves 
~20,000 customers (about 90% 
residential, 10% commercial & 
industrial) 
Making Clean Local Energy Accessible Now 4
Methodology, DER Optimization: 4 Steps 
Utility Data 
• Customer & 
transformer loads 
• Network model & 
circuit map 
• Equipment list & 
upgrade plans 
• O&M schedule 
Other data 
• Solar insolation 
• Weather forecasting 
• Assumptions for 
DR/EE/EV charging, 
etc. 
• Performance specs, 
e.g. storage 
4. Higher Capacity 
• Increase storage & local reserves (e.g. CHP) to flatten peaks 
and island essential services. Include system deferrals. 
• Optimize via locations, sizes, types & costs 
3. Medium Capacity 
• Add lower-cost DER: DR, EE, storage for key peak 
reduction, & EV charging. Include system deferrals. 
• Optimize via locations, sizes, types & costs 
2. Baseline Capacity 
• Vary locations & sizes of DG to define existing substation(s) 
capacity w/no upgrades. Include system deferrals. 
• Use load tap changers, advanced inverters, etc. to manage 
voltage issues 
1. Baseline Powerflow 
• Acquire all data sets, validate data accuracy 
• Model existing powerflow, including existing DG 
Higher Cost 
DG + DER 
capacity 
Medium Cost 
DG + DER 
capacity 
Low Cost 
DG capacity 
• Validate with utility & technology vendors 
• Maintain or improve grid reliability & power quality 
Making Clean Local Energy Accessible Now 5
Baseline Capacity: Optimal Locations 
Two criteria for finding optimal PV 
locations and sizes: 
1. Robust feeder locations: less 
resistance (lower Ohms) means 
more capacity for local generation 
2. Matching load types: higher loads 
during daytime means better match 
for PV generation 
PV locations & sizes 
Resistance in Ohms 
Existing load sizes 
Feeder map based on resistance (Ohms) 
Making Clean Local Energy Accessible Now 6
Additional Optimization: “Substation-as-a-System” 
Connected feeders enables substation-wide optimizations, such as: 
1. “Crossfeeding,” e.g. over-generation on certain feeders consumed by load on other 
feeders in the substation area 
2. Optimizing DER such as storage and demand response across the substation feeders 
3. Optimizing settings, e.g. load tap changers, across the substation feeders 
Feeders connected 
across substation 
Making Clean Local Energy Accessible Now 7
Results: Baseline Capacity 
30 MW of new PV added to the substation feeders at optimal 
locations, equaling 25% of total annual energy 
20 MW added to select Commercial & Industrial sites matching low 
resistance locations with higher daytime loads 
10 MW added to select Residential sites (multiple dwelling units) 
matching more robust feeder locations 
Excludes Redev Zone (feeders, expected loads, etc.) 
No adverse impacts to distribution grid operations 
No Out-of-Range voltages. Voltage regulation achieved using existing 
Load Tap Changers (advanced inverters not needed yet). 
No Backfeeding to Transmission. Some “Crossfeeding” between feeders. 
Making Clean Local Energy Accessible Now Confidential 8

Greg Thomson - Community Microgrid - (17 oct 2014)

  • 1.
    Community Microgrid Initiative Overview Greg Thomson Director of Programs Clean Coalition 415-845-3872 mobile greg@clean-coalition.org Making Clean Local Energy Accessible Now Confidential
  • 2.
    A Modern PowerSystem: Smarter, More Distributed Making Clean Local Energy Accessible Now Confidential 2
  • 3.
    Community Microgrid Initiative:Accelerating the Transition to a Modern Power System Objectives Reach 25% or more of total energy consumed as local renewables while improving grid reliability Achieve technical and economic viability with cost-effective outcomes for communities and ratepayers Accelerate and scale deployments by partnering with utilities, utility commissions, and technology providers Strengthen local economies through increased community investment, stable energy prices, and reduced system costs Result: A smarter distribution grid featuring more clean energy now, improved grid performance, and stronger long-term economics Making Clean Local Energy Accessible Now 3
  • 4.
    Hunters Point CommunityMicrogrid Project Overview Innovative project in the Bayview- Hunters Point area of San Francisco, in collaboration with PG&E Showcase location demonstrating the value of Community Microgrids, including “DER Optimization” Scalable approach using existing tools that can be replicated easily by any utility, for any community area The Hunters Point substation serves ~20,000 customers (about 90% residential, 10% commercial & industrial) Making Clean Local Energy Accessible Now 4
  • 5.
    Methodology, DER Optimization:4 Steps Utility Data • Customer & transformer loads • Network model & circuit map • Equipment list & upgrade plans • O&M schedule Other data • Solar insolation • Weather forecasting • Assumptions for DR/EE/EV charging, etc. • Performance specs, e.g. storage 4. Higher Capacity • Increase storage & local reserves (e.g. CHP) to flatten peaks and island essential services. Include system deferrals. • Optimize via locations, sizes, types & costs 3. Medium Capacity • Add lower-cost DER: DR, EE, storage for key peak reduction, & EV charging. Include system deferrals. • Optimize via locations, sizes, types & costs 2. Baseline Capacity • Vary locations & sizes of DG to define existing substation(s) capacity w/no upgrades. Include system deferrals. • Use load tap changers, advanced inverters, etc. to manage voltage issues 1. Baseline Powerflow • Acquire all data sets, validate data accuracy • Model existing powerflow, including existing DG Higher Cost DG + DER capacity Medium Cost DG + DER capacity Low Cost DG capacity • Validate with utility & technology vendors • Maintain or improve grid reliability & power quality Making Clean Local Energy Accessible Now 5
  • 6.
    Baseline Capacity: OptimalLocations Two criteria for finding optimal PV locations and sizes: 1. Robust feeder locations: less resistance (lower Ohms) means more capacity for local generation 2. Matching load types: higher loads during daytime means better match for PV generation PV locations & sizes Resistance in Ohms Existing load sizes Feeder map based on resistance (Ohms) Making Clean Local Energy Accessible Now 6
  • 7.
    Additional Optimization: “Substation-as-a-System” Connected feeders enables substation-wide optimizations, such as: 1. “Crossfeeding,” e.g. over-generation on certain feeders consumed by load on other feeders in the substation area 2. Optimizing DER such as storage and demand response across the substation feeders 3. Optimizing settings, e.g. load tap changers, across the substation feeders Feeders connected across substation Making Clean Local Energy Accessible Now 7
  • 8.
    Results: Baseline Capacity 30 MW of new PV added to the substation feeders at optimal locations, equaling 25% of total annual energy 20 MW added to select Commercial & Industrial sites matching low resistance locations with higher daytime loads 10 MW added to select Residential sites (multiple dwelling units) matching more robust feeder locations Excludes Redev Zone (feeders, expected loads, etc.) No adverse impacts to distribution grid operations No Out-of-Range voltages. Voltage regulation achieved using existing Load Tap Changers (advanced inverters not needed yet). No Backfeeding to Transmission. Some “Crossfeeding” between feeders. Making Clean Local Energy Accessible Now Confidential 8