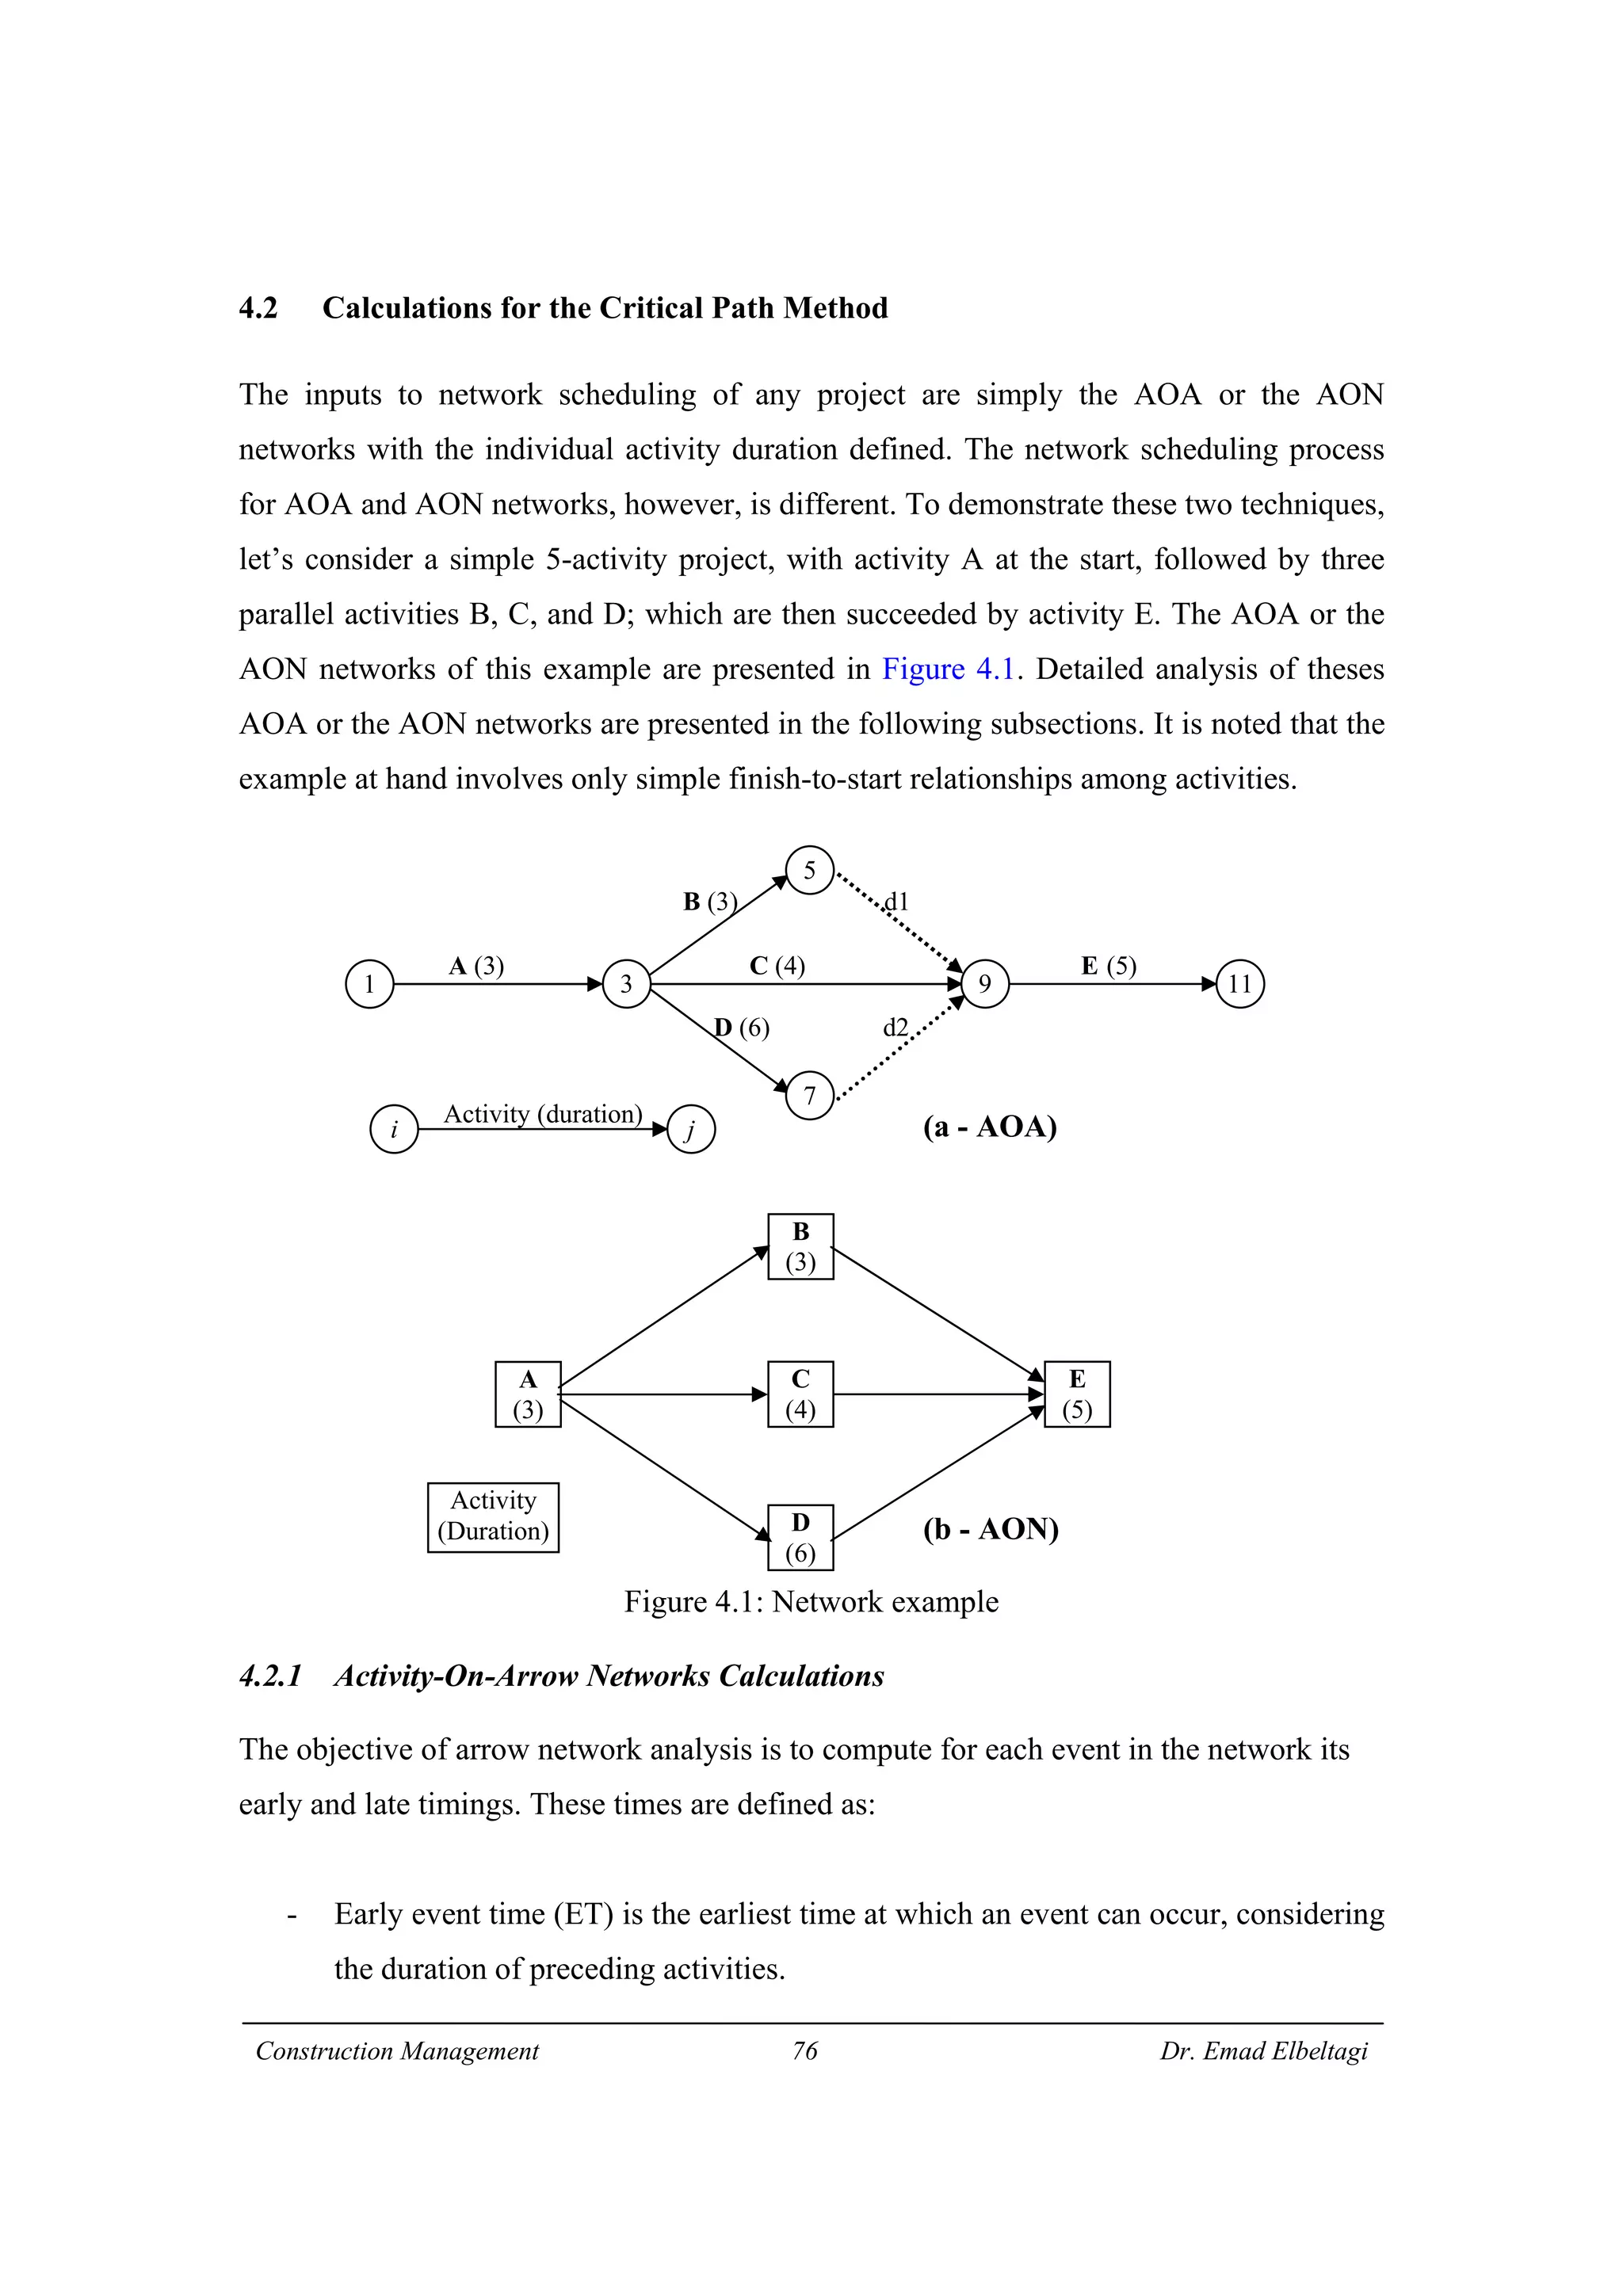
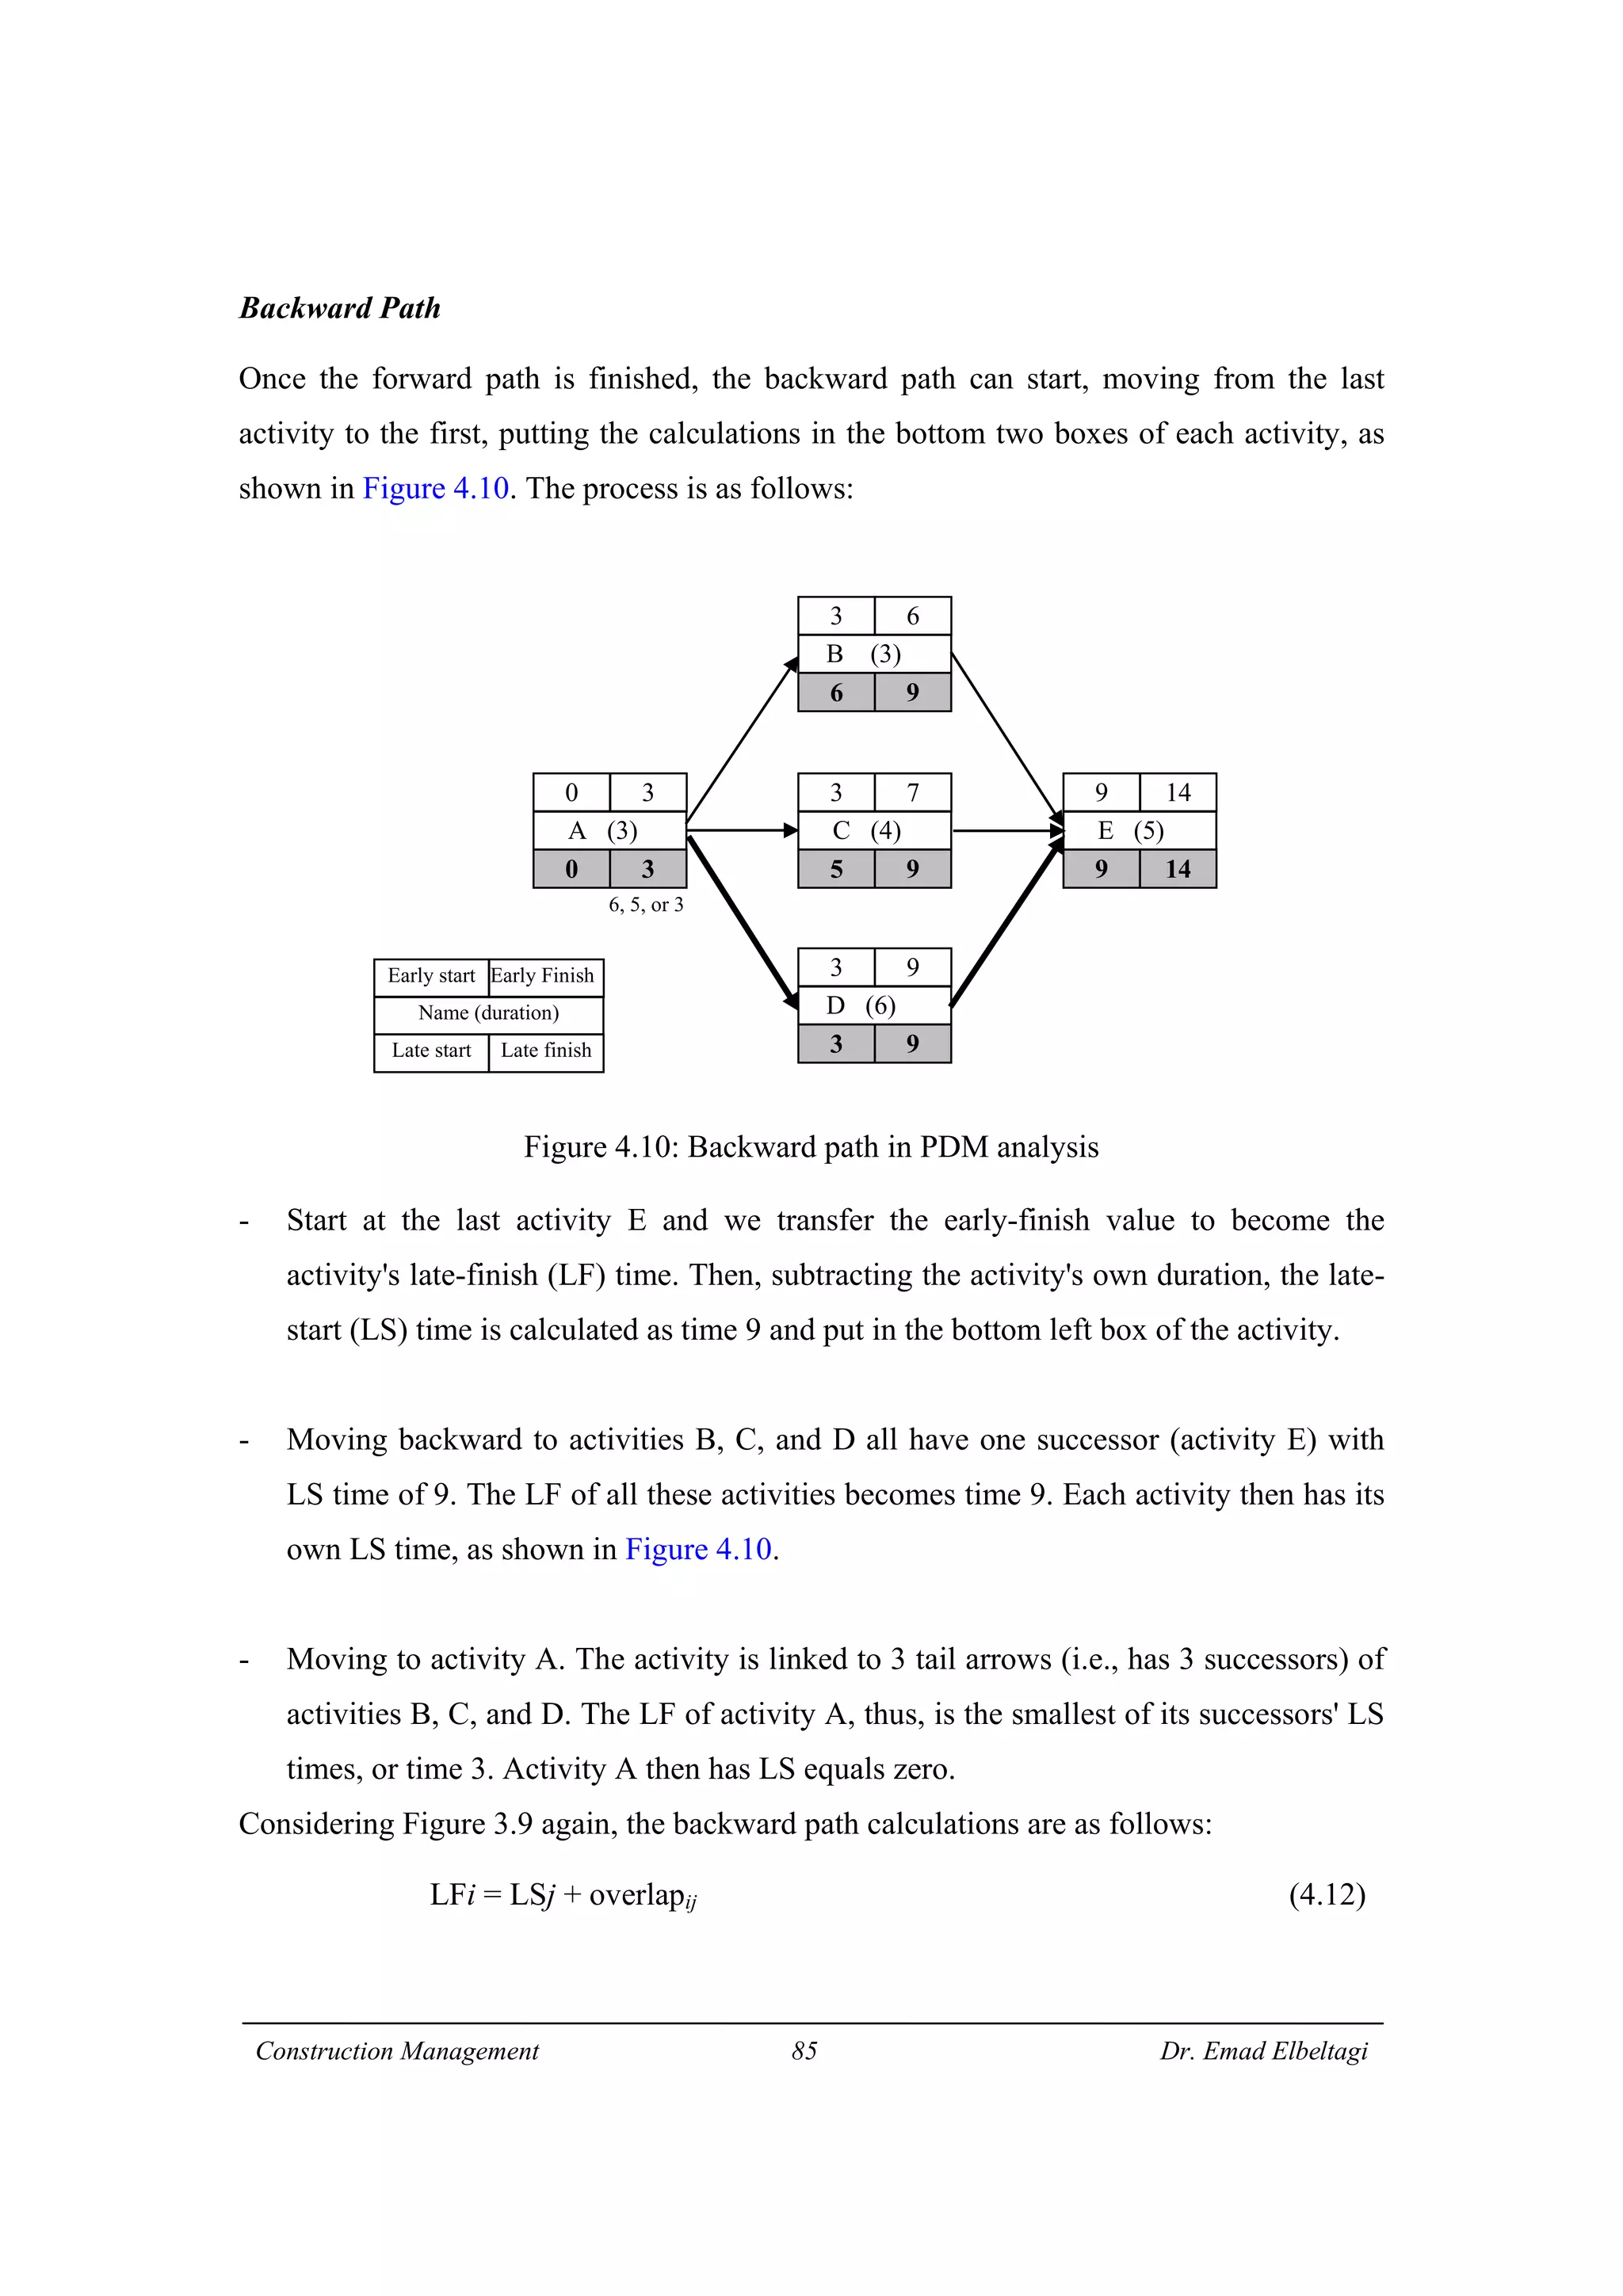
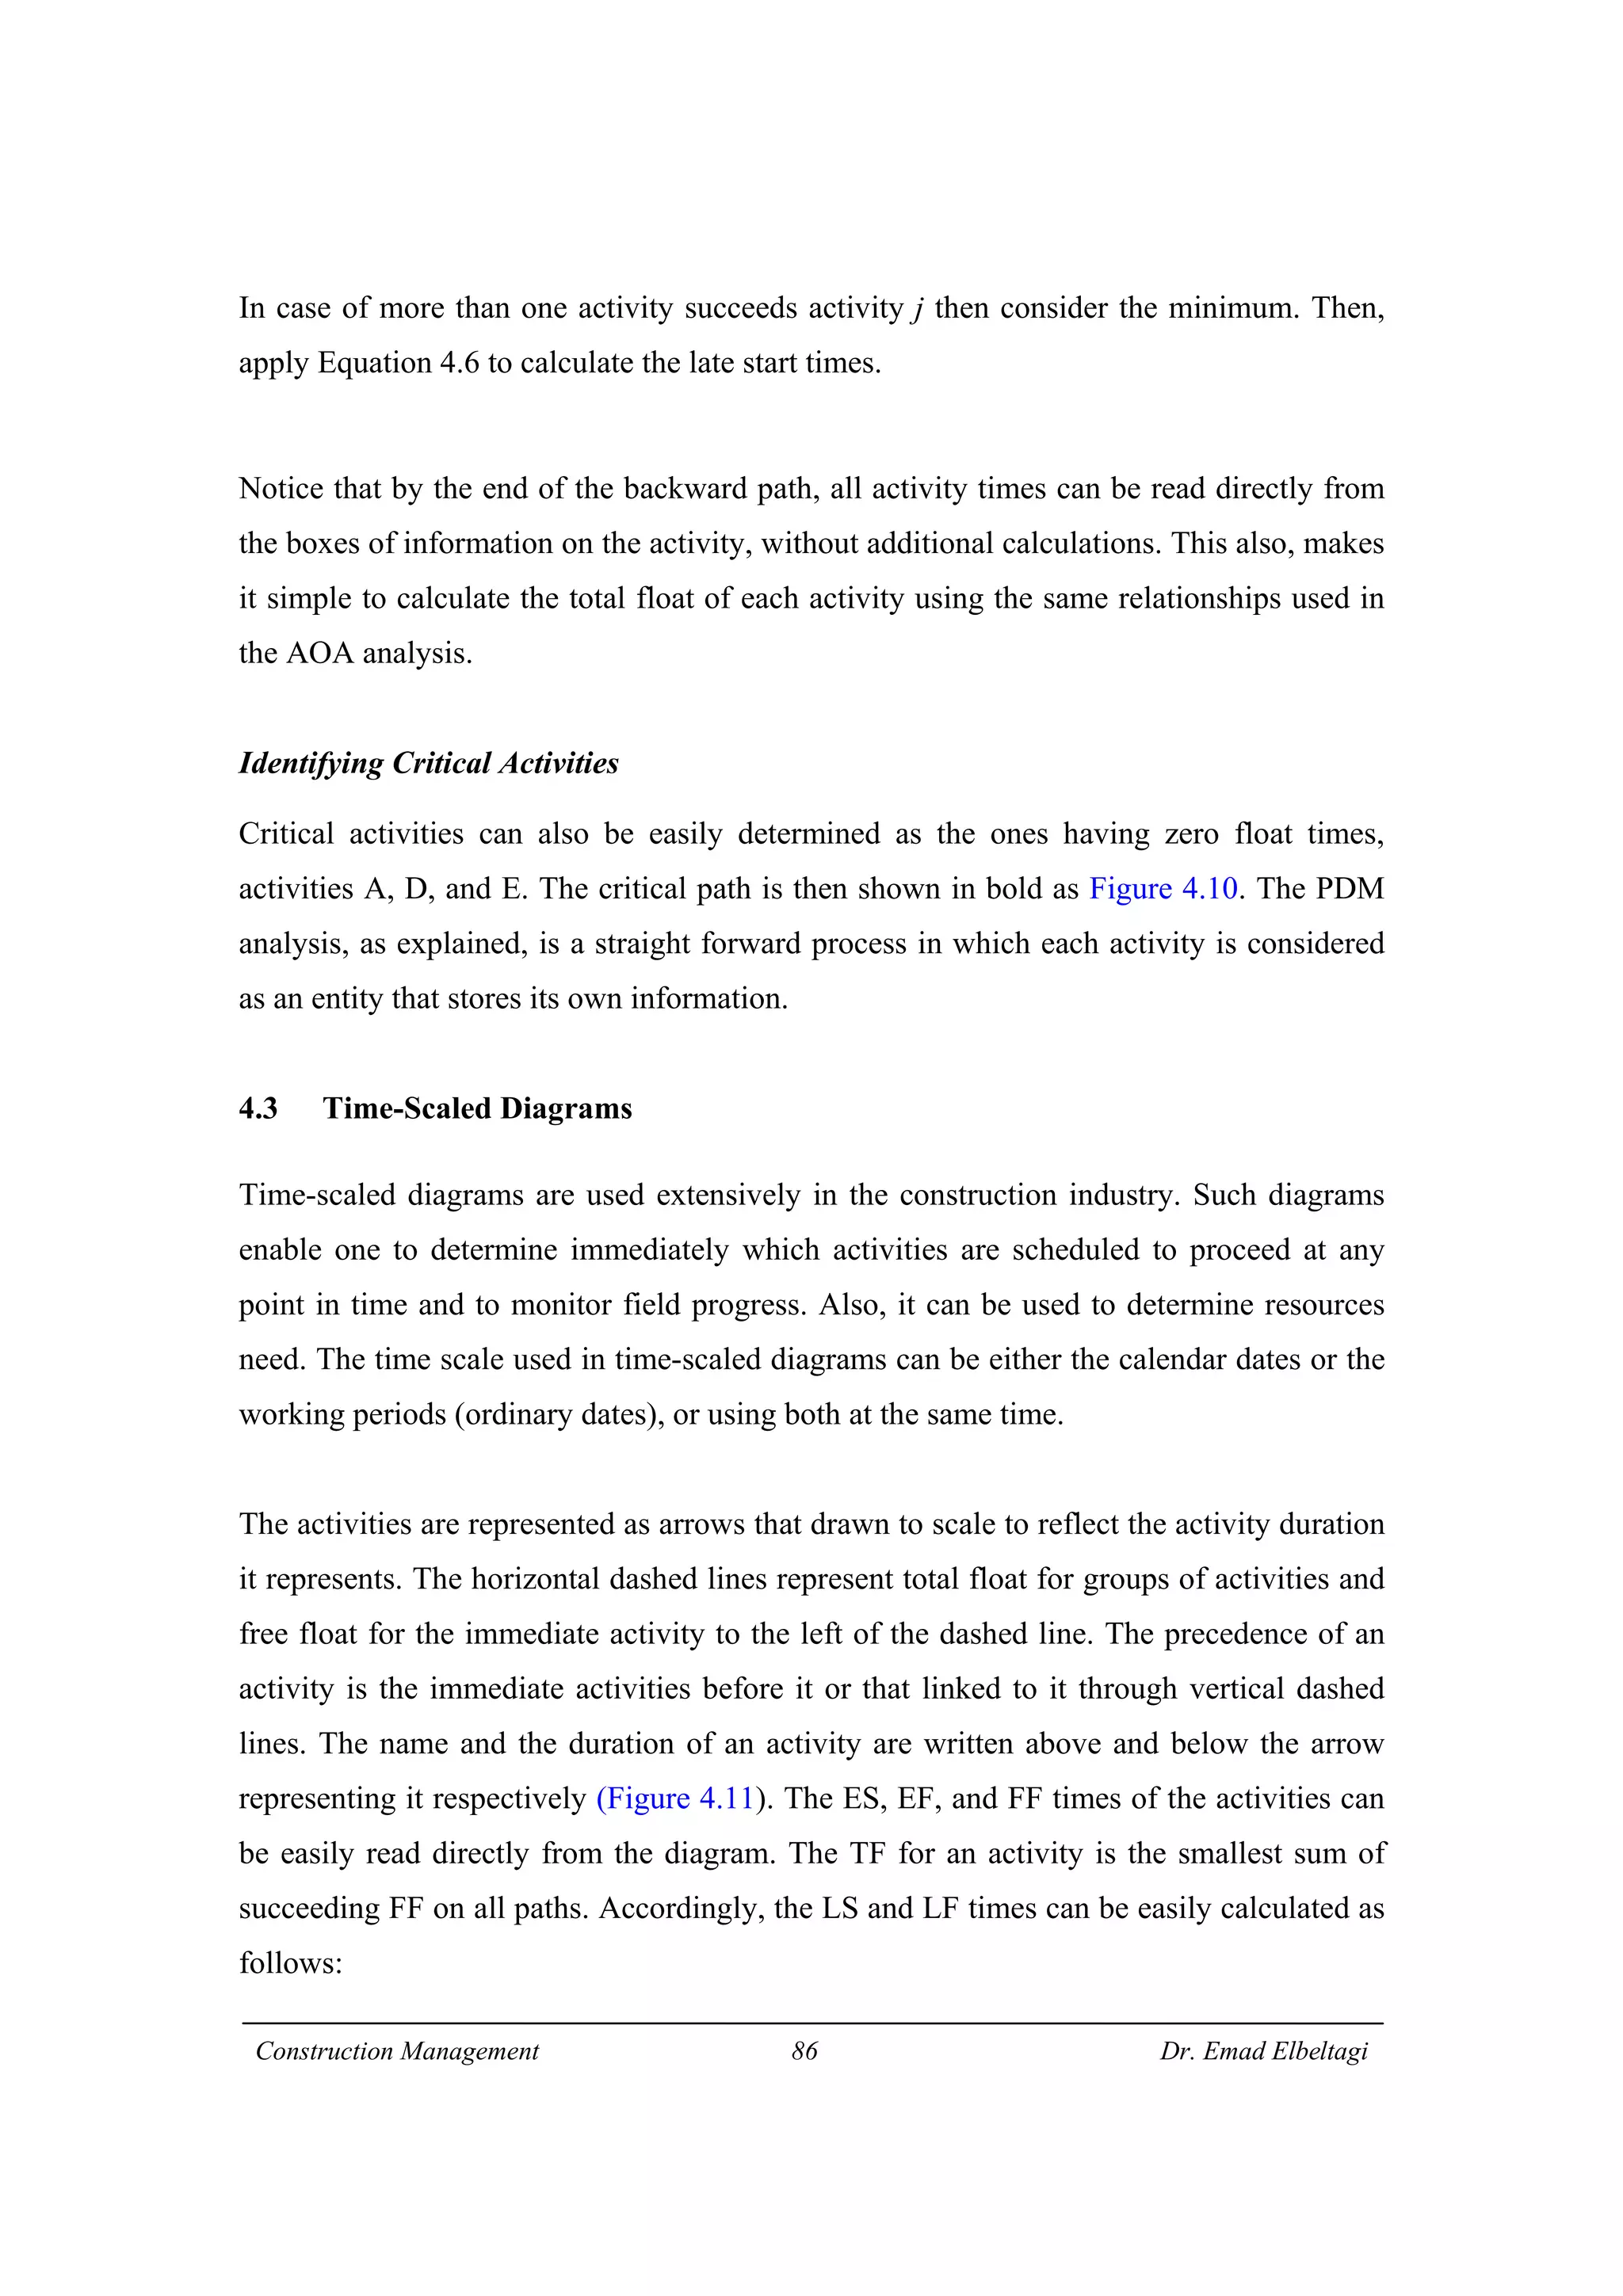
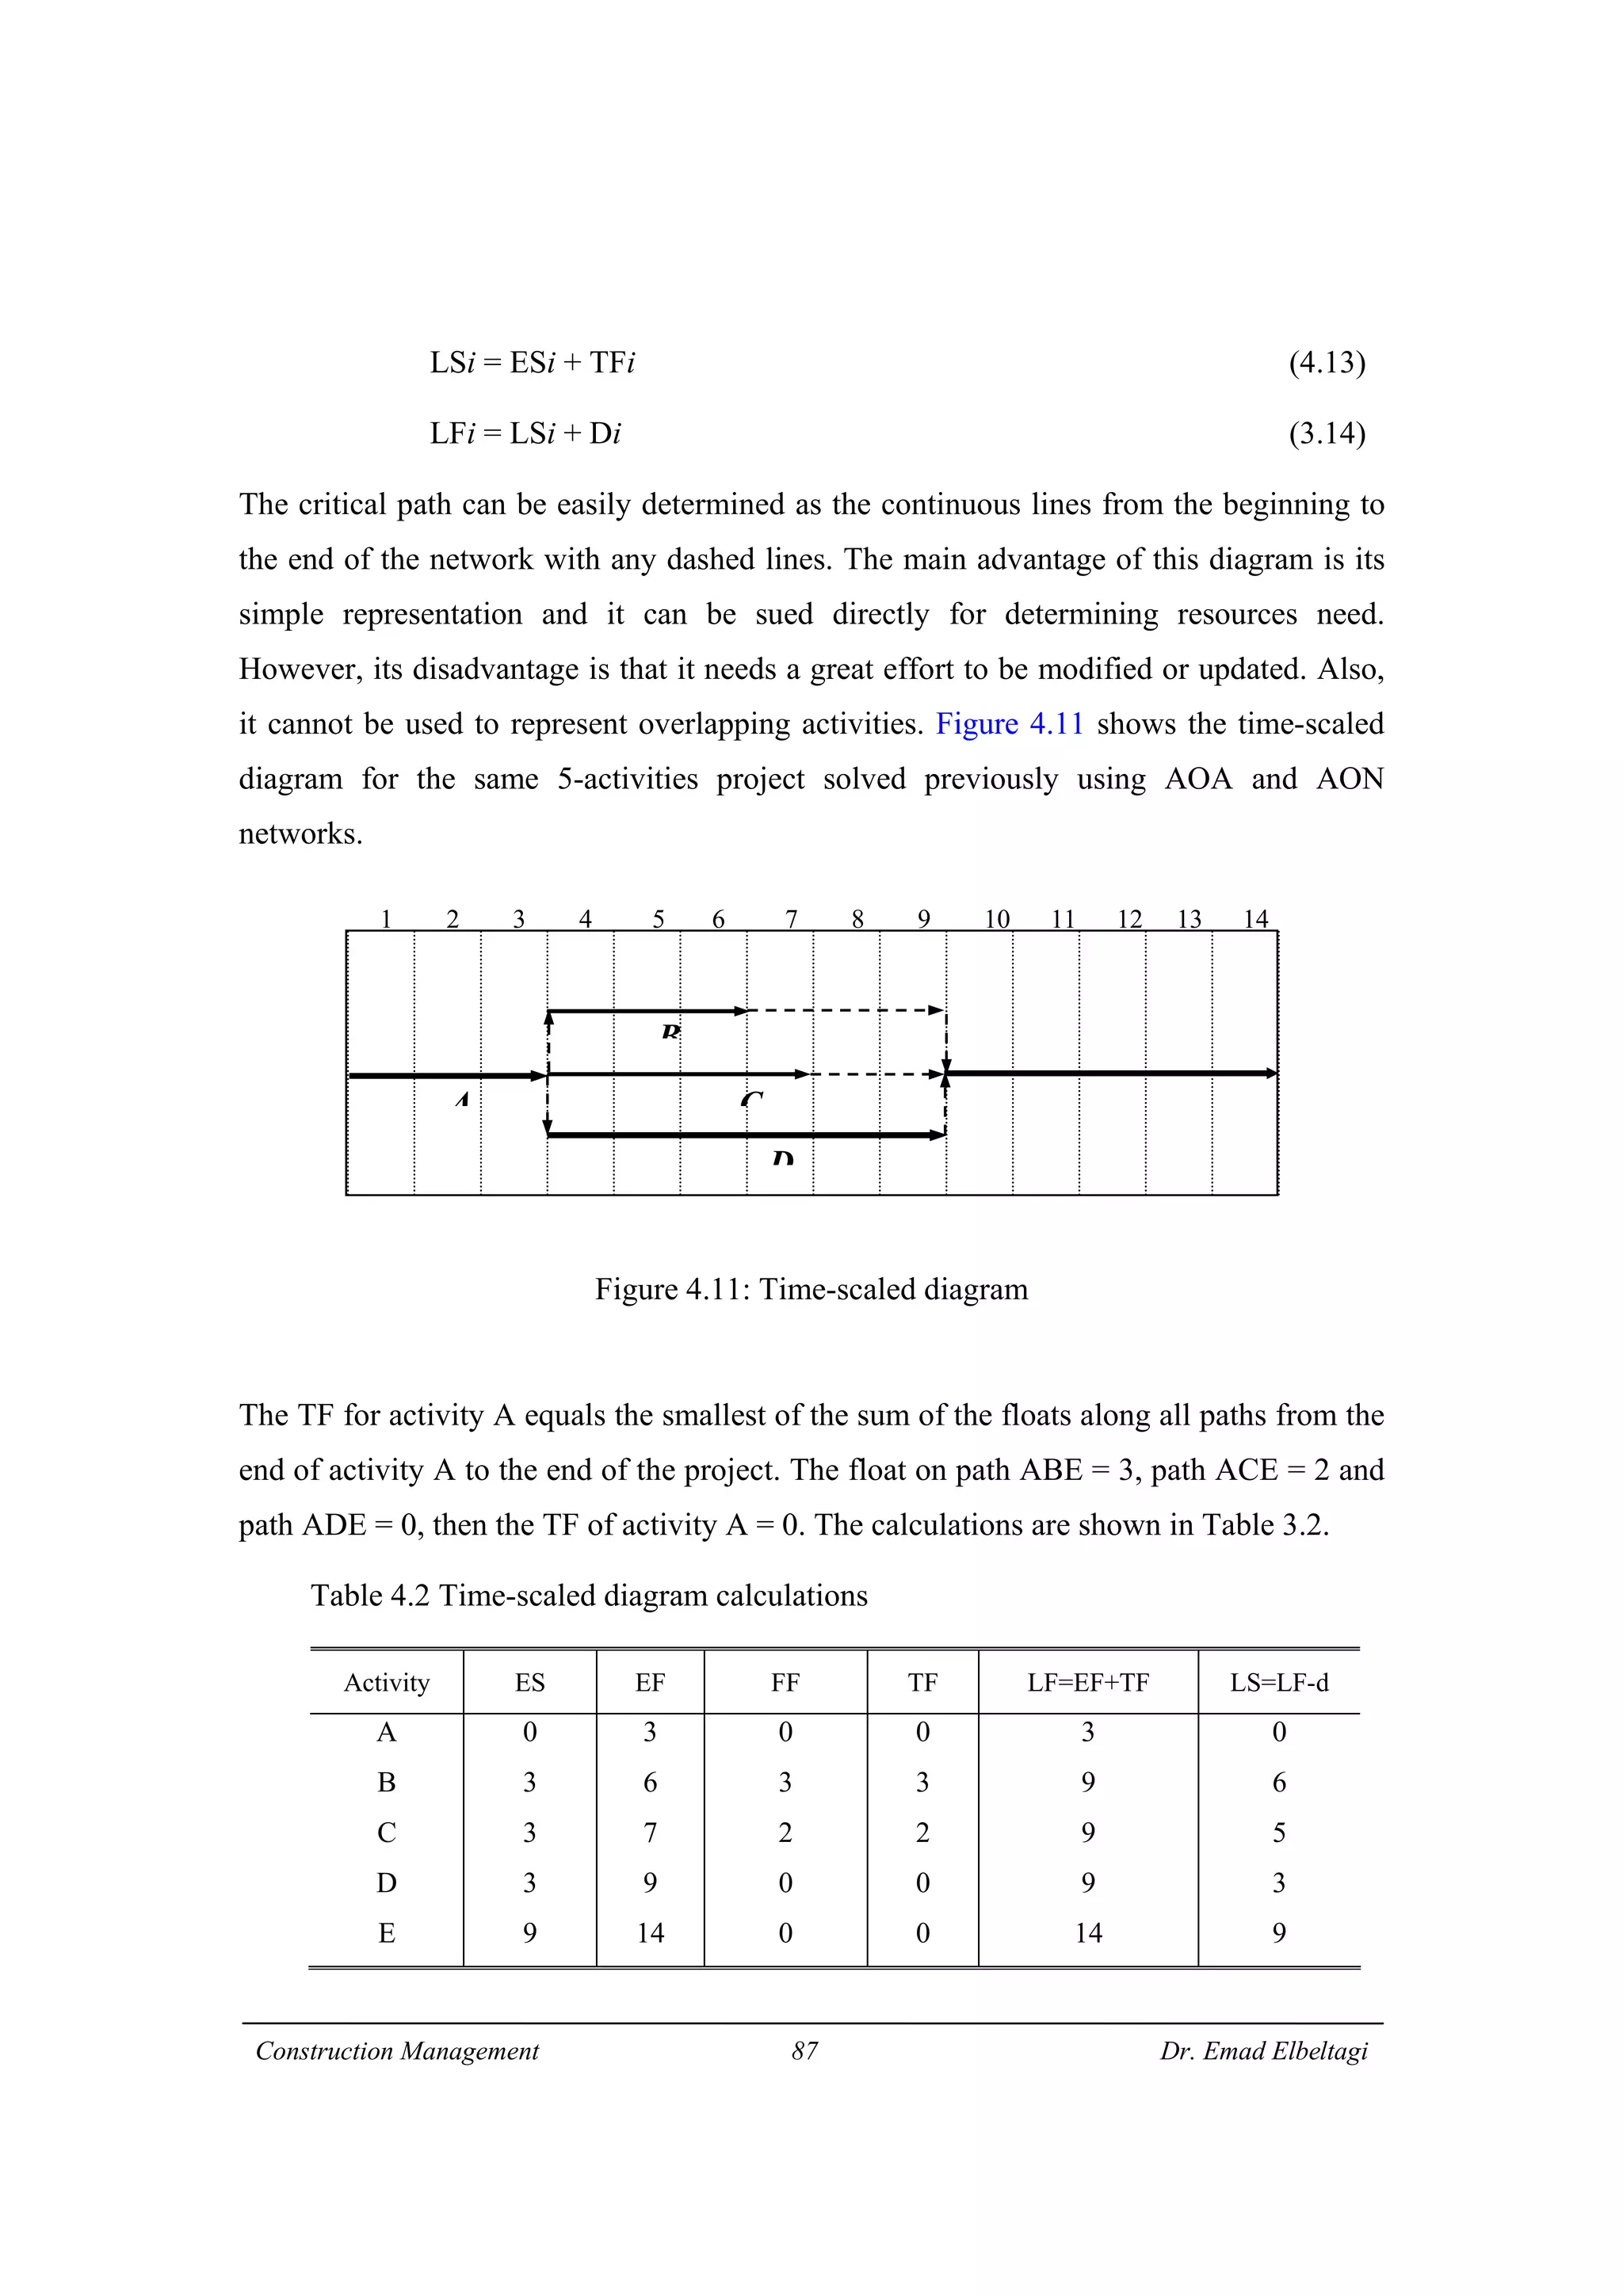
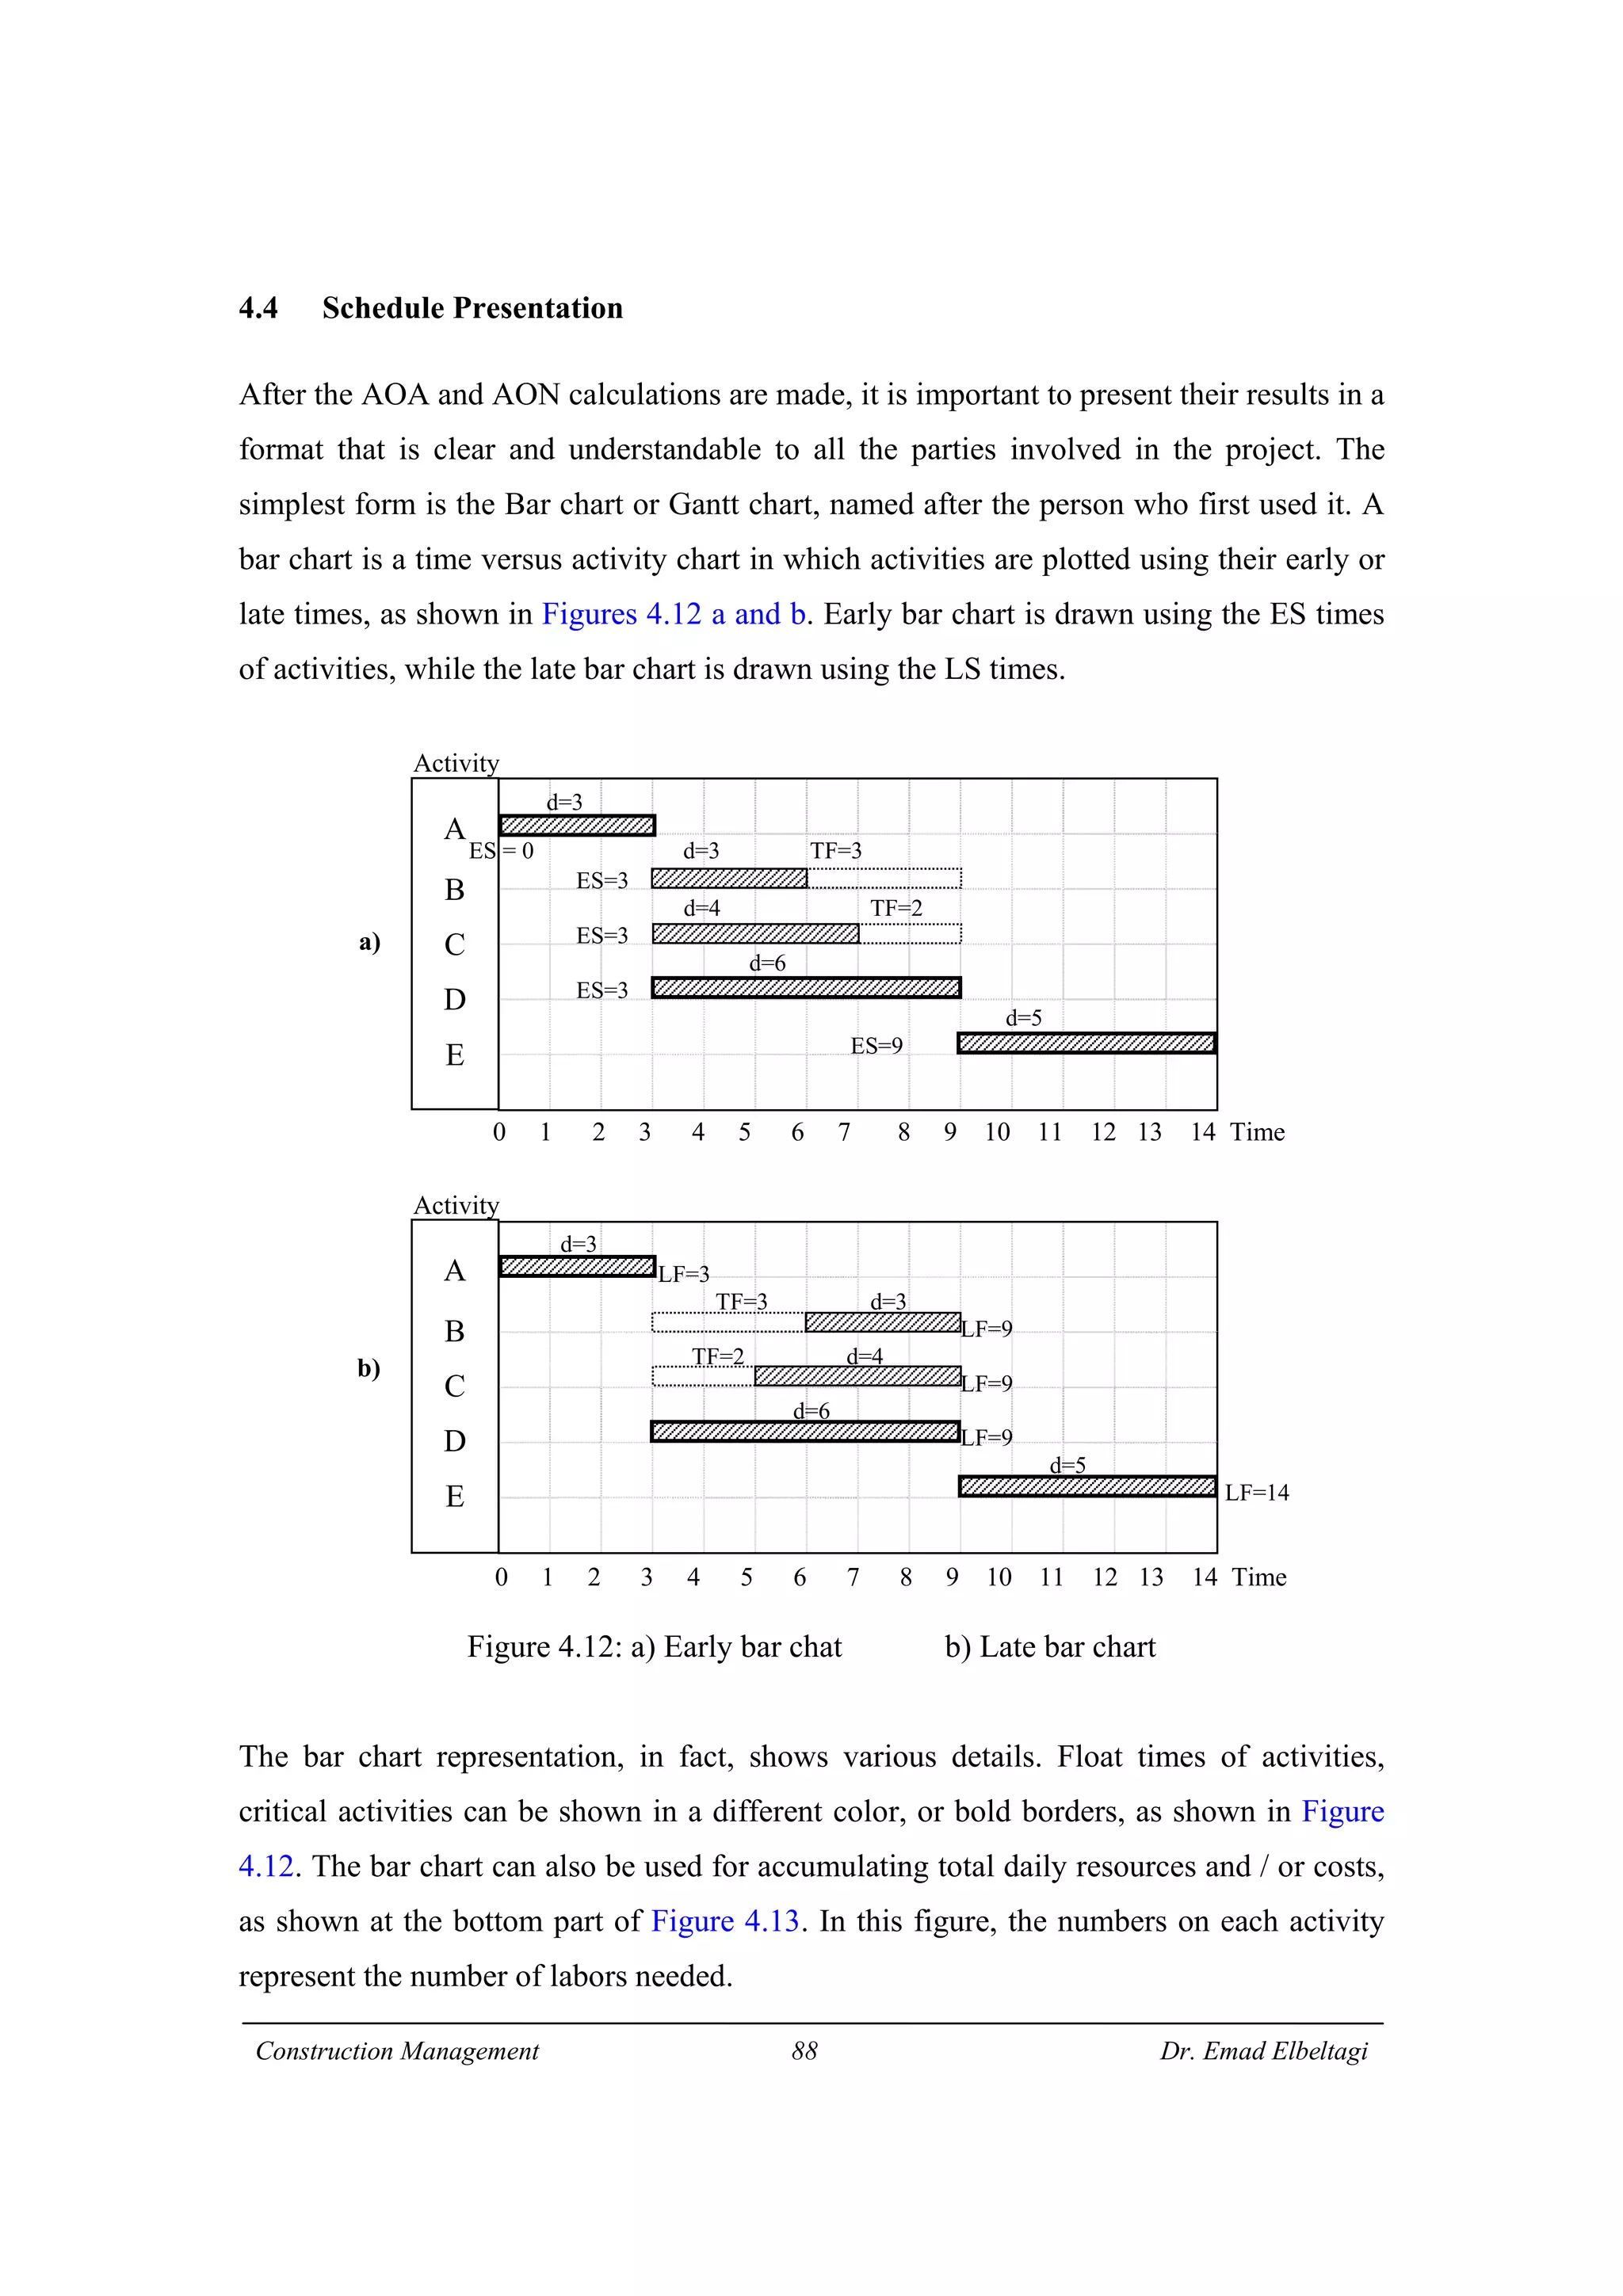
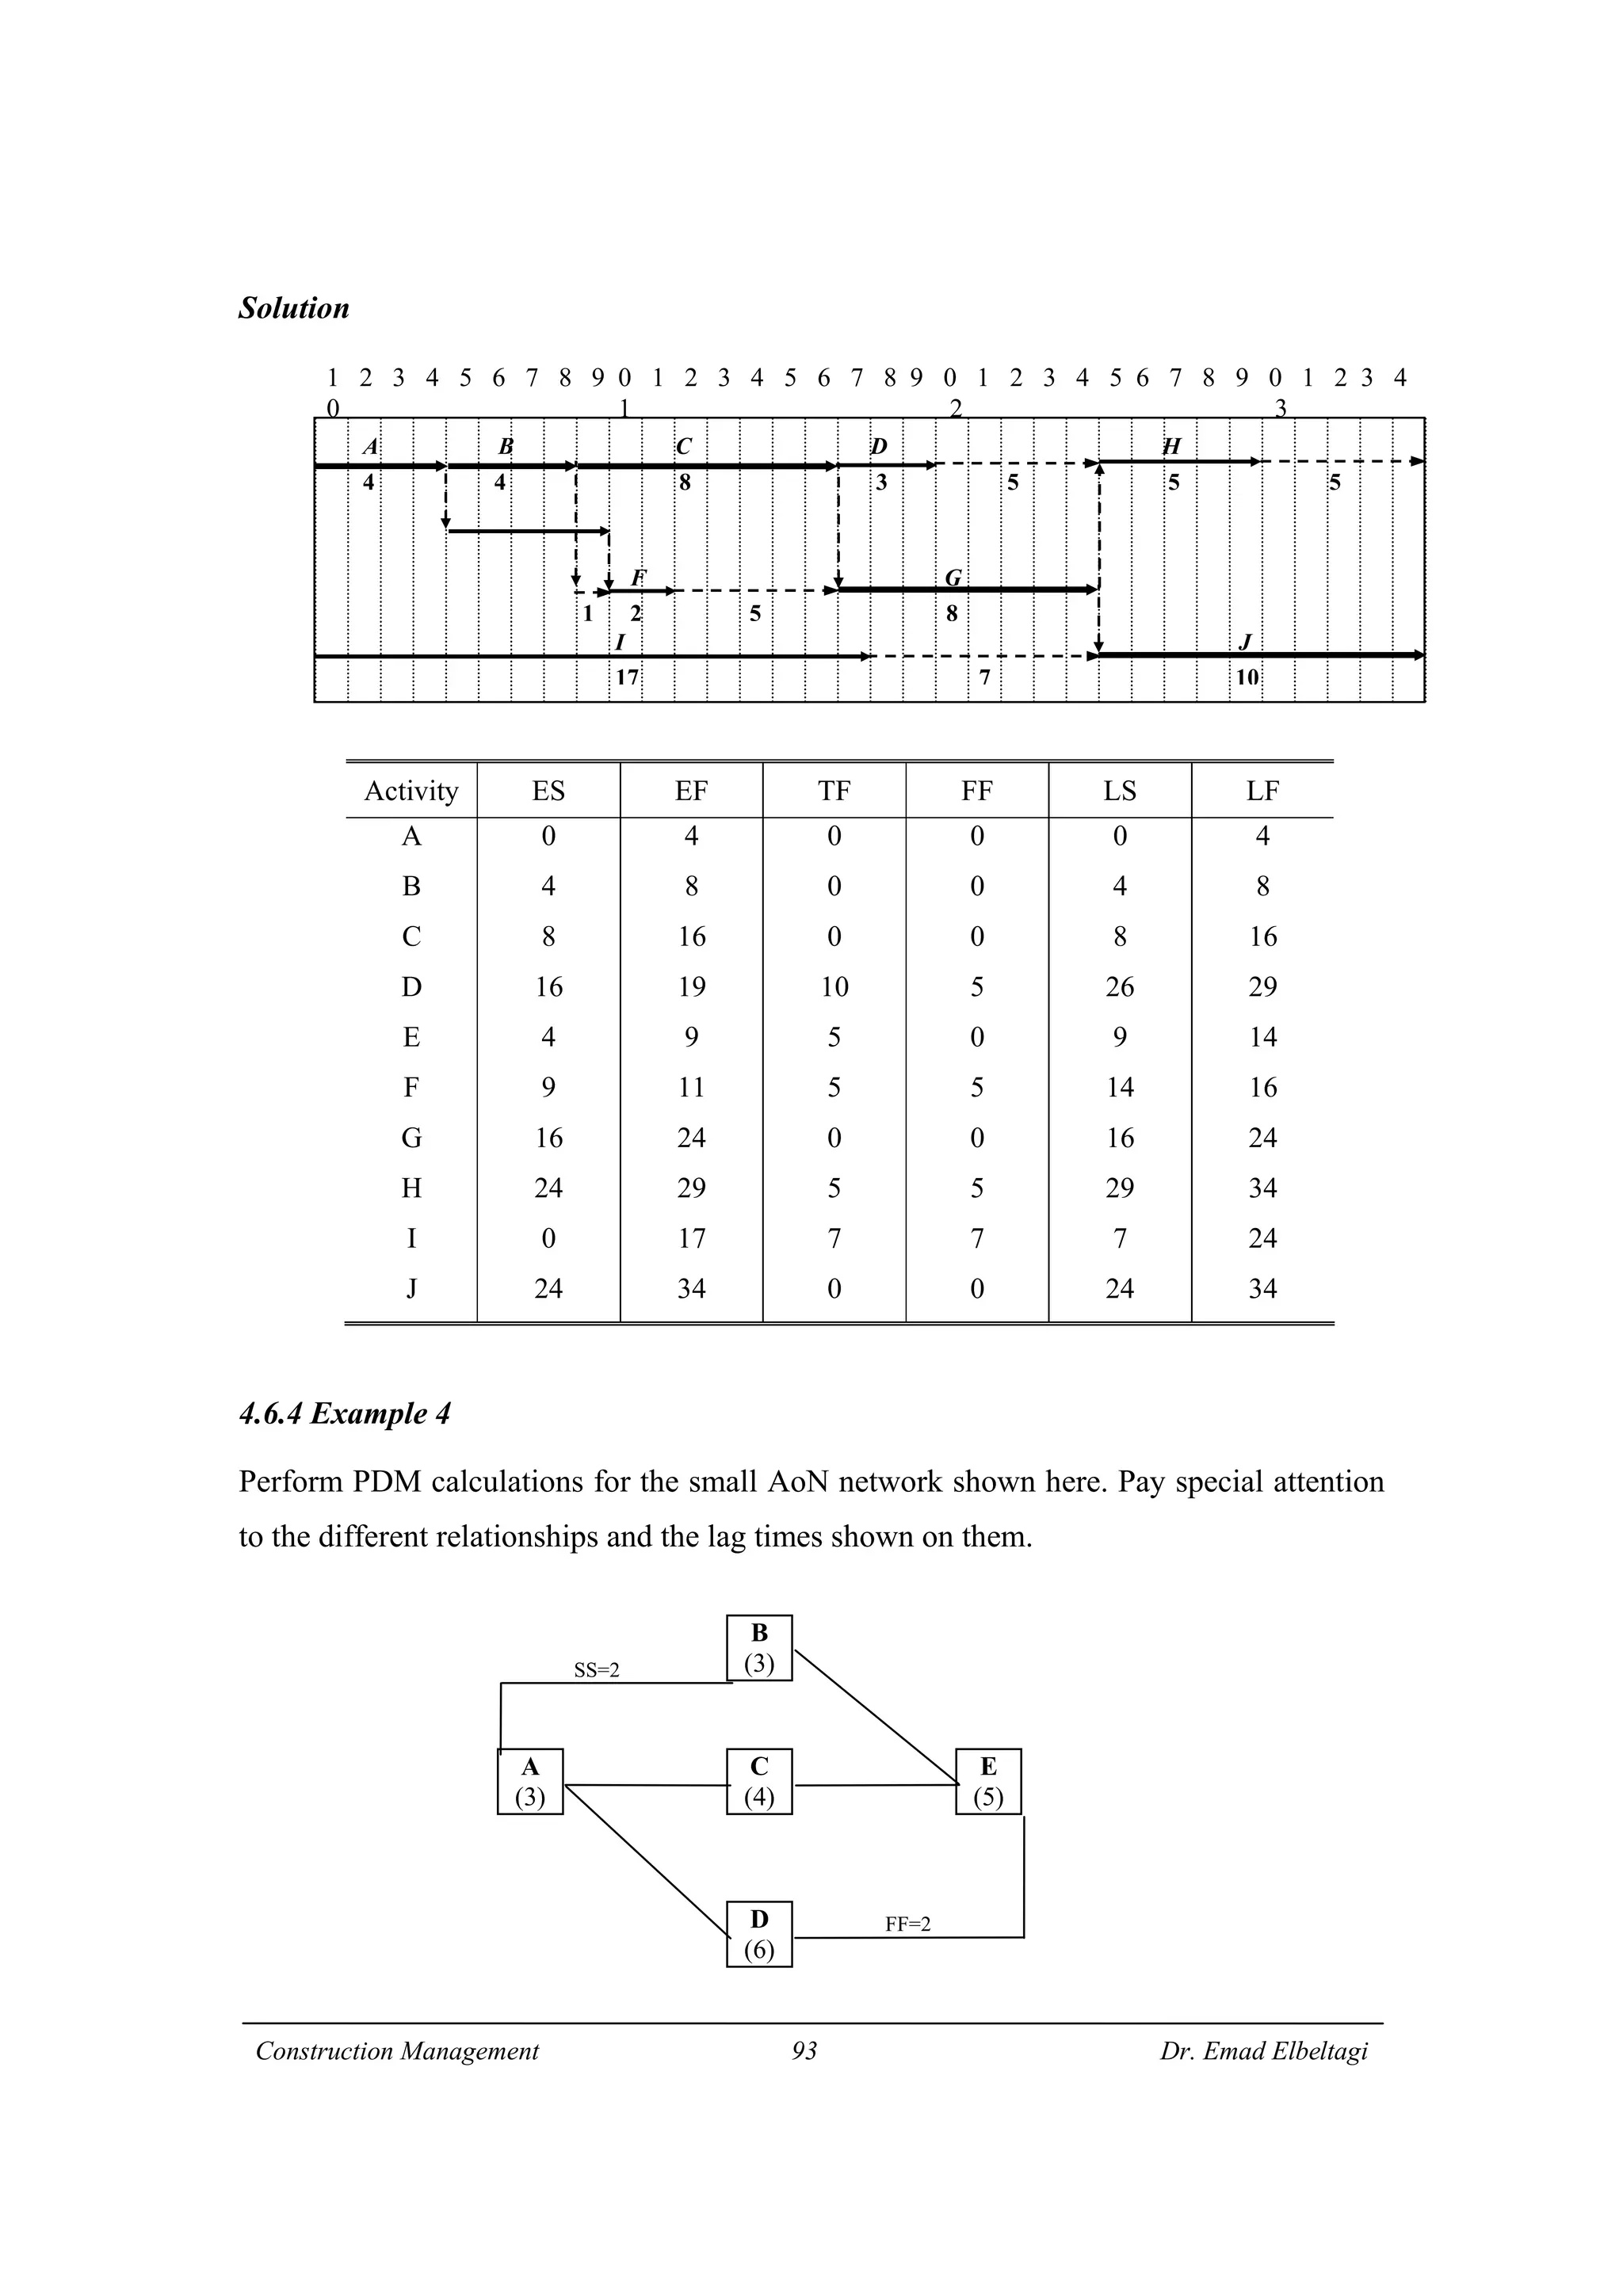
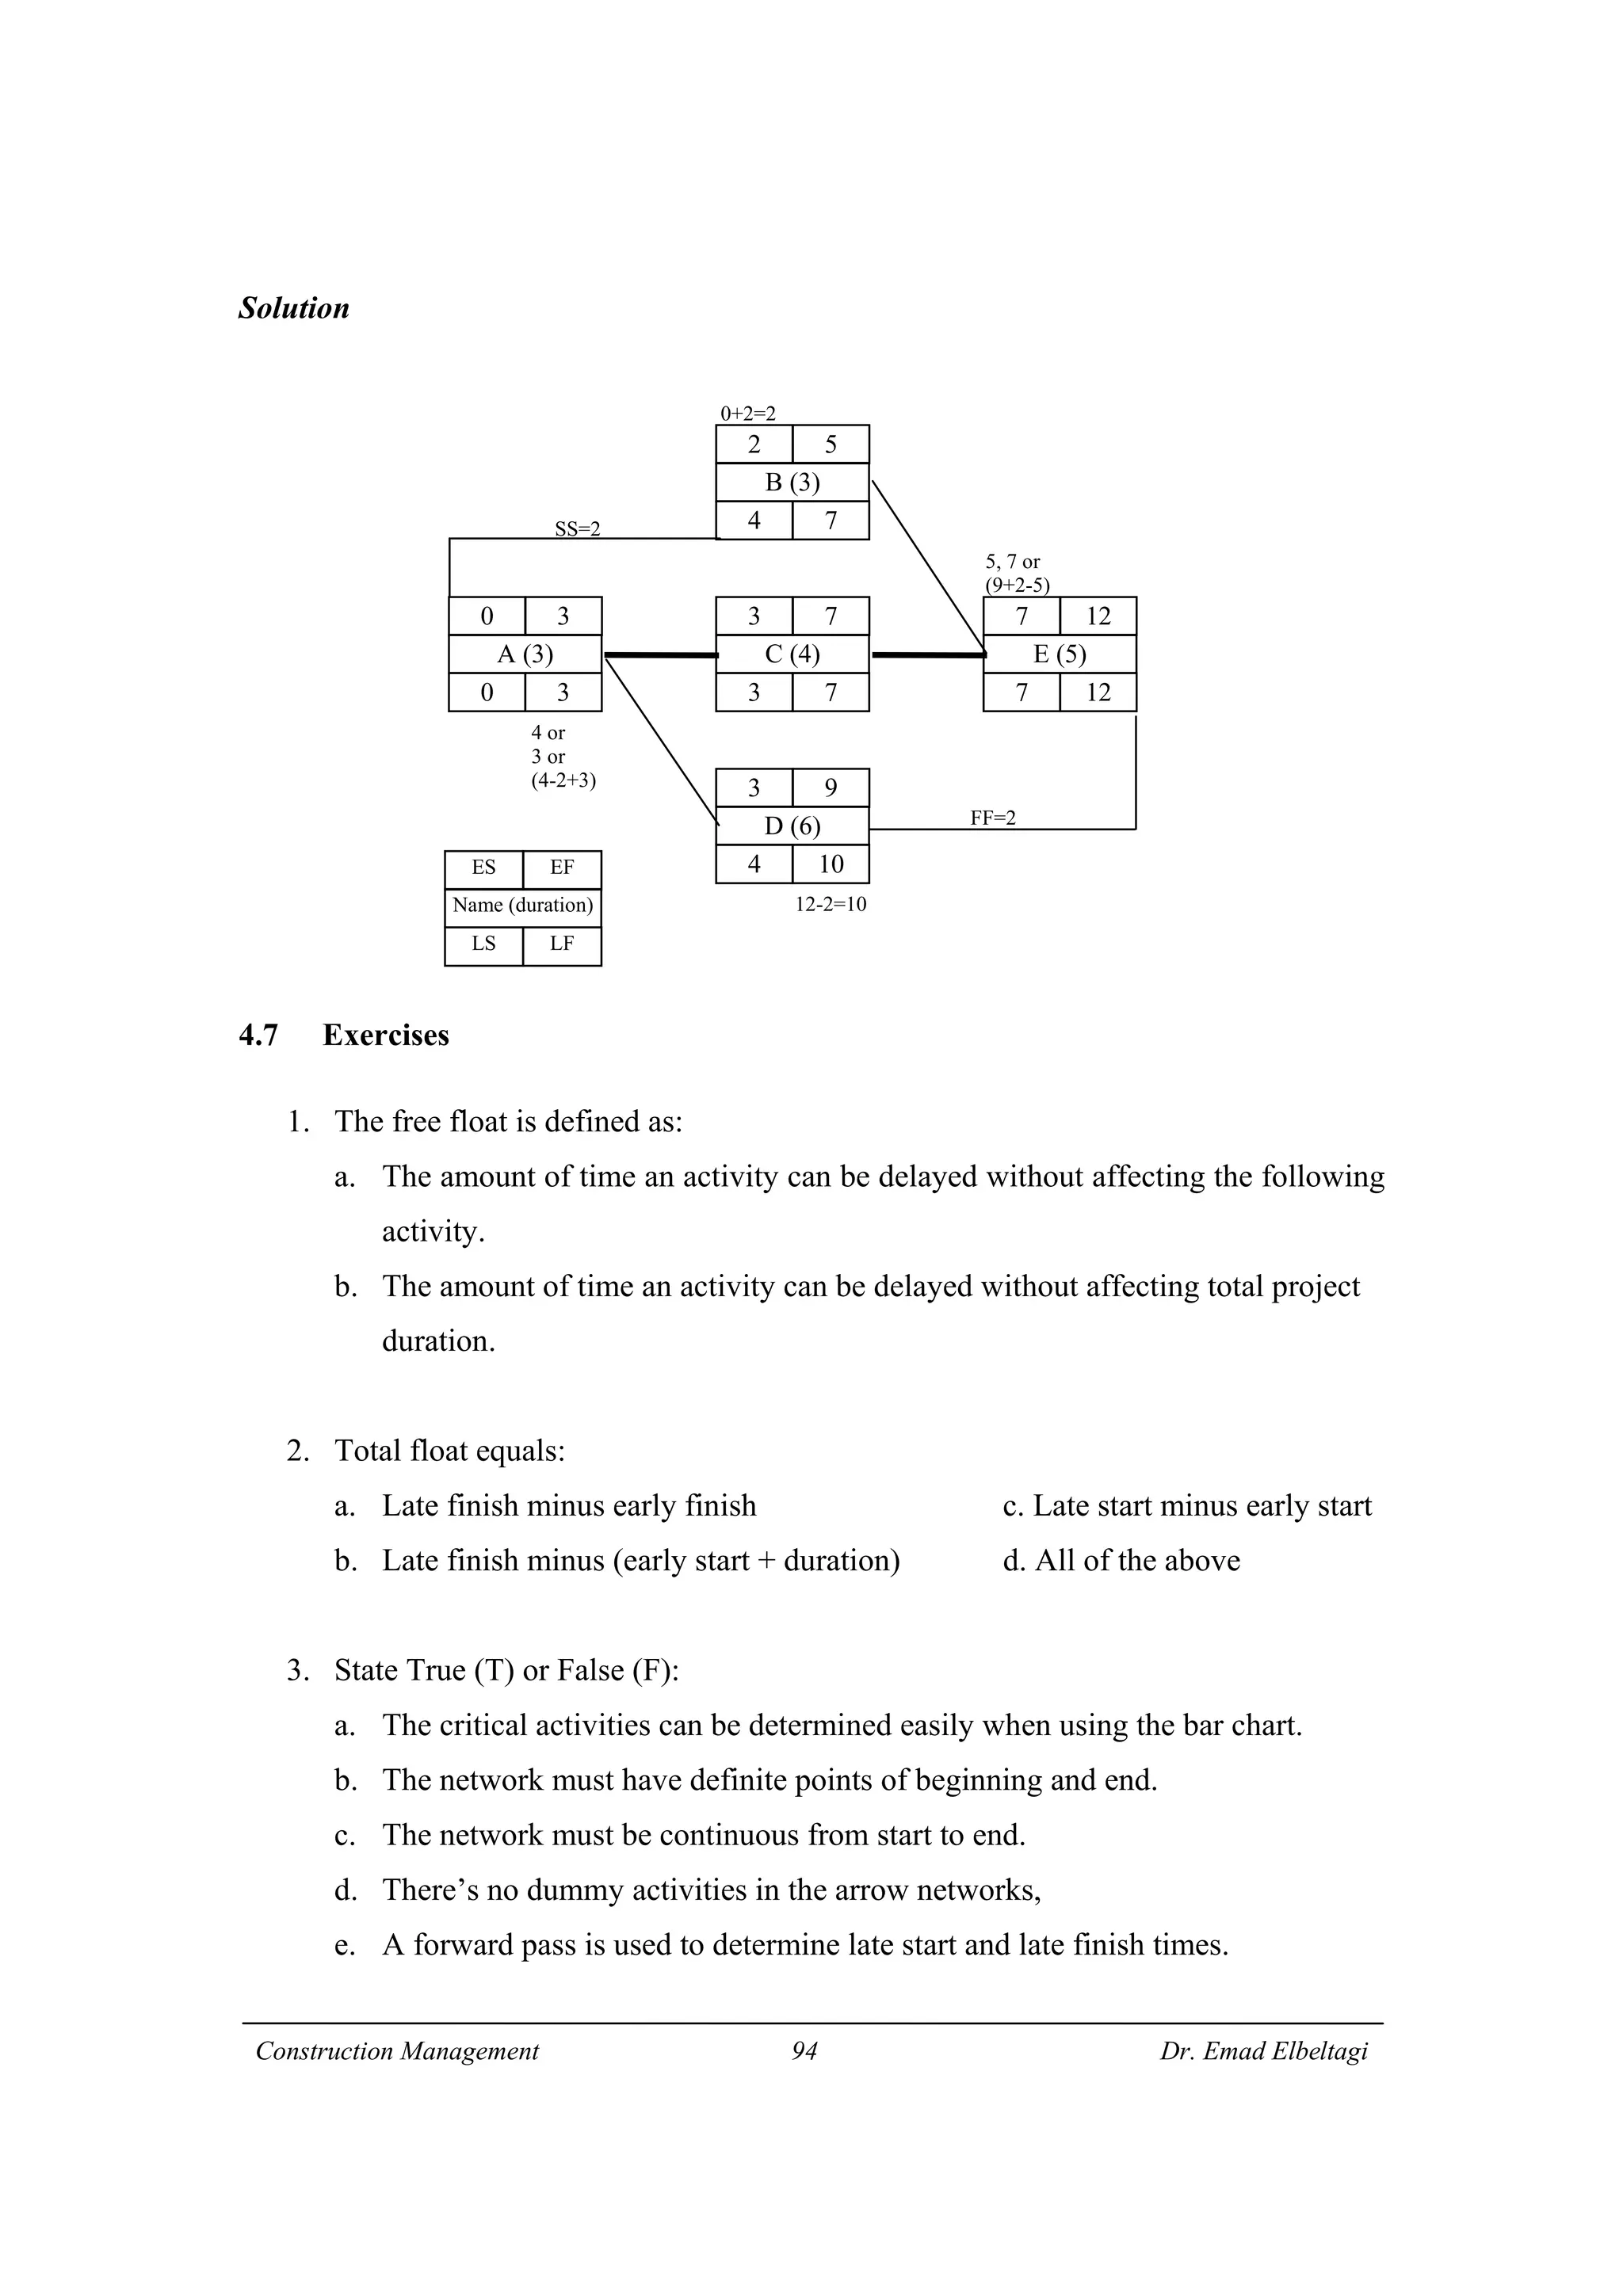
1) The document discusses project scheduling and the critical path method (CPM) for determining the minimum time needed to complete a project.
2) CPM involves calculating early and late start/finish times for activities through forward and backward passes through the network. It also identifies critical activities with zero float that must finish on schedule.
3) The example project network is analyzed using CPM. Forward processing determines early start times, while backward processing finds late finish times. Floats are then calculated to identify which activities have no scheduling flexibility.
Asce 7 10 presentation on seismic bracing for mep systemsmichaeljmack
This document discusses seismic design requirements for mechanical, electrical, and plumbing (MEP) non-structural components according to ASCE 7-10. It provides examples of damage from past earthquakes where non-structural elements were not braced properly. Bracing is required by code to protect life safety and ensure functionality of critical systems. The document outlines specific bracing requirements for various MEP systems based on component weight and location. It also discusses exceptions, inspection requirements, and International Seismic Application Technology's approach to providing engineered seismic bracing solutions.
This document contains instructions and questions for an exercise on project management concepts including critical path method (CPM) and program evaluation and review technique (PERT). It asks students to perform calculations for various networks and project schedules, including determining float, drawing time-scaled diagrams, and identifying critical activities. It also provides a multi-step case study of a gas station construction project and asks students to model it using CPM.
The document discusses different types of contracts used in construction projects, with a focus on EPC and turnkey contracts. It defines EPC as engineering, procurement, and construction, where the contractor is responsible for these activities. Turnkey contracts are similar to EPC but encompass all work required by the client. EPC contracts can be for a full project or parts of a project. Key differences between EPC and other contract types like item rate and percentage rate contracts are discussed. Important considerations and clauses for EPC contracts like securities, timelines, determinants of contract, secured advances, and escalation clauses are also outlined.
Limiting the Offshore EPC Contractor's Risks and LiabilitiesPrimila Edward
The document summarizes key points from a presentation on limiting offshore contractor risk and liabilities under EPC contracts. Common risks contractors face include completing projects on time, on budget, and to specifications. EPC contracts typically allocate most risks to contractors through fixed completion dates, penalties for delays/non-performance, and caps on liability. However, some risks may be better shared between owners and contractors to encourage cooperation over disputes.
This document provides background information and theory on the design of structural steel connections. It is the first edition of Handbook 1: Design of Structural Steel Connections, published in 2007 by the Australian Steel Institute. The handbook was authored by T.J. Hogan and edited by S.A. Munter. It covers topics such as bolted and welded connections, connection components, supported members, and minimum design actions. The intended purpose is to provide guidance on structural steel connection design based on the Australian Standard AS 4100.
Civil engineering - strength of materialsEkeedaPvtLtd
Civil Engineering is an oldest stream in engineering course. It is a professional discipline that deals with the construction and maintenance of both natural and artificial establishments. This is a professional stream with a lot of popularity. It has been broken into various other sub-streams providing specific knowledge about the topics. When it comes to a career after Civil engineering there are so many opportunities out there that civil engineers can opt for.
LRFD Design Example -Steel Girder Bridge (US Unit).pdfSaminSiraj1
This document presents a design example for a steel girder bridge superstructure according to AASHTO LRFD specifications. It includes design computations for elements like the concrete deck, steel girders, bolted field splice, shear connectors, and substructure elements. Flowcharts show the design process and step-by-step calculations are provided with commentary. The goal is to aid bridge engineers in implementing LRFD specifications. Sample input/output files from the analysis software are also included.
This document discusses types of bolt connections based on arrangement of bolts and plates, mode of load transmission, and nature and location of load. There are two main types of joints subjected to axial loads: lap joints and butt joints. Butt joints are preferable to lap joints because the load is split between members, eliminating eccentricity and bending. Bolt connections can fail due to shear, bearing, or tension failures of bolts or plates. The design strength of bolts is governed by their strength in shear, bearing, or tension with safety factors applied.
Scope changes during the testing and commissioning phase of construction projects are a critical issue that can impact cost and completion time. Unclear scope definitions during the design phase and improper communication between stakeholders often lead to scope changes being requested by employers after construction is complete. While FIDIC contracts recognize the effects of scope changes and enable contractors to claim related costs and time extensions, the standards used to calculate cost impacts are not defined in FIDIC, leading to potential disputes. Proper project planning through clear scoping and use of FIDIC contracts can help protect projects and avoid disputes over scope changes.
Disputes and Claims in Engineering Contracts - 18.07.07.pptNesrElhandasa1
This document discusses engineering contracts, causes of disputes, and remedies. It covers key topics like interpretation of contracts, breach of contract, damages, arbitration, and case studies. Some main points:
- Disputes can arise from gaps in contract interpretation, breach of terms, force majeure events, or claims for work done without a fixed price.
- Breaches by owners include delays in payments, site access, or design approvals. Breaches by contractors include delays, defective work, or unauthorized subcontracting.
- Remedies for breach include damages, specific performance orders, or injunctions. Damages must be proven and cannot be remote or indirect.
- Disputes over delayed completion or
The document discusses the different types of loads that a house must be designed to withstand, including dead loads, live loads, wind loads, seismic loads, and snow loads. Dead loads are the permanent loads from building materials like drywall, tile, and siding. Live loads are temporary loads from occupants and furniture. Wind loads are air pressures that act on the house from wind. Seismic loads are forces from earthquakes. Snow loads are the weight of snow on the roof. Properly designing houses to resist these various loads requires understanding how each load affects the framing of the house.
EXTENSION OF TIME CLAIMS IN OIL AND GAS CONSTRUCTION PROJECTSHossamNegidaPMPRMPPS
This document is dedicated to projects especially in Oil and Gas field wherein, in light of rapid and continuous development of the construction process and under intense competition in order to acquire reasonable profits, they are facing naturally lot of delays and disruptions which lead to exert huge efforts for proving these delays.
1. Tower configuration is determined by factors like insulator length, required clearances, location of ground wires, and mid-span clearance.
2. Tower height is calculated based on minimum ground clearance, maximum conductor sag, vertical spacing between conductors, and clearance between ground wire and top conductor.
3. Other factors that influence tower design include wind pressure, temperature variations, and different types of loads on the tower from reliability, security, and safety requirements.
This document provides instructions for measuring quantities of materials and works for construction estimating. It discusses the units of measurement for different construction items like earthwork, concrete, masonry, woodwork, and finishing works. It explains the long wall short wall method and centerline method for calculating quantities of items like earthwork and masonry. Tolerances for linear, area and cubic measurements are also specified. The document aims to standardize measurement practices for preparing accurate construction estimates.
This document provides an introduction and scope for Section II of the Indian Road Congress's Standard Specifications and Code of Practice for Road Bridges. It discusses the classification of bridges according to their designed loadings, including IRC Class 70R, AA, A, B, and Special Vehicle loadings. It describes the intended uses and design checks required for each bridge class. The introduction also provides background on the development and revisions of Section II since its initial publication in 1958.
Steel Design to AS4100 1998 (+A1,2016) Webinar - ClearCalcsClearCalcs
Understanding the complete steel design process and
previewing possible upcoming changes.
Covers scope and analysis of steel beam design, flexural capacity, shear capacity, bearing capacity, load interactions, and deflection.
A video recording of the webinar is available on YouTube:
https://www.youtube.com/watch?v=x2Oun8_zHY0
This document discusses various approaches to analyzing delays in construction projects, including As-Planned vs As-Built, Impacted As-Planned, Collapsed As-Built, and Time Impact Analysis using snapshot and window approaches. It defines key delay analysis terms and provides examples of inserting delays into schedules and calculating extension of time and costs using different methods. The preferred approach discussed is window-based Time Impact Analysis, which divides a project into time windows and compares schedules to determine delay impacts at different points in time. Concurrent delays that cannot be separated are generally only entitled to extension of time but not additional costs.
IRJET- Design of Railway Foot Over Bridge (Shelu)IRJET Journal
This document describes the design of a steel foot over bridge at Shelu railway station in India. The existing foot over bridge is made of reinforced concrete and located at the far end of the platform, making it inconvenient for users. The objectives of the new design are to create a light-weight yet durable and economical bridge structure that can be safely accessed from both sides of the platform using steel materials. The design will be done manually according to Indian codes and analyzed using ANSYS software. The key components of the bridge that are described include the truss, slab, girders and staircase. Design loads, material properties, and dimensions of the bridge are also provided.
This document provides an overview of earned value management (EVM) with the following key points:
1. EVM is a project control process that facilitates integrating project scope, time, and cost objectives by comparing the planned value, actual cost, and earned value.
2. EVM improves project predictability, provides early warnings of problems, and objectively assesses value delivered versus costs through structured planning and performance measurement.
3. EVM uses variances, performance indices, and forecasting to monitor project performance and status in terms of schedule, budget, and estimates to completion. Positive variances and indices above 1 indicate favorable performance while negative or below 1 need corrective action.
On 23 May 2012, McLachlan Lister's Anamaria Popescu made a presentation on "Extensions of Time - Avoiding the Traps or Taking Advantage of Them" in conjunction with well-known Australian law firm Holding Redlich
This document introduces different parts of a truss including joints, members, and reactions. It then provides the essential formulas for determining the stability and determinacy of trusses based on the number of joints (j), members (b), and reactive components (r). The remainder of the document works through examples of truss structures, calculating values for b, r, and j, and determining in each case whether the truss is stable/unstable and determinate/indeterminate based on the formulas.
This document discusses screw jacks and includes:
1) An overview of screw jacks and how they are used to raise heavy loads through small heights using square threads for power transmission.
2) Questions about the type of thread used for screw jacks, their uses, paper sizes, title blocks, and drawing sheet layouts.
3) An assembly drawing assignment to create sectional and top views of a screw jack with a parts list and bill of materials.
A case study of Delay Analysis of construction project: Al Kut Olympic Stadiu...Gaurav Verma
This document summarizes a case study on delay analysis for the construction of the Al Kut Olympic Stadium project in Iraq. The study identified major causes of delay including changes to the foundation design and lack of drainage infrastructure. It analyzed project schedules and resources using Microsoft Project software. The results showed additional time delays of 265 days and cost overruns. Problems included design changes, lack of coordination between project parties, and canceled activities. The summary concludes effective planning and maintaining consistent project teams can help minimize delays on similar projects.
The document outlines the general provisions of an FIDIC Conditions of Contract for Construction contract. It defines key terms, establishes that the contract will be governed by the law of the country stated in the Contract Data, and addresses communications between parties, priority of documents, assignment, care and supply of documents, confidential details, compliance with laws, and inspections. It also describes the roles and responsibilities of the Employer and Engineer in overseeing the project.
1) The document discusses the calculation of bending and shear stresses in a beam with a rectangular cross-section.
2) Shear stress is derived to be proportional to the first moment (Q) of the cross-sectional area above the level of interest.
3) For a rectangular cross-section, the maximum shear stress occurs at the neutral axis and is 50% larger than the average shear stress.
This document provides guidelines for creating a report and estimate for the construction of a residential building. It outlines the necessary structure and content for the report, including an introduction with relevant information, detailed sections on the building design and specifications for various components, and signatures from engineers. The report should contain proper timing and accurate information to aid in cost evaluation and assign responsibilities for the project. Key elements that must be included are layout, foundation, brickwork, roofing, flooring, plastering, doors and windows, structural loads, electrification, sanitation provisions, and completion timeframe. Relevant documents such as designs, calculations, and material statements should be attached.
Stucture Design-I(Bending moment and Shear force)Simran Vats
* Given: Maximum bending moment the beam can resist = 22 kNm
* Span of beam = 5 + 5 + 4 = 14 m
* Point loads = 1 + 2 + 1 = 4 kN
* To find: Maximum uniform load (w) the beam can carry
* Bending moment at center due to point loads
= (1 × 2.5) + (2 × 2.5) + (1 × 1.5) = 7.5 kNm
* Bending moment at center due to uniform load
= wl^2/8 = w × (14)^2/8 = w × 98 kNm
* Total bending moment should not exceed 22 kNm
7.5 + w
This document discusses project scheduling and the critical path method (CPM) of scheduling. It provides an example of a 5 activity project network to demonstrate how to calculate:
1) Early and late start/finish times for each activity by performing forward and backward passes through the network
2) Total float for each activity based on the difference between early and late times
3) The critical path, which is the longest path of minimum duration activities that determines the project completion time.
This document discusses project management using the network model known as PERT/CPM. It uses the example of planning seminars to illustrate key concepts. The document outlines the two key pieces of information needed for project planning and control: 1) the length of time to complete each task and 2) which tasks must be completed before another can begin. It presents this information for the seminar planning project in a table. The document then explains how to represent the information as a network diagram with activities as nodes and sequencing as arrows. It defines the critical path as the longest path of connected activities, which determines the shortest time to complete the entire project. The document outlines how to calculate early start/finish times and late start/finish times
The Project Management Plan (PMP) is a formal document that defines how a project will be executed, monitored, controlled and closed. It describes the actions needed to plan the project and ensures stakeholders share an understanding of the project. The PMP is not a project schedule, which lists planned task dates to meet milestones. Developing a project schedule involves defining activities, sequencing them, and estimating durations. Critical path schedules help identify critical activities, calculate minimum project time, and determine activity start/finish dates to maintain the schedule.
The critical path method (CPM) is a step-by-step project management technique for process planning that defines critical and non-critical tasks with the goal of preventing time-frame problems and process bottlenecks. The CPM is ideally suited to projects consisting of numerous activities that interact in a complex manner.
This document provides an overview of network analysis techniques like CPM and PERT. It begins with basic concepts of networks including nodes, branches, events and activities. It then discusses rules for constructing networks and uses examples to illustrate key points. The document explains the critical path method for determining the longest path and critical activities in a network. It also covers concepts like dummy activities. Finally, it provides a high-level introduction to the Programme Evaluation and Review Technique (PERT) which incorporates uncertainties into project scheduling.
This document discusses developing a project network plan. It explains that a project network shows project activities and their logical sequence and interdependencies. It is used for planning, scheduling, and monitoring project progress. The document outlines how to construct a project network by first identifying work packages from the work breakdown structure and then defining those work packages as activities with dependencies. It describes key network terminology like activities, paths, and critical path. It also explains how to perform forward and backward passes to calculate earliest and latest start/finish times and determine which activities have slack or are on the critical path.
The document discusses scheduling a housing construction project using Critical Path Method/Program Evaluation and Review Technique (CPM/PERT). It contains an activity list and precedence relationships for the project. It then summarizes how CPM/PERT can be used to schedule the project by determining the critical path, earliest and latest start/finish times for each activity, and identifying slack. CPM/PERT provides a way to visually display the project, calculate the total time needed, and determine which activities are on the critical path and how delays will impact the schedule.
The Critical Path Method (CPM) is a technique for scheduling a set of project activities. It identifies the longest continuous chain of activities from start to finish required to complete the project on time. This longest chain is called the critical path. CPM calculates the earliest and latest times each activity can start and finish without making the project longer. Activities on the critical path have no scheduling flexibility, while other activities have "float" or slack time that can be used for scheduling flexibility. CPM is useful for determining the minimum project duration and identifying which activities must be carefully managed and monitored to avoid project delays.
This document discusses network analysis techniques like CPM and PERT that are used for project planning, management, and control. CPM uses deterministic activity times with a single estimate while PERT uses probabilistic times with optimistic, most likely, and pessimistic estimates. Both techniques involve representing activities as nodes and arrows on a network diagram to show precedence relationships. This allows calculating earliest and latest start/finish times to identify the critical path and determine project duration. Crashing the critical path can potentially reduce the project duration but at increased costs.
The Project Management Plan (PMP) is a formal document that defines how a project will be executed, monitored, controlled and closed. It describes the actions needed to plan, integrate and coordinate project activities. The PMP is progressively elaborated throughout the project.
The scope management plan describes how the project scope will be defined, developed, monitored, controlled and verified. It helps reduce the risk of scope creep.
Developing the project schedule involves defining activities, sequencing them, and estimating activity durations. The critical path method (CPM) identifies which activities must be completed on time for on-time project completion and which activities have float or slack.
The document discusses project scheduling techniques like the Critical Path Method (CPM) and Program Evaluation and Review Technique (PERT). It explains how a network diagram shows the logical dependencies and sequence of tasks in a project. Calculating earliest and latest start/finish times helps identify the critical path and float for activities. PERT is useful for projects with uncertain durations, using 3 time estimates. The critical path determines the minimum project duration, and monitoring it helps complete the project on schedule.
The Project Management Plan (PMP) is a formal document that defines how a project will be executed, monitored, controlled and closed. It describes the actions needed to plan, integrate and coordinate project activities. The PMP is progressively elaborated throughout the project and is a communication tool for stakeholders. It is not a project schedule, which lists planned task dates.
The scope management plan describes how the project scope will be defined, developed, monitored, controlled and verified. It helps reduce scope creep.
Developing a project schedule involves defining activities, sequencing them, and estimating durations. The critical path method (CPM) identifies which activities must be completed on time for on-time project finish. It shows float and
Project management techniques allow projects to be planned, monitored, and controlled effectively. The document discusses key project management steps including:
1. Representing the project as a network diagram with nodes and branches to show task dependencies and durations.
2. Using the Critical Path Method (CPM) to calculate earliest and latest start/finish times to determine the critical path and project completion time.
3. Conducting sensitivity analysis using the Program Evaluation and Review Technique (PERT) which considers probabilistic activity times to estimate mean times and variances for predicting project completion probabilities.
This document discusses various concepts related to software project management including project scheduling, critical path method (CPM), precedence diagram method (PDM), critical path, and Gantt charts. It defines key terms like activities, earliest start and finish dates, forward and backward pass, leads and lags. CPM is used to identify the critical path of a project which is the longest sequence of dependent tasks. PDM visually depicts tasks and their dependencies with arrows. Gantt charts show activities along a time scale to track project progress.
The document discusses network analysis and scheduling methods like PERT/CPM. It provides background on how these methods were developed in the 1950s to schedule large complex projects involving many interdependent tasks. The key aspects covered include:
- Representing project schedules as networks with nodes and arcs to show task dependencies and durations
- The activity-on-arc and activity-on-node conventions for building the network
- Using the forward and backward pass methods to calculate earliest and latest start/finish times and identify the critical path
- Defining slack/float and determining which tasks have zero slack and are critical to completing the project on schedule
The document includes an example project network diagram and calculations to illustrate how P
PERT (Program (or Project) Evaluation and Review Technique) is a model for project management designed to analyze and represent the tasks involved in completing a given project. It was developed in the 1950s to schedule large, complex US government projects. PERT uses network diagrams and calculations to determine the critical path of tasks, expected task durations, and slack time to optimize schedules and identify risks. Key aspects of PERT include defining tasks as events with durations, determining early and late start/finish times, identifying the critical path, and calculating float to determine which tasks have scheduling flexibility.
Critical Path Method (CPM) was developed in late 1950s and is used to identify task that are necessary for completion of project on time without delay.
Critical Path Method (CPM) and Program Evaluation and Review Technique (PERT) are network analysis techniques used for project scheduling. CPM is deterministic and used for projects with predictable time estimates, while PERT is probabilistic and used for complex projects with uncertain time estimates. The key steps for both techniques include identifying activities, constructing a network diagram, estimating activity times, and determining the critical path which has zero slack time. PERT additionally calculates variability and probability of completion using a normal distribution curve based on the mean and standard deviation of activity times.
The document describes an experimental study on shear-flexural behavior of reinforced concrete beams strengthened with near surface mounted basalt fiber reinforced polymer bars. Five simply supported beams were tested including one control beam and four beams strengthened with different configurations of fully and partially bonded NSM BFRP bars with and without U-stirrups. The objectives were to study the flexural behavior and investigate the effects of FRP area, bonding conditions, and inclusion of U-stirrups. Material properties of concrete, steel, and BFRP were reported. Details of beam fabrication and strengthening techniques were provided.
1. Resource leveling involves analyzing resource usage and adjusting non-critical activities to reduce overallocation of resources.
2. The document describes calculating an Improvement Factor (IF) for non-critical activities to determine which activities can be moved to reduce resource usage.
3. The example applies the IF calculation to various activities in a project network to level resources, moving Activity G first to reduce the resource usage in period 5 from 9 to 5.
This document describes Program Evaluation and Review Technique (PERT) and its use in planning and scheduling a project. It provides activity details like predecessor tasks, optimistic, most probable and pessimistic durations. It then shows the steps to 1) draw the activity on arrow (AOA) network, 2) calculate the total project time using PERT, 3) determine the probability the project finishes within 50 and 44 weeks, and 4) find the project completion time with 80% probability.
This document provides information to draw a Program Evaluation and Review Technique (PERT) network and analyze a project. It includes activity information like optimistic, most likely, and pessimistic durations to calculate the expected duration, variance, and probability of completing within given timeframes, like having a 90% chance of finishing within the total time. It asks to: 1) Draw the PERT network, 2) Calculate the total project time, 3) Find the probability of completing within 25 and 20 weeks, and 4) Find the total time with a 90% probability.
1. Draw the line of balance chart for the 65 unit construction project with activities R, W, X, Y, Z.
2. At the 46th week, activities R, Y and X have finished. Activity W will finish at the 49th unit. Activity Z is not yet finished.
3. If activity Z finishes at the 60th week in 39 units, recalculate the rate of Z. The new rate of 6.5 units/week is less than the old rate of 4 units/week, so the recommendation would be to expedite activity Z.
This document provides information to draw an Activity-On-Node (AON) network and Gantt chart for a construction project. It lists 9 activities with their successors, durations, and constraints. The tasks are to: 1) Draw the AON and AOA networks, 2) Determine the critical path and total time, 3) Calculate the early start, early finish, late start, late finish, total float, and free float for each activity, and 4) Draw a Gantt chart showing only non-critical activities.
This document discusses earned value analysis, a project management technique for measuring project performance and progress. It defines key terms like actual cost of work performed, budgeted cost of work performed, and budgeted cost of work scheduled. It also explains how to calculate variances to determine if a project is under or over budget and ahead of or behind schedule. The example shows earned value calculations for a construction project and determines it is behind schedule and over budget based on costs and work completed after 15 months out of a planned 20 month duration.
The project has 8 activities with normal and crash durations and costs provided. The contract time is 20 days with a penalty of 300 LE/day for delays.
To meet the contract time, activities XE, YC, and ZA need to be crashed. Crashed costs are 1140 LE, 1470 LE, and 770 LE to finish in 23, 22, and 21 days respectively. The optimal plan is to crash for 1140 LE to finish in 20 days as required.
After a site update on day 5, the project is expected to finish in 22 days. Activities Y and Z are already complete. Crashing activity D for 1000 LE and activity B for 700 LE, for a
The document presents a cash flow analysis for a construction project with 10 activities over 10 periods. It includes tables showing activity costs by day, total costs by period, cash outflows by period from costs, and cash inflows by period from payments. It then calculates payments for each period based on costs, retention rate, profit margin, and down payment. Graphs of cumulative cash outflows and inflows are presented, showing the maximum negative cash flow and indicating a final profit of 4410 LE.
The document discusses the need for construction project management due to the unique challenges of construction projects including their one-of-a-kind nature, involvement of many conflicting parties, and constraints of time, money, and quality. It states that optimal utilization of project resources is the goal of project management. It then provides definitions and characteristics of a project, describes the project life cycle and links between process groups in a phase. Finally, it discusses topics in project management including scope, time, quality, cost, time management, work breakdown structure, project activities, project networks, and activity relationships.
01 introduction and layout of steel (1)Ahmed Gamal
The document discusses the benefits of exercise for both physical and mental health. Regular exercise can help reduce the risk of diseases like heart disease and diabetes, and it can also improve mood and reduce stress and anxiety levels. Exercising for at least 30 minutes per day several times a week is recommended to gain these health benefits.
- The document discusses a company's quarterly financial results.
- Revenue increased significantly year-over-year due to strong performance across business segments.
- Expenses also rose but profit margins improved due to cost-cutting initiatives and higher sales.
- The company expects continued revenue growth and further margin expansion in the coming quarters.
This document provides an overview of Fortran 77 programming concepts including input/output statements, format specifiers, and the OPEN statement. Key points covered include:
- READ and WRITE statements are used for formatted and list-directed input/output. FORMAT defines the format for READ/WRITE.
- Common format specifiers include I, F, E for integers, reals, and scientific notation. A is for characters.
- The OPEN statement makes a file available for input/output using READ and WRITE and assigns a unit number for file access.
This document discusses various aspects of Fortran 77 programming including:
1. Variable names consist of letters and digits but are not case sensitive. Common declarations include integer and real variables.
2. Fortran 77 uses a fixed format with strict column rules for statements and labels. Comments can start in column 1.
3. A basic Fortran program structure includes the main program name, declarations, statements, and stop/end lines. Subprograms can also be included.
1) Fatigue is failure under repeated loading due to gradual cracking. The S-N curve relates stress levels to the number of cycles to failure. Factors like mean stress, stress amplitude, stress concentration, and surface finish affect fatigue properties.
2) Miner's cumulative damage theory assumes damage from different stress levels is independent and sums fractions of life used to predict failure. It is commonly used to analyze complex variable loading.
3) Goodman, Soderberg and Gerber rules use the S-N curve and material properties to predict if a part under cyclic loading with a given mean stress and stress amplitude will fail by fatigue. They allow determination of maximum and minimum stresses.
This document discusses different hardness tests including Brinell, Vicker, and Rockwell tests. It defines hardness as the ability of a material's surface to resist deformation under an external load. The document describes the process and key parameters for each test such as the indenter type and geometry, typical loads used, how the hardness number is calculated based on measurements from the indentation, limitations and precautions of each test method. It provides examples of calculations to determine hardness values, indentation sizes, and tensile strength from Brinell and Vicker test data.
The document provides information about static shear testing, including direct shear testing, torsion testing, and calculations related to shear stress, shear strain, shear modulus, and other properties. It includes examples of calculations for shear stress, shear modulus, angle of twist, and other values using data from torsion tests on steel specimens of various dimensions under increasing torque loads. Diagrams are presented showing typical shear stress distributions and failure shapes for ductile and brittle materials in torsion testing.
1. The beam is a cantilever 1.2 m long made of steel tube with an external diameter of 6 cm and internal diameter of 5 cm.
2. A concentrated load W is applied at the free end of the cantilever beam.
3. The maximum bending stress in the beam is not to exceed 1. The value of the load W that satisfies this condition is required.
Designing and Sustaining Large-Scale Value-Centered Agile Ecosystems (powered...Alexey Krivitsky
Is Agile dead? It depends on what you mean by 'Agile'. If you mean that the organizations are not getting the promised benefits because they were focusing too much on the team-level agile "ways of working" instead of systemic global improvements -- then we are in agreement. It is a misunderstanding of Agility that led us down a dead-end. At Org Topologies, we see bright sparks -- the signs of the 'second wave of Agile' as we call it. The emphasis is shifting towards both in-team and inter-team collaboration. Away from false dichotomies. Both: team autonomy and shared broad product ownership are required to sustain true result-oriented organizational agility. Org Topologies is a package offering a visual language plus thinking tools required to communicate org development direction and can be used to help design and then sustain org change aiming at higher organizational archetypes.
Neal Elbaum Shares Top 5 Trends Shaping the Logistics Industry in 2024Neal Elbaum
In the ever-evolving world of logistics, staying ahead of the curve is crucial. Industry expert Neal Elbaum highlights the top five trends shaping the logistics industry in 2024, offering valuable insights into the future of supply chain management.
From Concept to reality : Implementing Lean Managements DMAIC Methodology for...Rokibul Hasan
The Ready-Made Garments (RMG) industry in Bangladesh is a cornerstone of the economy, but increasing costs and stagnant productivity pose significant challenges to profitability. This study explores the implementation of Lean Management in the Sampling Section of RMG factories to enhance productivity. Drawing from a comprehensive literature review, theoretical framework, and action research methodology, the study identifies key areas for improvement and proposes solutions.
Through the DMAIC approach (Define, Measure, Analyze, Improve, Control), the research identifies low productivity as the primary problem in the Sampling Section, with a PPH (Productivity per head) of only 4.0. Using Lean Management techniques such as 5S, Standardized work, PDCA/Kaizen, KANBAN, and Quick Changeover, the study addresses issues such as pre and post Quick Changeover (QCO) time, improper line balancing, and sudden plan changes.
The research employs regression analysis to test hypotheses, revealing a significant correlation between reducing QCO time and increasing productivity. With a regression equation of Y = -0.000501X + 6.72 and an R-squared value of 0.98, the study demonstrates a strong relationship between the independent variables (QCO downtime and improper line balancing downtime) and the dependent variable (productivity per head).
The findings suggest that by implementing Lean Management practices and addressing key productivity inhibitors, RMG factories can achieve substantial improvements in efficiency and profitability. The study provides valuable insights for practitioners, policymakers, and researchers seeking to enhance productivity in the RMG industry and similar manufacturing sectors.
This presentation, "The Morale Killers: 9 Ways Managers Unintentionally Demotivate Employees (and How to Fix It)," is a deep dive into the critical factors that can negatively impact employee morale and engagement. Based on extensive research and real-world experiences, this presentation reveals the nine most common mistakes managers make, often without even realizing it.
The presentation begins by highlighting the alarming statistic that 70% of employees report feeling disengaged at work, underscoring the urgency of addressing this issue. It then delves into each of the nine "morale killers," providing clear explanations and illustrative examples.
1. Ignoring Achievements: The presentation emphasizes the importance of recognizing and rewarding employees' efforts, tailored to their individual preferences.
2. Bad Hiring/Promotions & Broken Promises: It reveals the detrimental effects of poor hiring and promotion decisions, along with the erosion of trust that results from broken promises.
3. Treating Everyone Equally & Tolerating Poor Performance: This section stresses the need for fair treatment while acknowledging that employees have different needs. It also emphasizes the importance of addressing poor performance promptly.
4. Stifling Growth & Lack of Interest: The presentation highlights the importance of providing opportunities for learning and growth, as well as showing genuine care for employees' well-being.
5. Unclear Communication & Micromanaging: It exposes the frustration and resentment caused by vague expectations and excessive control, advocating for clear communication and employee empowerment.
The presentation then shifts its focus to the power of recognition and empowerment, highlighting how a culture of appreciation can fuel engagement and motivation. It provides actionable takeaways for managers, emphasizing the need to stop demotivating behaviors and start actively fostering a positive workplace culture.
The presentation concludes with a strong call to action, encouraging viewers to explore the accompanying blog post, "9 Proven Ways to Crush Employee Morale (and How to Avoid Them)," for a more in-depth analysis and practical solutions.
A comprehensive-study-of-biparjoy-cyclone-disaster-management-in-gujarat-a-ca...Samirsinh Parmar
Disaster management;
Cyclone Disaster Management;;
Biparjoy Cyclone Case Study;
Meteorological Observations;
Best practices in Disaster Management;
Synchronization of Agencies;
GSDMA in Cyclone disaster Management;
History of Cyclone in Arabian ocean;
Intensity of Cyclone in Gujarat;
Cyclone preparedness;
Miscellaneous observations - Biparjoy cyclone;
Role of social Media in Disaster Management;
Unique features of Biparjoy cyclone;
Role of IMD in Biparjoy Prediction;
Lessons Learned; Disaster Preparedness; published paper;
Case study; for disaster management agencies; for guideline to manage cyclone disaster; cyclone management; cyclone risks; rescue and rehabilitation for cyclone; timely evacuation during cyclone; port closure; tourism closure etc.
Many companies have perceived CRM that accompanied by numerous
uncoordinated initiatives as a technological solution for problems in
individual areas. However, CRM should be considered as a strategy when
a company decides to implement it due to its humanitarian, technological
and process-related effects (Mendoza et al., 2007, p. 913). CRM is
evolving today as it should be seen as a strategy for maintaining a longterm relationship with customers.
A CRM business strategy includes the internet with the marketing,
sales, operations, customer services, human resources, R&D, finance, and
information technology departments to achieve the company’s purpose and
maximize the profitability of customer interactions (Chen and Popovich,
2003, p. 673).
After Corona Virus Disease-2019/Covid-19 (Coronavirus) first
appeared in Wuhan, China towards the end of 2019, its effects began to
be felt clearly all over the world. If the Coronavirus crisis is not managed
properly in business-to-business (B2B) and business-to-consumer
(B2C) sectors, it can have serious negative consequences. In this crisis,
companies can typically face significant losses in their sales performance,
existing customers and customer satisfaction, interruptions in operations
and accordingly bankruptcy
Maximize Your Efficiency with This Comprehensive Project Management Platform ...SOFTTECHHUB
In today's work environment, staying organized and productive can be a daunting challenge. With multiple tasks, projects, and tools to juggle, it's easy to feel overwhelmed and lose focus. Fortunately, liftOS offers a comprehensive solution to streamline your workflow and boost your productivity. This innovative platform brings together all your essential tools, files, and tasks into a single, centralized workspace, allowing you to work smarter and more efficiently.
Small Business Management An Entrepreneur’s Guidebook 8th edition by Byrd tes...ssuserf63bd7
Small Business Management An Entrepreneur’s Guidebook 8th edition by Byrd test bank.docx
https://qidiantiku.com/test-bank-for-small-business-management-an-entrepreneurs-guidebook-8th-edition-by-mary-jane-byrd.shtml
m249-saw PMI To familiarize the soldier with the M249 Squad Automatic Weapon ...LinghuaKong2
M249 Saw marksman PMIThe Squad Automatic Weapon (SAW), or 5.56mm M249 is an individually portable, gas operated, magazine or disintegrating metallic link-belt fed, light machine gun with fixed headspace and quick change barrel feature. The M249 engages point targets out to 800 meters, firing the improved NATO standard 5.56mm cartridge.The SAW forms the basis of firepower for the fire team. The gunner has the option of using 30-round M16 magazines or linked ammunition from pre-loaded 200-round plastic magazines. The gunner's basic load is 600 rounds of linked ammunition.The SAW was developed through an initially Army-led research and development effort and eventually a Joint NDO program in the late 1970s/early 1980s to restore sustained and accurate automatic weapons fire to the fire team and squad. When actually fielded in the mid-1980s, the SAW was issued as a one-for-one replacement for the designated "automatic rifle" (M16A1) in the Fire Team. In this regard, the SAW filled the void created by the retirement of the Browning Automatic Rifle (BAR) during the 1950s because interim automatic weapons (e.g. M-14E2/M16A1) had failed as viable "base of fire" weapons.
Early in the SAW's fielding, the Army identified the need for a Product Improvement Program (PIP) to enhance the weapon. This effort resulted in a "PIP kit" which modifies the barrel, handguard, stock, pistol grip, buffer, and sights.
The M249 machine gun is an ideal complementary weapon system for the infantry squad platoon. It is light enough to be carried and operated by one man, and can be fired from the hip in an assault, even when loaded with a 200-round ammunition box. The barrel change facility ensures that it can continue to fire for long periods. The US Army has conducted strenuous trials on the M249 MG, showing that this weapon has a reliability factor that is well above that of most other small arms weapon systems. Today, the US Army and Marine Corps utilize the license-produced M249 SAW.
m249-saw PMI To familiarize the soldier with the M249 Squad Automatic Weapon ...
Cm ch4 scheduling
1. Construction Management 74 Dr. Emad Elbeltagi
CHAPTER 4
PROJECT SCHEDULING
In chapter 3, the AOA and AON networks were presented, also the time and cost of
individual activities based were calculated. Yet, however, we do not know how long is
the total project duration. Also, we need to evaluate the early and late times at which
activities start and finish. In addition, since real-life projects involve hundreds of
activities, it is important to identify the group of critical activities so that special care is
taken to make sure they are not delayed. All these statements are the basic objectives of
the scheduling process, which adds a time dimension to the planning process. In other
words, we can briefly state that: Scheduling = Planning + Time.
Scheduling is the determination of the timing of the activities comprising the project to
enable managers to execute the project in a timely manner. The project scheduling id
sued for:
- Knowing the activities timing and the project completion time.
- Having resources available on site in the correct time.
- Making correction actions if schedule shows that the plan will result in late
completion.
- Assessing the value of penalties on project late completion.
- Determining the project cash flow.
- Evaluating the effect of change orders on the project completion time.
- Determining the value pf project delay and the responsible parties.
2. Construction Management 75 Dr. Emad Elbeltagi
4.1 The Critical Path Method
The most widely used scheduling technique is the critical path method (CPM) for
scheduling. This method calculates the minimum completion time for a project along
with the possible start and finish times for the project activities. Many texts and managers
regard critical path scheduling as the only usable and practical scheduling procedure.
Computer programs and algorithms for critical path scheduling are widely available and
can efficiently handle projects with thousands of activities.
The critical path itself represents the set or sequence of activities which will take the
longest time to complete. The duration of the critical path is the sum of the activities'
durations along the path. Thus, the critical path can be defined as the longest possible
path through the "network" of project activities. The duration of the critical path
represents the minimum time required to complete a project. Any delays along the critical
path would imply that additional time would be required to complete the project.
There may be more than one critical path among all the project activities, so completion
of the entire project could be delayed by delaying activities along any one of the critical
paths. For example, a project consisting of two activities performed in parallel that each
requires three days would have each activity critical for a completion in three days.
Formally, critical path scheduling assumes that a project has been divided into activities
of fixed duration and well defined predecessor relationships. A predecessor relationship
implies that one activity must come before another in the schedule.
The CPM is a systematic scheduling method for a project network and involves four main
steps:
- A forward path to determine activities early-start times;
- A backward path to determine activities late-finish times;
- Float calculations; and
- Identifying critical activities.
3. Construction Management 76 Dr. Emad Elbeltagi
4.2 Calculations for the Critical Path Method
The inputs to network scheduling of any project are simply the AOA or the AON
networks with the individual activity duration defined. The network scheduling process
for AOA and AON networks, however, is different. To demonstrate these two techniques,
let’s consider a simple 5-activity project, with activity A at the start, followed by three
parallel activities B, C, and D; which are then succeeded by activity E. The AOA or the
AON networks of this example are presented in Figure 4.1. Detailed analysis of theses
AOA or the AON networks are presented in the following subsections. It is noted that the
example at hand involves only simple finish-to-start relationships among activities.
(a - AOA)
(b - AON)
Figure 4.1: Network example
4.2.1 Activity-On-Arrow Networks Calculations
The objective of arrow network analysis is to compute for each event in the network its
early and late timings. These times are defined as:
- Early event time (ET) is the earliest time at which an event can occur, considering
the duration of preceding activities.
B (3) d1
A (3) C (4) E (5)
D (6) d2
1 3
5
7
9 11
A
(3)
C
(4)
E
(5)
D
(6)
B
(3)
i j
Activity (duration)
Activity
(Duration)
4. Construction Management 77 Dr. Emad Elbeltagi
- Late event time (LT) is the latest time at which an event can occur if the project is
to be completed on schedule.
Forward Path
The forward path determines the early-start times of activities. The forward path proceeds
from the most left node in the network (node 1 – Figure 4.2) and moves to the right,
putting the calculations inside the shaded boxes to the left.
Each node in the network, in fact, is a point at which some activities end (head arrows
coming into the node), as shown in Figure 4.3. That node is also a point at which some
activities start (tail arrows of successor activities). Certainly, all successor activities can
start only after the latest predecessor is finished. Therefore, for the forward path to
determine the early-start (ES) time of an activity, we have to look at the head arrows
coming into the start node of the activity. We then have to set the activity ES time as the
latest finish time of all predecessors.
Figure 4.2: Preparation for the forward path
Figure 4.3: A node in an AOA network
B (3) d1
A (3) C (4) E (5)
D (6) d2
1 3
5
7
9 11
Predecessor 1
Successor 1
Predecessor 2
Predecessor 3 Successor 2
no.
5. Construction Management 78 Dr. Emad Elbeltagi
In this example, the forward path calculations are as follows:
- Start at node 1, the first node of the project, and assign it an early-start time of zero.
Here, all activity times use an end-of-day notation. Therefore, the ES of activity A is
zero means that activity starts at end of day zero, or the beginning of day 1 in the
project.
- Then, move to node 3. This node receives one head arrow, and as such, it has one
predecessor, activity A. Since the predecessor started on time zero and has 3 days
duration, then, it ends early at time 3 (Early-Finish (EF) = Early-Start (ES) + d).
Accordingly, the ES time of all successor activities to node 3 (activities B, C, and D)
is time 3. This value is therefore, put in the shaded box on top of node 3, as shown in
Figure 4.4.
Figure 4.4: Forward path calculations in AOA networks
- Now, move forward to successor nodes 5, 7, and 9. However, since node 9 is linked
to nodes 5 and 9 by dummy activities, we begin with nodes 5 and 7. Node 5 receives
one head arrow from its predecessor activity B, we evaluate the EF time of B as 6 (ES
(3) + d (3)). Successor activities to node 5, therefore, can have an ES time of 6.
Similarly, the ES time at node 7 is calculated as time 9.
- Moving to node 9, the EF times of its 3 predecessors (d1, C, and d2) are time 6, 7,
and 9, respectively. Accordingly, the ES time of successor activities is the largest
B d1
3
A C E
d=3 4 5
D d2
6
1 3
5
7
9 11
0
9
6
3
9
14
3+6=9
6+0=6
3+4=7 or
9+0=9
9+5=14
3+3=6
Project
start=0
ES+d=EF
0+3=3
6. Construction Management 79 Dr. Emad Elbeltagi
value 9. Notice that only the largest EF value of predecessor activities is used to
calculate the ES of successor activities and all other values not used. As such, only
ES values can be directly read from the calculations in Figure 4.4. EF values, on the
other hand can be calculated as EF = ES + d.
- The last node (11) receives one head arrow, activity E which has an ES value of 9.
The EF time of activity E, therefore =9 + 5 = time 14. Since node 11 is the last node,
the EF of this node becomes the end of the project, reaching total project duration of
14 days.
Generally, for any activity x connecting between nodes i and j as shown in Figure 4.5, the
calculations as follows:
Figure 4.5: Activity times
ETj = ETi + dx
(4.1)
In case of more than one arrow terminating at node j, then consider the largest value.
Accordingly, ESx = ETi (4.2)
EFx = ESx +dx (4.3)
Backward Path
The backward path determines the late-finish (LF) times of activities by proceeding
backward from the end node to the starting node of the AOA network. We put the LF
values in the right side boxes adjacent to the nodes, as shown in Figure 4.6. For the
example at hand, we do the following:
i j
ETiLTi ETj LTj
` x
dx
7. Construction Management 80 Dr. Emad Elbeltagi
Figure 4.6: Backward path calculations in AOA networks
- Start from the last node of the network (node 11) and we transfer the early-finish
value from the left box to be the late-finish (LF) value at the right side box.
- Then, move backward to node 9 which has only one tail arrow of activity E. With the
LF time of E being time 14, its LS time becomes LS = LF - d = 14 – 5 = time 9. At
node 9, therefore, time 9 becomes the LF time of the predecessor activities of this
node.
- Moving backward to predecessor nodes 5, and 7. Node 5 has one tail arrow of the
dummy activity d1, and as such, the LF time value to be used at node 5 becomes 9.
Similarly, the LF time value of node 7 becomes 9.
- Moving to node 3, we evaluate the LS time of its 3 successor activities B, C, and D as
6, 5, and 3, respectively. The LF time at node 3, therefore, becomes the smallest value
3. With other LS values not used, the values in the calculation boxes, as such, directly
show the LF times of activities. LS times can be calculated as LS = LF – d.
- Now, proceed to the first node in the network (node 1). It connects to one tail arrow
of activity A. The LS time of A, therefore, is LS = LF – d = 3 – 3 = 0, a necessary
check to ensure the correctness of the calculation.
B d1
3
A C E
3 4 5
D d2
6
1 3
5
7
9 11
0 0
9 9
6 9
3 3
9 9
14 14
9-0=9
14-5=9
LF-d=LS
9-0=9
3-3=0
9-3=6,
9-4=5, or
9-6=3
8. Construction Management 81 Dr. Emad Elbeltagi
Having Figure 4.5 again in mind and to generalize the calculations, for any activity x
connecting between nodes i and j, the calculations as follows:
LTi = LTj - dx (4.4)
In case of more than one arrow leaving node i, then consider the smallest value.
Accordingly, LFx = LTj (4.5)
LSx = LFx -dx (4.6)
Float Calculations
Once forward path and backward path calculations are complete, it is possible to analyze
the activity times. First, let's tabulate the information we have as shown in Table 4.1. One
important aspect is Total-Float (TF) calculations, which determine the flexibility of an
activity to be delayed. Notice in Table 4.1 that some activities such as activity A has ES
time = LS time, and its EF time = LF time, indicating no slack time for the activity. Other
activities such as B can start early at time 3 and late at time 6, indicating a 3-day of total
float. Float calculations can be illustrated as shown in Figure 4.7 for any activity.
Table 4.1: CPM results
Activity Duration
Early Start
(ES)
Late Finish
(LF)
Late Start
(LS)
Early Finish
(EF)
Total Float
(TF)
Critical
Activity
A
B
C
D
E
3
3
4
6
5
0
3
3
3
9
3
9
9
9
14
0
6
5
3
9
3
6
7
9
14
0
3
2
0
0
Yes
No
No
Yes
Yes
Figure 4.7 shows two ways of scheduling each activity using its activity times. One way
is to schedule it as early as possible (using its ES time). The other way is as late as
9. Construction Management 82 Dr. Emad Elbeltagi
possible (using its LS time). The activity float can, therefore, be represented by the
following relationships:
Total Float (TF) = LF – EF (4.7)
= LS – ES (4.8)
Figure 4.7: Float calculations
Also, with the ES and LF times directly read from the boxes used in forward and
backward path calculations, the total float can also be calculated as; TF = LF – ES – d.
Using these relationships, activities total floats are calculated as shown in Table 4.1.
Another type of float often used in network analysis is the Free Float, which can be
calculated as:
Free Float (FF) = ETj – ETi – d (4.9)
or FF = smallest ES (of succeeding activities) – EF (of current activity) (4.10)
The free float defines the amount of time that an activity can be delayed without affecting
any succeeding activity. With free float available for an activity, a project manager
ES EF=ES+d Total Float
d LF
ES Total Float LS=LF-d
d LF
d Free Float (FF)
Total time available for the activity = LF - ES
i j
ET LT
Name
duration = d
a) Activity is early
b) Activity is late
LT ET
ES = ETi ETj LF = LTj
10. Construction Management 83 Dr. Emad Elbeltagi
knows that the float can be used without changes the status of any non-critical activity to
become critical.
Identifying the Critical Activities
Activities with zero total floats mean that they have to be constructed right at their
schedule times, without delays. These activities are considered to be critical. They
deserve the special attention of the project manager because any delay in critical
activities causes a delay in the project duration.
One interesting observation in the results of CPM analysis is that critical activities form a
continuous path of the critical activities that spans from the beginning to the end of the
network. In our example, activities A, D, and E (excluding dummy activities) are critical
and the critical path is indicated by bold lines on Figure 4.6. Notice that among the 3
paths in this example (A-B-E; A-C-E; and A-D-e), the critical path is the longest one, an
important characteristic of the critical path. In real-life projects with many activities, it is
possible that more than one critical path are formed. By definition, the length of these
critical paths is the same.
4.2.2 Precedence Diagram Method (PDM)
Precedence Diagram Method (PDM) is the CPM scheduling method used for AON
networks and it follows the same four steps of the CPM for AOA method.
Forward Path
Forward path can proceed from one activity to the other; the process is as follow (Figure
4.8):
- At activity A. It is the first activity in the network. We give it an early-start (ES) of 0
in the left top box. Adding the activity duration, we determine the EF time of the
activity and we put it in the top right box.
11. Construction Management 84 Dr. Emad Elbeltagi
Figure 4.8: Forward Path in PDM Analysis
- Then, move forward to the succeeding activities B, C, and D. These three activities
have only A as a predecessor with time 3 as its EF. As such, all the three activities
can start as early as time 3 (ES = 3). Each activity, accordingly, has its own EF time
based on its duration.
- Moving forward to activity E. This activity has 3 predecessors (3 head arrows) of
activities B, C, and D with their largest EF time being 9. The ES of activity E, thus,
with becomes time 9. Adding its duration, the EF becomes time 14.
To generalize the calculations consider Figure 4.9, of two activities i and j with
relationship finish to start and overlap between them. Overlaps will have a positive sign,
while lags will have a negative sign. The forward path calculations are as follows:
Figure 4.9: Activities times in PDM Analysis
ESj = EFi - overlapij (4.11)
In case of more than one activity precedes activity j then consider the maximum. Then,
apply Equation 4.3 to calculate the early finish times.
A (3)
0 3
D (6)
3 9
C (4)
3 7
E (5)
9 14
B (3)
3 6
Name (duration)
Late start Late finish
Early start Ealry Finish
6, 7, or 9
i (di)
LSi LFi
ESi EFi
j (dj)
LSj LFj
ESj EFj
overlapij
12. Construction Management 85 Dr. Emad Elbeltagi
Backward Path
Once the forward path is finished, the backward path can start, moving from the last
activity to the first, putting the calculations in the bottom two boxes of each activity, as
shown in Figure 4.10. The process is as follows:
Figure 4.10: Backward path in PDM analysis
- Start at the last activity E and we transfer the early-finish value to become the
activity's late-finish (LF) time. Then, subtracting the activity's own duration, the late-
start (LS) time is calculated as time 9 and put in the bottom left box of the activity.
- Moving backward to activities B, C, and D all have one successor (activity E) with
LS time of 9. The LF of all these activities becomes time 9. Each activity then has its
own LS time, as shown in Figure 4.10.
- Moving to activity A. The activity is linked to 3 tail arrows (i.e., has 3 successors) of
activities B, C, and D. The LF of activity A, thus, is the smallest of its successors' LS
times, or time 3. Activity A then has LS equals zero.
Considering Figure 3.9 again, the backward path calculations are as follows:
LFi = LSj + overlapij (4.12)
A (3)
0 3
0 3
D (6)
3 9
3 9
C (4)
5 9
3 7
E (5)
9 14
9 14
B (3)
6 9
3 6
Name (duration)
Late start Late finish
Early start Early Finish
6, 5, or 3
13. Construction Management 86 Dr. Emad Elbeltagi
In case of more than one activity succeeds activity j then consider the minimum. Then,
apply Equation 4.6 to calculate the late start times.
Notice that by the end of the backward path, all activity times can be read directly from
the boxes of information on the activity, without additional calculations. This also, makes
it simple to calculate the total float of each activity using the same relationships used in
the AOA analysis.
Identifying Critical Activities
Critical activities can also be easily determined as the ones having zero float times,
activities A, D, and E. The critical path is then shown in bold as Figure 4.10. The PDM
analysis, as explained, is a straight forward process in which each activity is considered
as an entity that stores its own information.
4.3 Time-Scaled Diagrams
Time-scaled diagrams are used extensively in the construction industry. Such diagrams
enable one to determine immediately which activities are scheduled to proceed at any
point in time and to monitor field progress. Also, it can be used to determine resources
need. The time scale used in time-scaled diagrams can be either the calendar dates or the
working periods (ordinary dates), or using both at the same time.
The activities are represented as arrows that drawn to scale to reflect the activity duration
it represents. The horizontal dashed lines represent total float for groups of activities and
free float for the immediate activity to the left of the dashed line. The precedence of an
activity is the immediate activities before it or that linked to it through vertical dashed
lines. The name and the duration of an activity are written above and below the arrow
representing it respectively (Figure 4.11). The ES, EF, and FF times of the activities can
be easily read directly from the diagram. The TF for an activity is the smallest sum of
succeeding FF on all paths. Accordingly, the LS and LF times can be easily calculated as
follows:
14. Construction Management 87 Dr. Emad Elbeltagi
LSi = ESi + TFi (4.13)
LFi = LSi + Di (3.14)
The critical path can be easily determined as the continuous lines from the beginning to
the end of the network with any dashed lines. The main advantage of this diagram is its
simple representation and it can be sued directly for determining resources need.
However, its disadvantage is that it needs a great effort to be modified or updated. Also,
it cannot be used to represent overlapping activities. Figure 4.11 shows the time-scaled
diagram for the same 5-activities project solved previously using AOA and AON
networks.
Figure 4.11: Time-scaled diagram
The TF for activity A equals the smallest of the sum of the floats along all paths from the
end of activity A to the end of the project. The float on path ABE = 3, path ACE = 2 and
path ADE = 0, then the TF of activity A = 0. The calculations are shown in Table 3.2.
Table 4.2 Time-scaled diagram calculations
Activity ES EF FF TF LF=EF+TF LS=LF-d
A
B
C
D
E
0
3
3
3
9
3
6
7
9
14
0
3
2
0
0
0
3
2
0
0
3
9
9
9
14
0
6
5
3
9
1 2 3 4 5 6 7 8 9 10 11 12 13 14
A C
B
D
15. Construction Management 88 Dr. Emad Elbeltagi
4.4 Schedule Presentation
After the AOA and AON calculations are made, it is important to present their results in a
format that is clear and understandable to all the parties involved in the project. The
simplest form is the Bar chart or Gantt chart, named after the person who first used it. A
bar chart is a time versus activity chart in which activities are plotted using their early or
late times, as shown in Figures 4.12 a and b. Early bar chart is drawn using the ES times
of activities, while the late bar chart is drawn using the LS times.
Figure 4.12: a) Early bar chat b) Late bar chart
The bar chart representation, in fact, shows various details. Float times of activities,
critical activities can be shown in a different color, or bold borders, as shown in Figure
4.12. The bar chart can also be used for accumulating total daily resources and / or costs,
as shown at the bottom part of Figure 4.13. In this figure, the numbers on each activity
represent the number of labors needed.
d=3
ES = 0 d=3 TF=3
ES=3
d=4 TF=2
ES=3
d=6
ES=3
d=5
ES=9
d=3
LF=3
TF=3 d=3
LF=9
TF=2 d=4
LF=9
d=6
LF=9
d=5
A
B
C
D
E
Activity
0 1 2 3 4 5 6 7 8 9 10 11 12 13 14 Time
A
B
C
D
E
Activity
0 1 2 3 4 5 6 7 8 9 10 11 12 13 14 Time
LF=14
a)
b)
16. Construction Management 89 Dr. Emad Elbeltagi
Figure 4.13: Using bar chart to accumulate resources
One additional benefit of the bar chart is its use on site to plot and compare the actual
progress in the various activities to their scheduled times. An example is shown on Figure
4.13, showing actual bars plotted at the bottom of the original bars of the schedule.
4.5 Criticisms to Network Techniques
The CPM and PDM analyses for network scheduling provide very important information
that can be used to bring the project to success. Both methods, however, share some
drawbacks that require special attention from the project manager. These drawbacks are:
- Assume all required resources are available: The CPM calculations do not incorporate
resources into their formulation. Also, as they deal with activity durations only, it can
result in large resource fluctuations. Dealing with limited resources and resource
leveling, therefore, has to be done separately after the analysis;
2 2 2
2 2 2
1 1 1 1
3 3 3 3 3 3
1 1 1 1 1
2 2 2 6 6 6 4 3 3 1 1 1 1 1 Total labors
A
B
C
D
E
Activity
Profile of the labor
resource demand
6
5
4
3
2
1
1
2
3
4
6
0 1 2 3 4 5 6 7 8 9 10 11 12 13 14 Time
17. Construction Management 90 Dr. Emad Elbeltagi
- Ignore project deadline: The formulations of CPM and PDM methods do not
incorporate a deadline duration to constrain project duration;
- Ignore project costs: Since CPM and PDM methods deal mainly with activities
durations, they do not deal with any aspects related to minimize project cost;
- Use deterministic durations: The basic assumption in CPM and PDM formulations is
that activity durations are deterministic. In reality, however, activity durations take
certain probability distribution that reflect the effect of project conditions on resource
productivity and the level of uncertainty involved in the project.
4.6 Solved Examples
4.6.1 Example 1
For the project data in Table 4.3, answer the following questions:
a) Draw an AOA network of the project?
b) Perform forward path and backward path calculations?
c) What is the effect of delaying activity D by 3 days?
Table 4.3: Data for Example 1
Activity Duration
Immediate
predecessor
A
B
C
D
E
F
G
2
6
3
1
6
3
2
-
A
A
B
B
C, D
E, F
18. Construction Management 91 Dr. Emad Elbeltagi
Solution
a, b)
c) Total float of activity D = LF – ES – d = 11 – 8 – 1 = 2.
Then delaying activity D by 1 day more than its total float will cause a net delay in
the whole project by 1 day to become 17 days.
4.6.2 Example 2
Perform PDM calculations for the small project below and determine activity times.
Durations are shown on the activities.
B E
6 6
A D 1 G
2 2
C F 3
3
1 2
3
4
5 6
0 0
8 8
2 2 14 14 16 16
9 or
5
14 or
12
8 or
10
2 or
8
9 11
Critical
A
(1)
I
(2)
J
(7)
H
(1)
D
(1)
B
(4)
C
(1)
E
(2)
F
(2)
G
(1)
L
(2)
K
(4)
19. Construction Management 92 Dr. Emad Elbeltagi
Solution
4.6.3 Example 3
For the activities listed in the table below, draw the time-scaled diagram and mark the
critical path. Determine the completion time for the project. Tabulate activities times and
floats.
Activity Duration Predecessor
A
B
C
D
E
F
G
H
I
J
4
4
8
3
5
2
8
5
17
10
-
A
B
C
A
B, E
C, F
D, G
-
G, I
C (1)
6 7
1 2
J (7)
7 14
7 14
Name (duration)
LS LF
ES EF
9 or
9 or
14
L (2)
14 16
14 16
H (1)
9 10
4 5
A (1)
0 1
0 1
B (4)
1 5
1 5
G (1)
6 7
6 7
E (2)
7 9
2 4
K (4)
10 14
5 9
F (2)
8 10
2 4
I (2)
12 14
7 9
D (1)
5 6
5 6
Critical path
12 or
7
1 or 6
7 or 8 5 or 4
20. Construction Management 93 Dr. Emad Elbeltagi
Solution
Activity ES EF TF FF LS LF
A
B
C
D
E
F
G
H
I
J
0
4
8
16
4
9
16
24
0
24
4
8
16
19
9
11
24
29
17
34
0
0
0
10
5
5
0
5
7
0
0
0
0
5
0
5
0
5
7
0
0
4
8
26
9
14
16
29
7
24
4
8
16
29
14
16
24
34
24
34
4.6.4 Example 4
Perform PDM calculations for the small AoN network shown here. Pay special attention
to the different relationships and the lag times shown on them.
A
(3)
D
(6)
B
(3)
C
(4)
E
(5)
SS=2
FF=2
A B C D H
4 4 8 3 5 5 5
I J
17 7 10
F G
1 2 5 8
1 2 3 4 5 6 7 8 9 0 1 2 3 4 5 6 7 8 9 0 1 2 3 4 5 6 7 8 9 0 1 2 3 4
0 1 2 3
21. Construction Management 94 Dr. Emad Elbeltagi
Solution
4.7 Exercises
1. The free float is defined as:
a. The amount of time an activity can be delayed without affecting the following
activity.
b. The amount of time an activity can be delayed without affecting total project
duration.
2. Total float equals:
a. Late finish minus early finish c. Late start minus early start
b. Late finish minus (early start + duration) d. All of the above
3. State True (T) or False (F):
a. The critical activities can be determined easily when using the bar chart.
b. The network must have definite points of beginning and end.
c. The network must be continuous from start to end.
d. There’s no dummy activities in the arrow networks,
e. A forward pass is used to determine late start and late finish times.
D (6)
4 10
3 9
B (3)
4 7
2 5
C (4)
3 7
3 7
Name (duration)
LS LF
ES EF
A (3)
0 3
0 3
E (5)
7 12
7 12
12-2=10
4 or
3 or
(4-2+3)
SS=2
FF=2
5, 7 or
(9+2-5)
0+2=2
22. Construction Management 95 Dr. Emad Elbeltagi
f. The time for completing a project is equal to the sum of the individual activity
times.
4. For the Following project data, answer the following questions:
Activity Duration (days) Predecessor
A
B
C
D
E
F
G
2
6
3
1
6
3
2
--
A
A
B
B
C, D
E, F
a. Draw an AOA network and perform forward and backward pass calculations?
b. Draw an AON network and perform forward and backward pass calculations?
c. Draw a time-scaled diagram of the project?
d. Tabulate activities ES, EF, LS, LF, TF, and FF.
e. What is the effect of delaying activity D by 3 days?
5. For the following AOA network, determine the following:
a. Calculate ES, LF, & TF for all activities. Identify critical ones.
b. Draw an early Bar Chart for the project.
c. What is the effect of delaying activity “H” by two days on the total project
duration?
1 5
7
11 15 17
3
13
9
E (10)
23. Construction Management 96 Dr. Emad Elbeltagi
6. Perform PDM calculations for the project below and determine activity times.
Durations are shown on the activities
7. A gas station is proposed to be built on an already developed site. It will consist
essentially of a sales outlet and an office block. The sales outlet comprises of cash
office and gas pumps. The manager’s office building, which also houses public
washrooms and an air compressor, is called the office block. Adjacent to pumps
will be a concrete pit that will house the gas tanks.
The entire area, excluding the office and pumps site, is covered with a concrete
slab, and there is a low perimeter wall in the rear. The utility company has
undertaken to install an electric meter on the site and connect it to the mains.
Gasoline pumps must be obtained from the manufacturers, and after being
installed, they are to be connected to the gasoline tanks and the power supply.
Before use the local authority to ensure safety and compliance with regulations
must inspect them. Gasoline tanks are housed in concrete pits and covered by
concrete slabs. Before they are covered, however, the tanks and the associated
pipe work have to be inspected by the local authority. The sales outlet base is
excavated first, the pipe work and tanks second, the office block third, and the
A
(1)
I
(2)
J
(7)
H
(1)
D
(1)
B
(4)
C
(1)
E
(2)
F
(2)
G
(1)
L
(2)
K
(4)
24. Construction Management 97 Dr. Emad Elbeltagi
trench for underground services last. After the excavation for the tanks and pipe
work is completed, work can proceed on the construction of the perimeter wall
and air points.
No Activity Description Duration
A
B
C
D
E
F
G
H
I
J
K
L
M
N
O
P
Q
R
S
T
U
V
W
X
Y
Z
AA
BB
CC
DD
EE
FF
Excavate for sales outlet
Construct sales outlet base
Construct cash office
Obtain pumps
Install pumps
Connect pumps
Inspector approves pumps installation
Paint & furnish office & washrooms
Connect office & toilet lighting
Excavate for office block
Construct office block
Build office & washrooms + services
Install electric meter
Connect main cable to meter
Install area lighting
Mobilize site
Set out and level site
Excavate & lay underground services
Excavate for pipes and tanks
Construct concrete pit
Obtain pipes and tanks
Install pipes and tanks
Obtain compressor
Install compressor
Connect power to compressor
Inspection of compressor
Backfill and cover tanks
Pour concrete slab
Construct perimeter wall + air points
Connect air points
Demobilize and clean site
Inspection of pipes and tanks
1
1
2
16
2
1
2
2
1
1
1
15
14
1
4
1
1
1
1
2
2
3
10
1
1
2
1
2
2
1
1
2
25. Construction Management 98 Dr. Emad Elbeltagi
Compressed air for inflated tires will be supplied by an electrically driven
compressor, which must be inspected by a competent person before the
compressor is put into use. The air lines to the “free air” points are installed with
the general underground services, and the points themselves are mounted on the
perimeter wall. The air pints can be hooked up after the concrete slab has been
poured. Mobilization to start work comprises, among other preparations, the
moving of a trailer to the site to store tools, furnishings, and any weather prone
parts and to serve as the site office. Similarly, when work at the site is completed,
the trailer will be removed, and all scaffolding and construction equipment taken
away. This is known as “demobilization and clean up of site.
You are required to determine the project duration, critical path(s), and tabulate
activity times (ES, EF, LS, LF, TF, and FF).
8. For the following list of activities, draw a time-scaled diagram and mark the
critical path. Determine activities ES, EF, LS, LF, FF, and TF.
Activity Duration (days) Predecessor
A
B
C
D
E
F
G
H
I
J
K
L
M
4
10
2
6
15
4
3
2
1
3
2
1
2
--
A
A
C
B, D
B, D
F
B, D
E, G, H
I
E
J
K, L
26. Construction Management 99 Dr. Emad Elbeltagi
9. For the following PDM, perform the forward pass and backward pass
calculations. Determine the project duration and critical path. Tabulate the ES,
EF, LS, LF, TF, and FF information for each activity.
A
10
B
8
D
12
E
7
C
8
F
9
H
10
G
12
I
8
SS3, FF4 SS2
SF5
FF7
SS8
FF5
FF3FS6
J
0
SS8