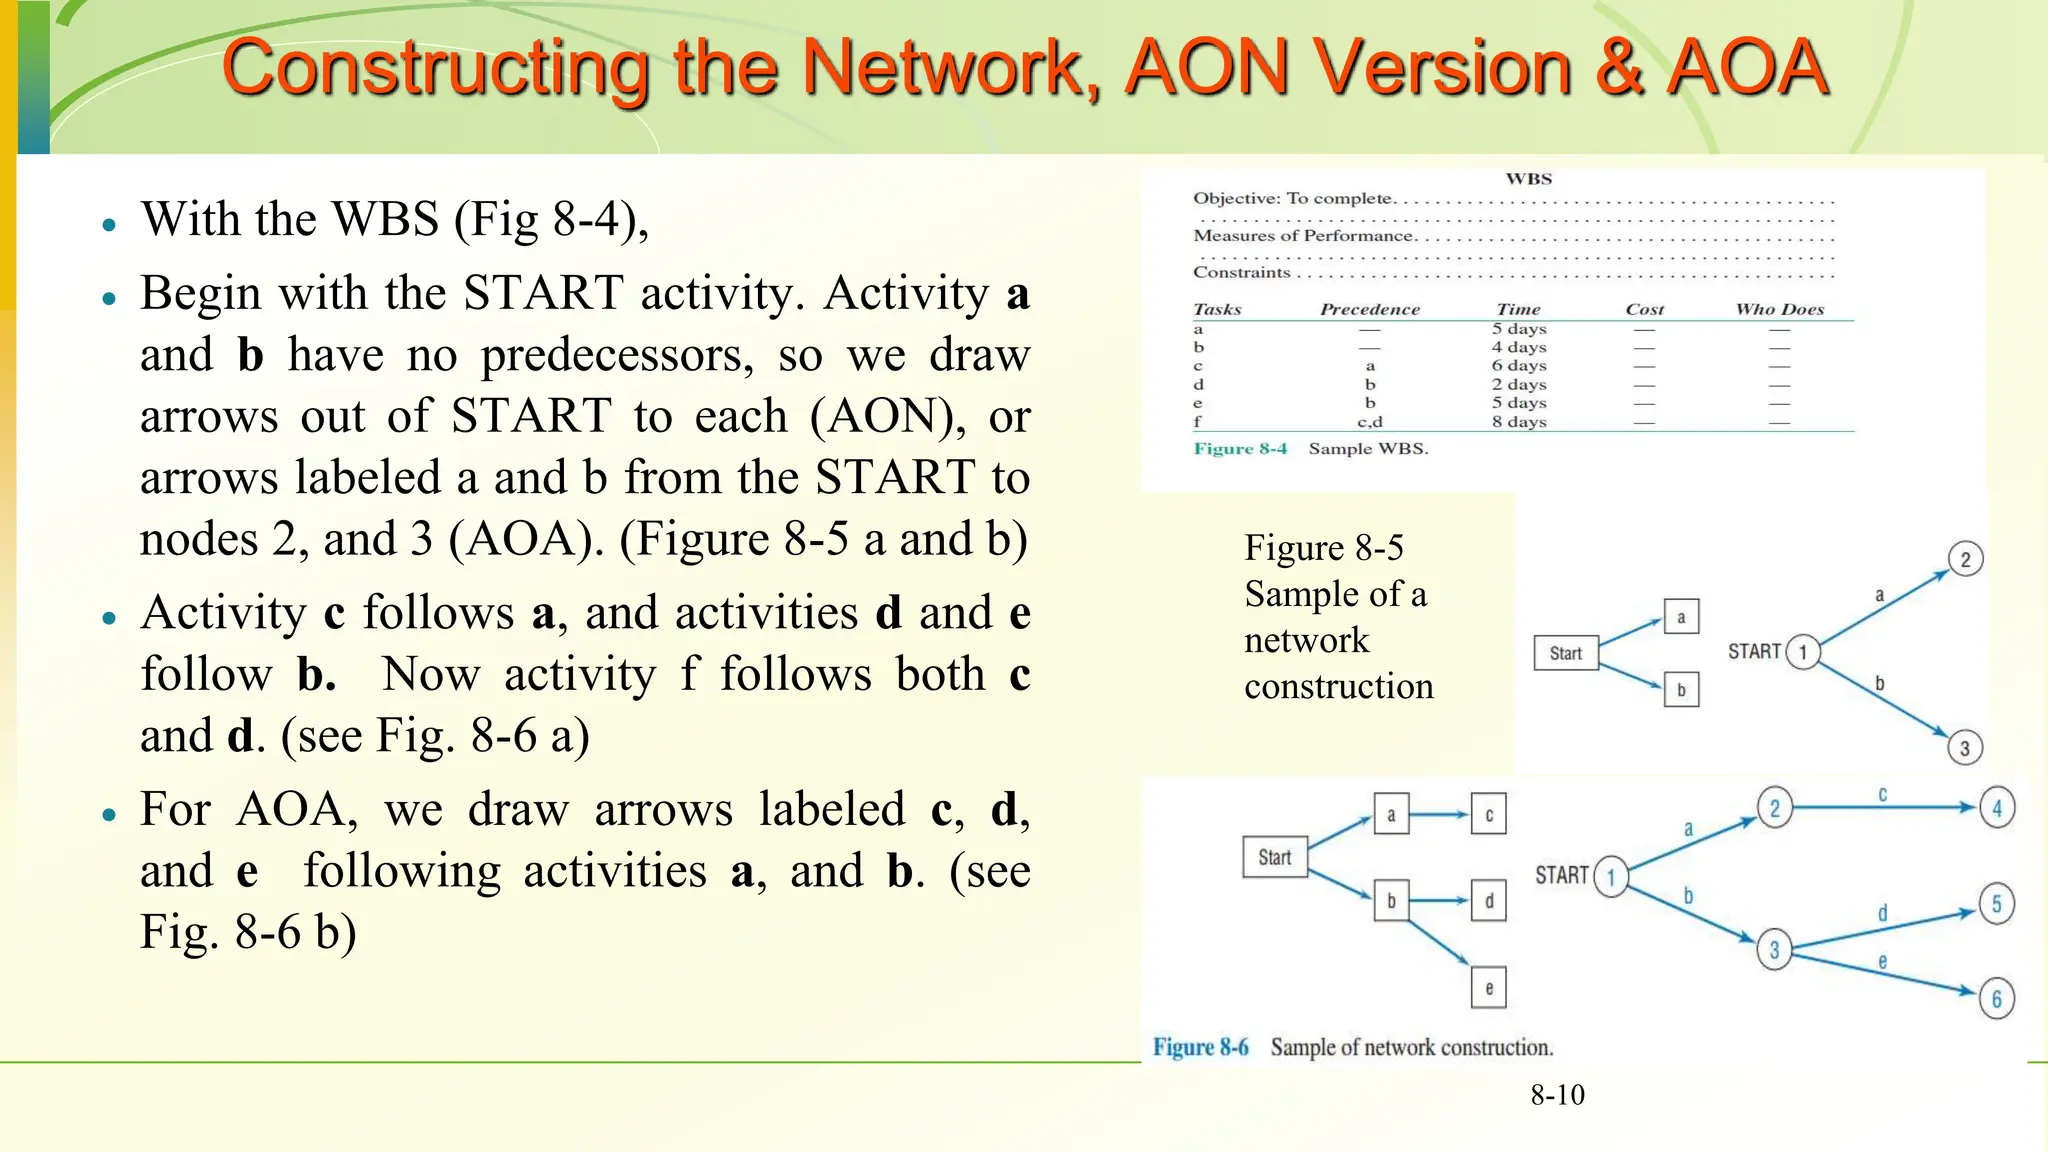
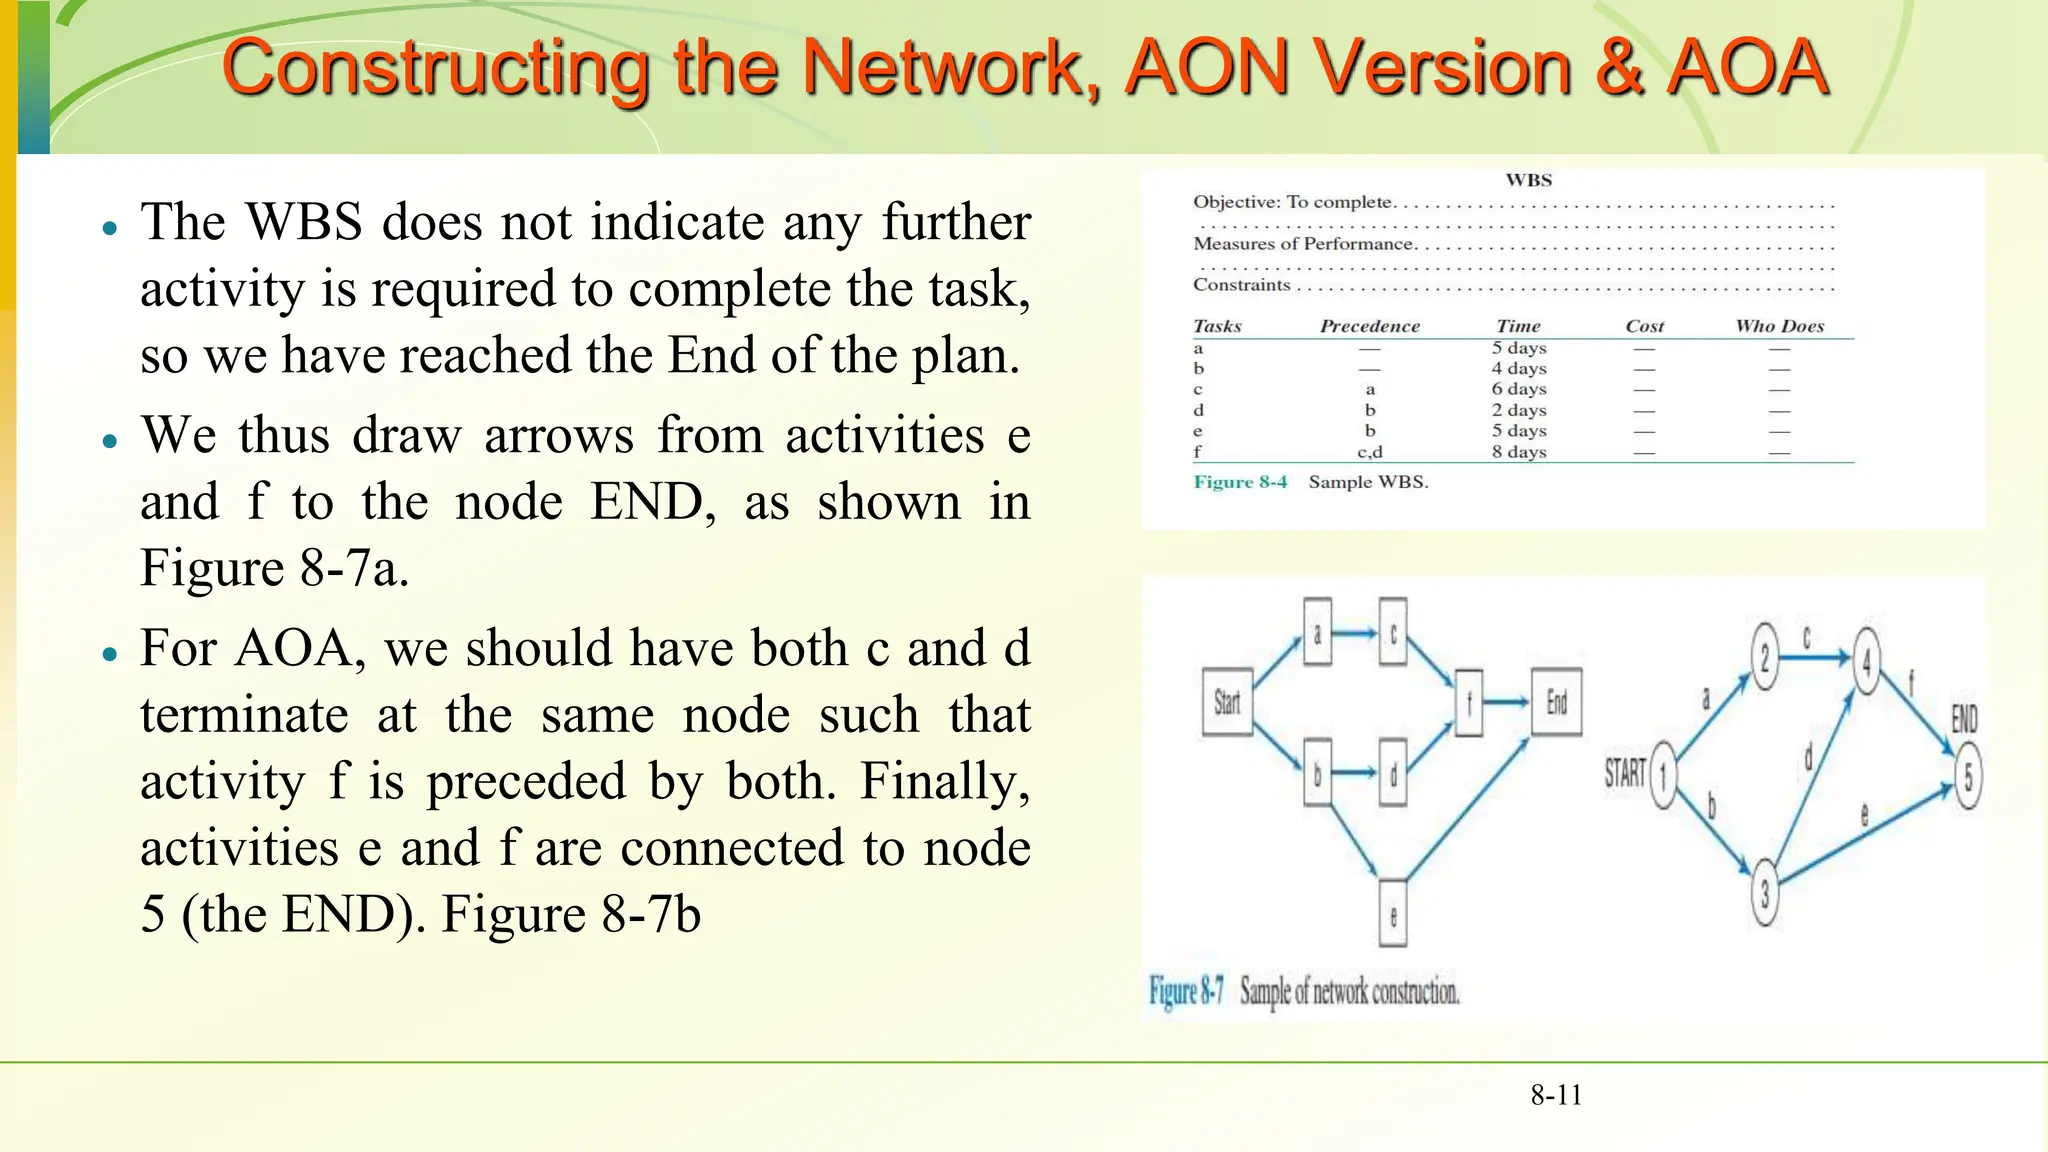
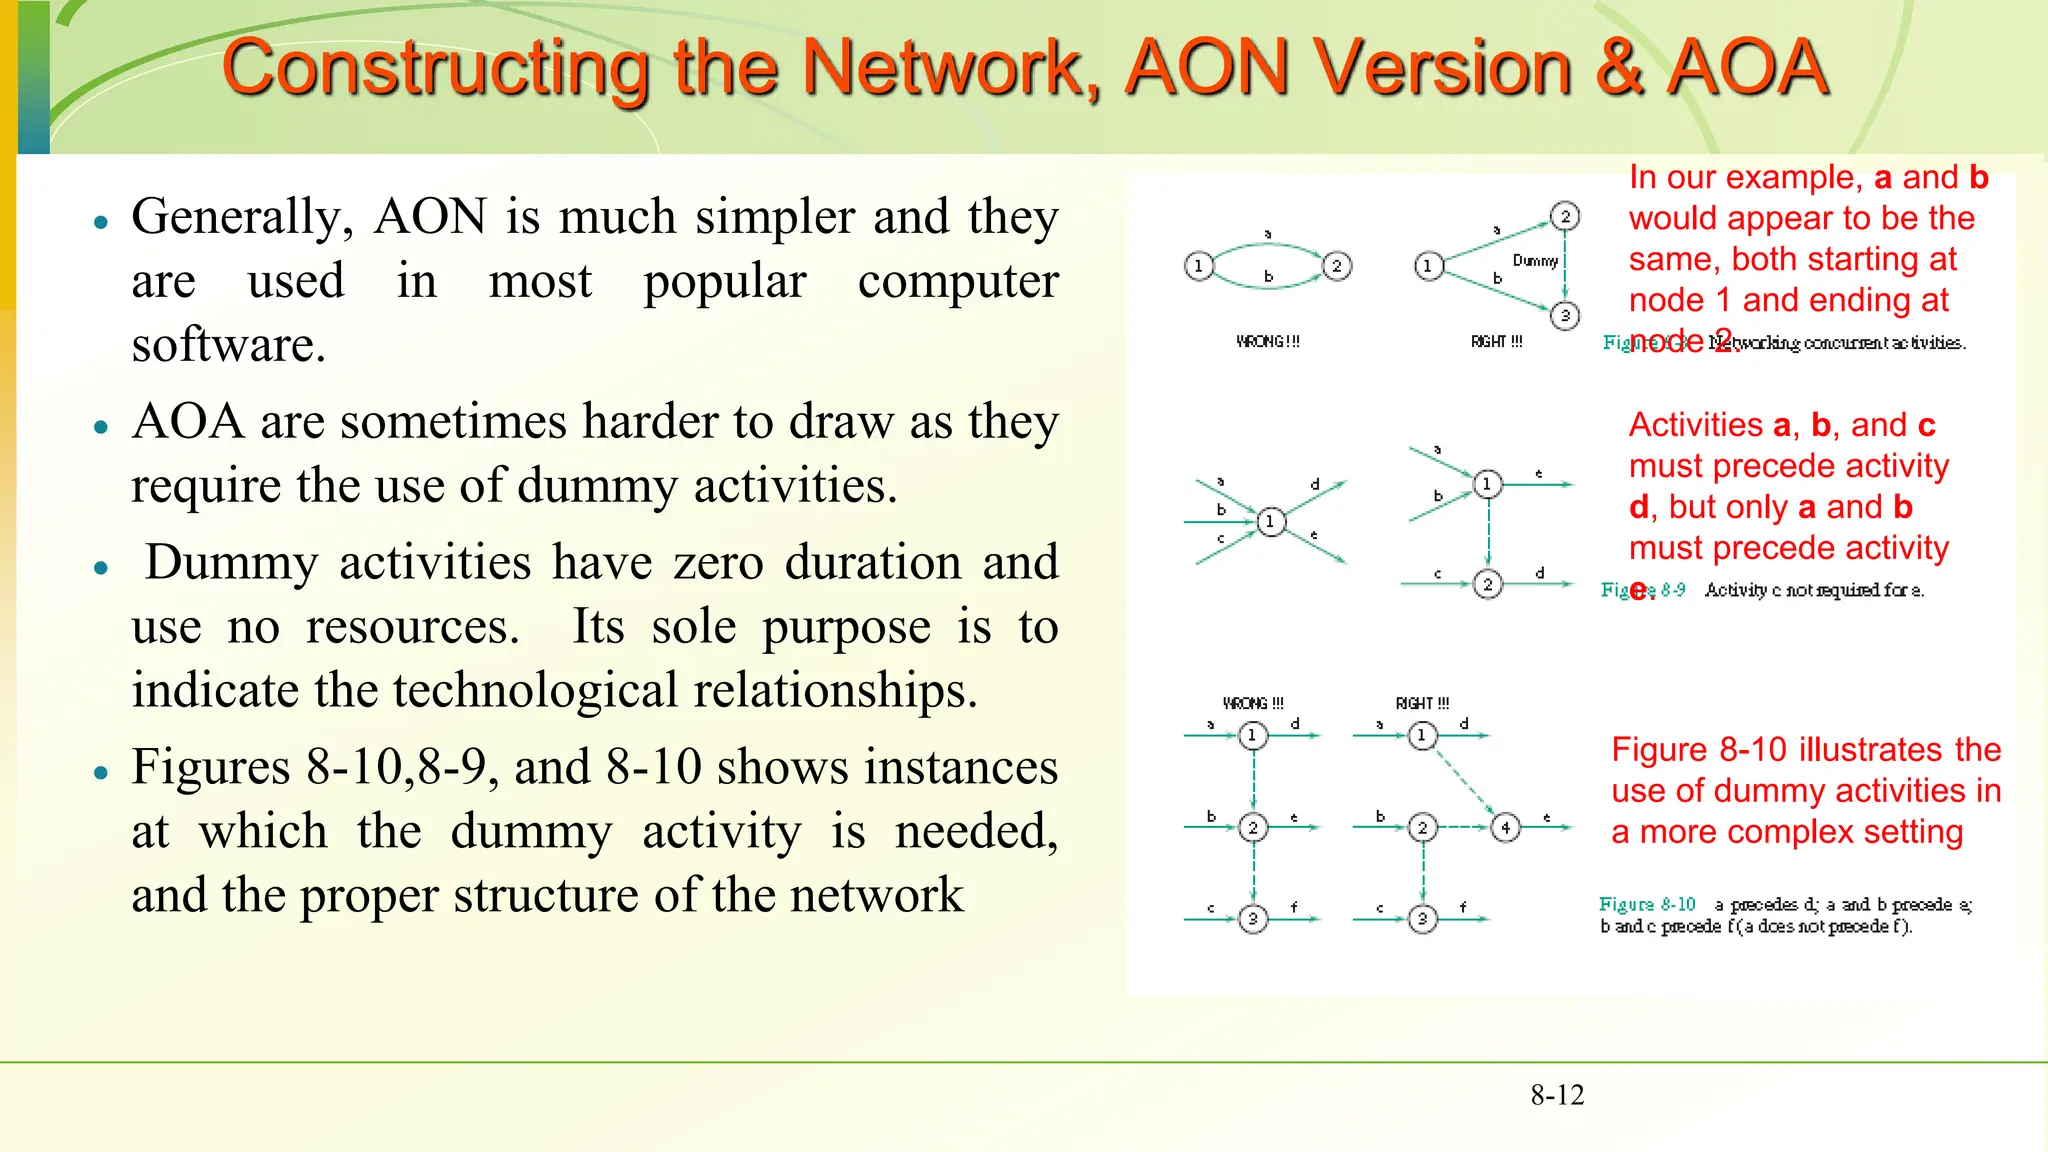
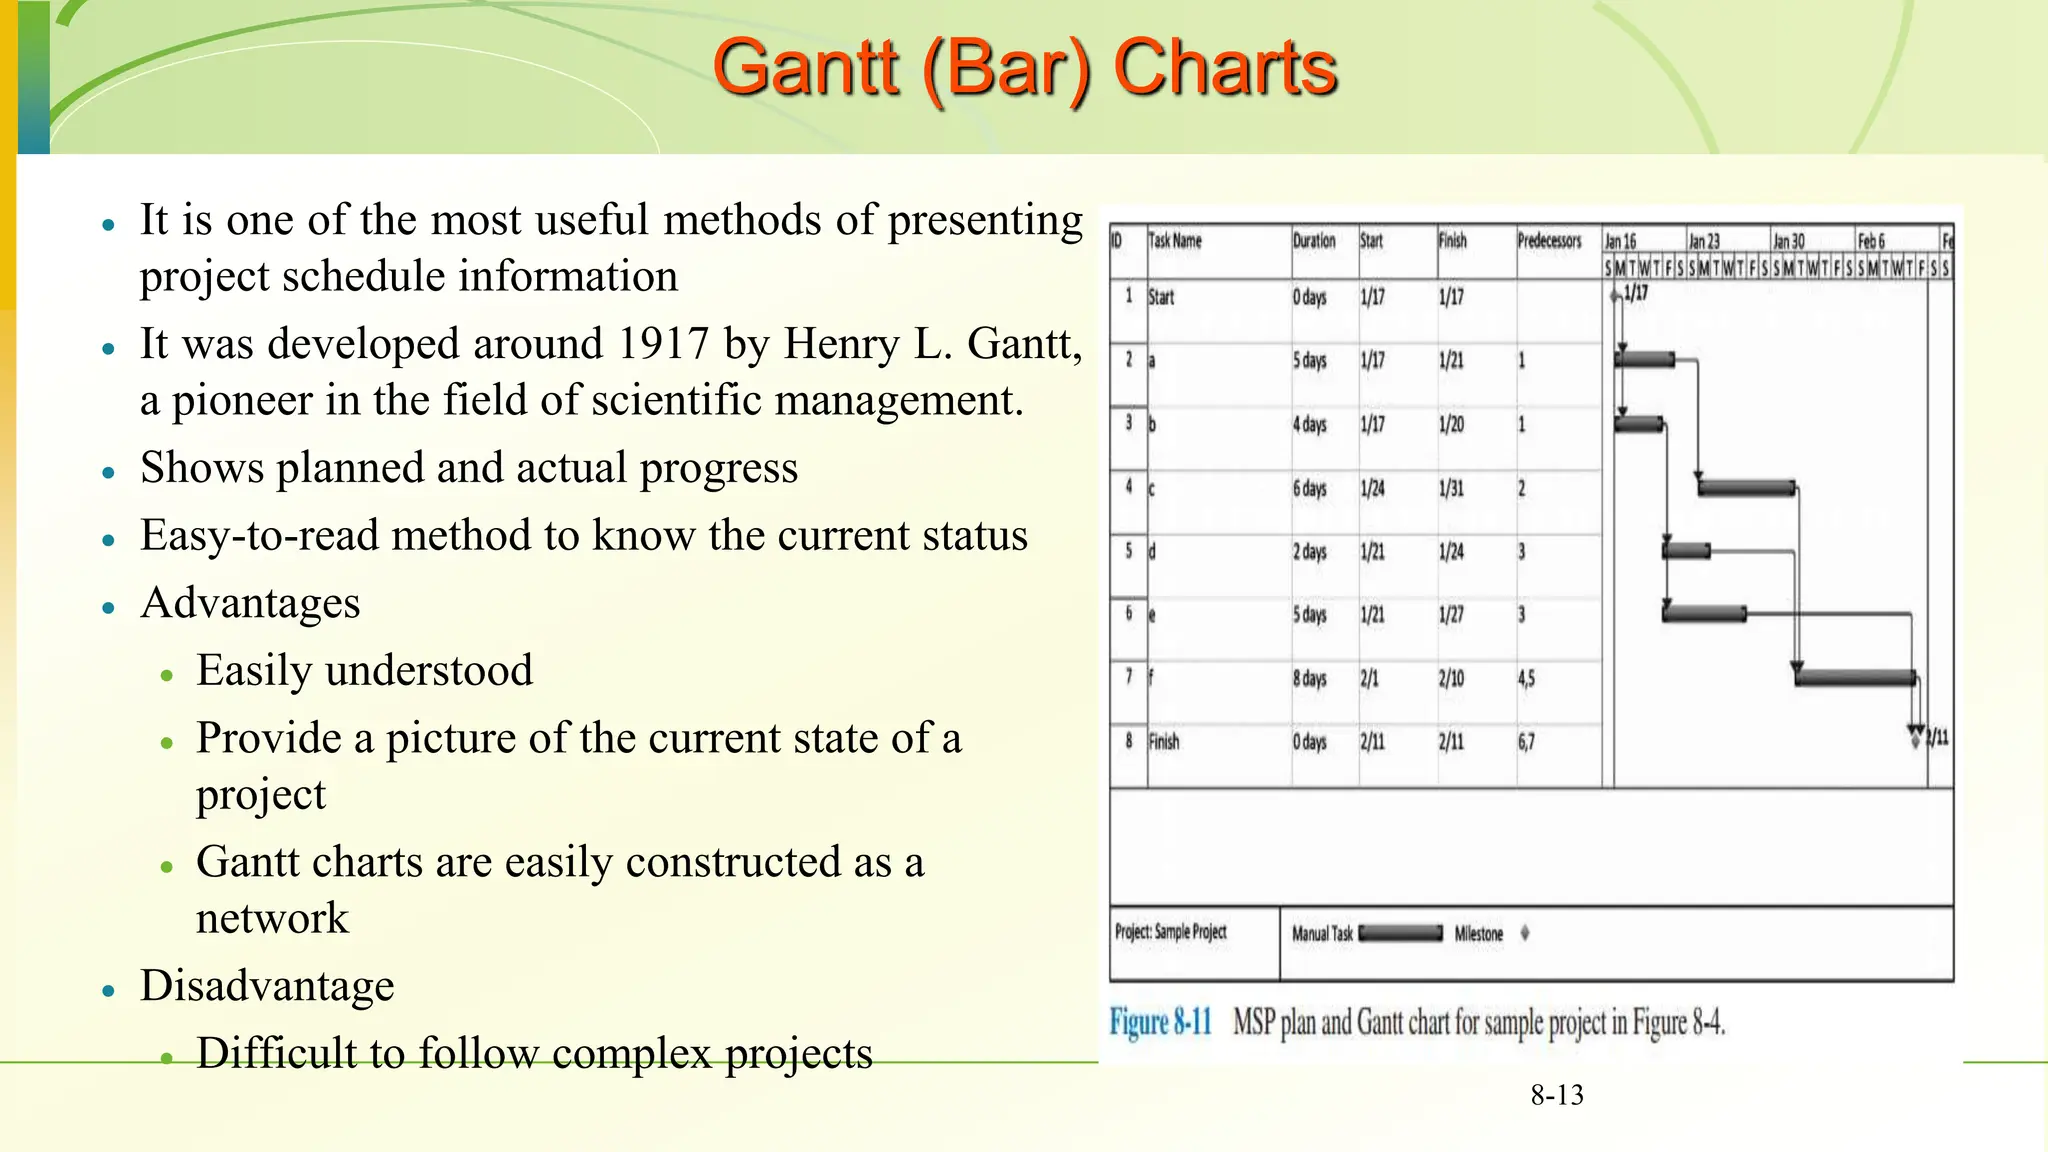
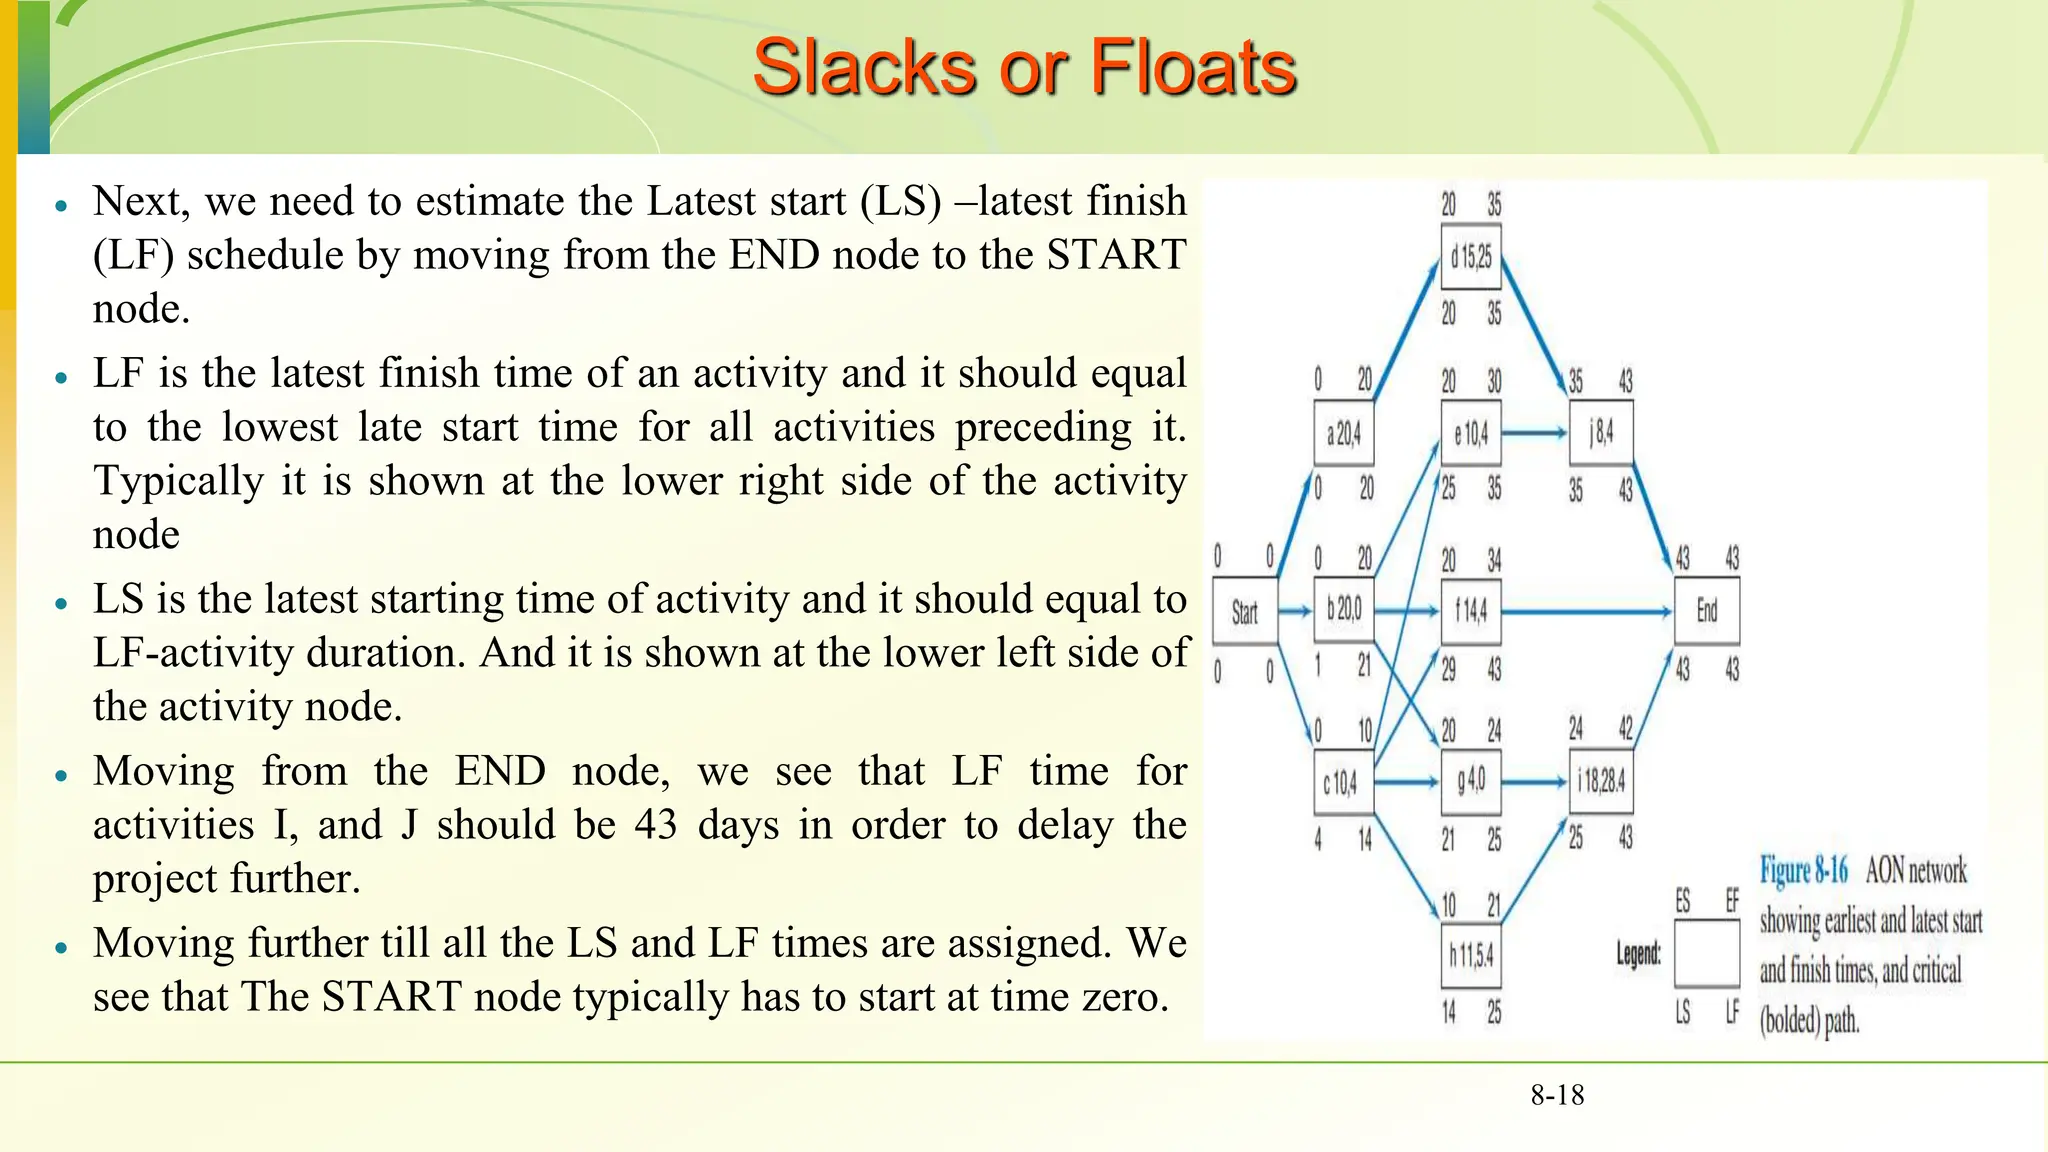
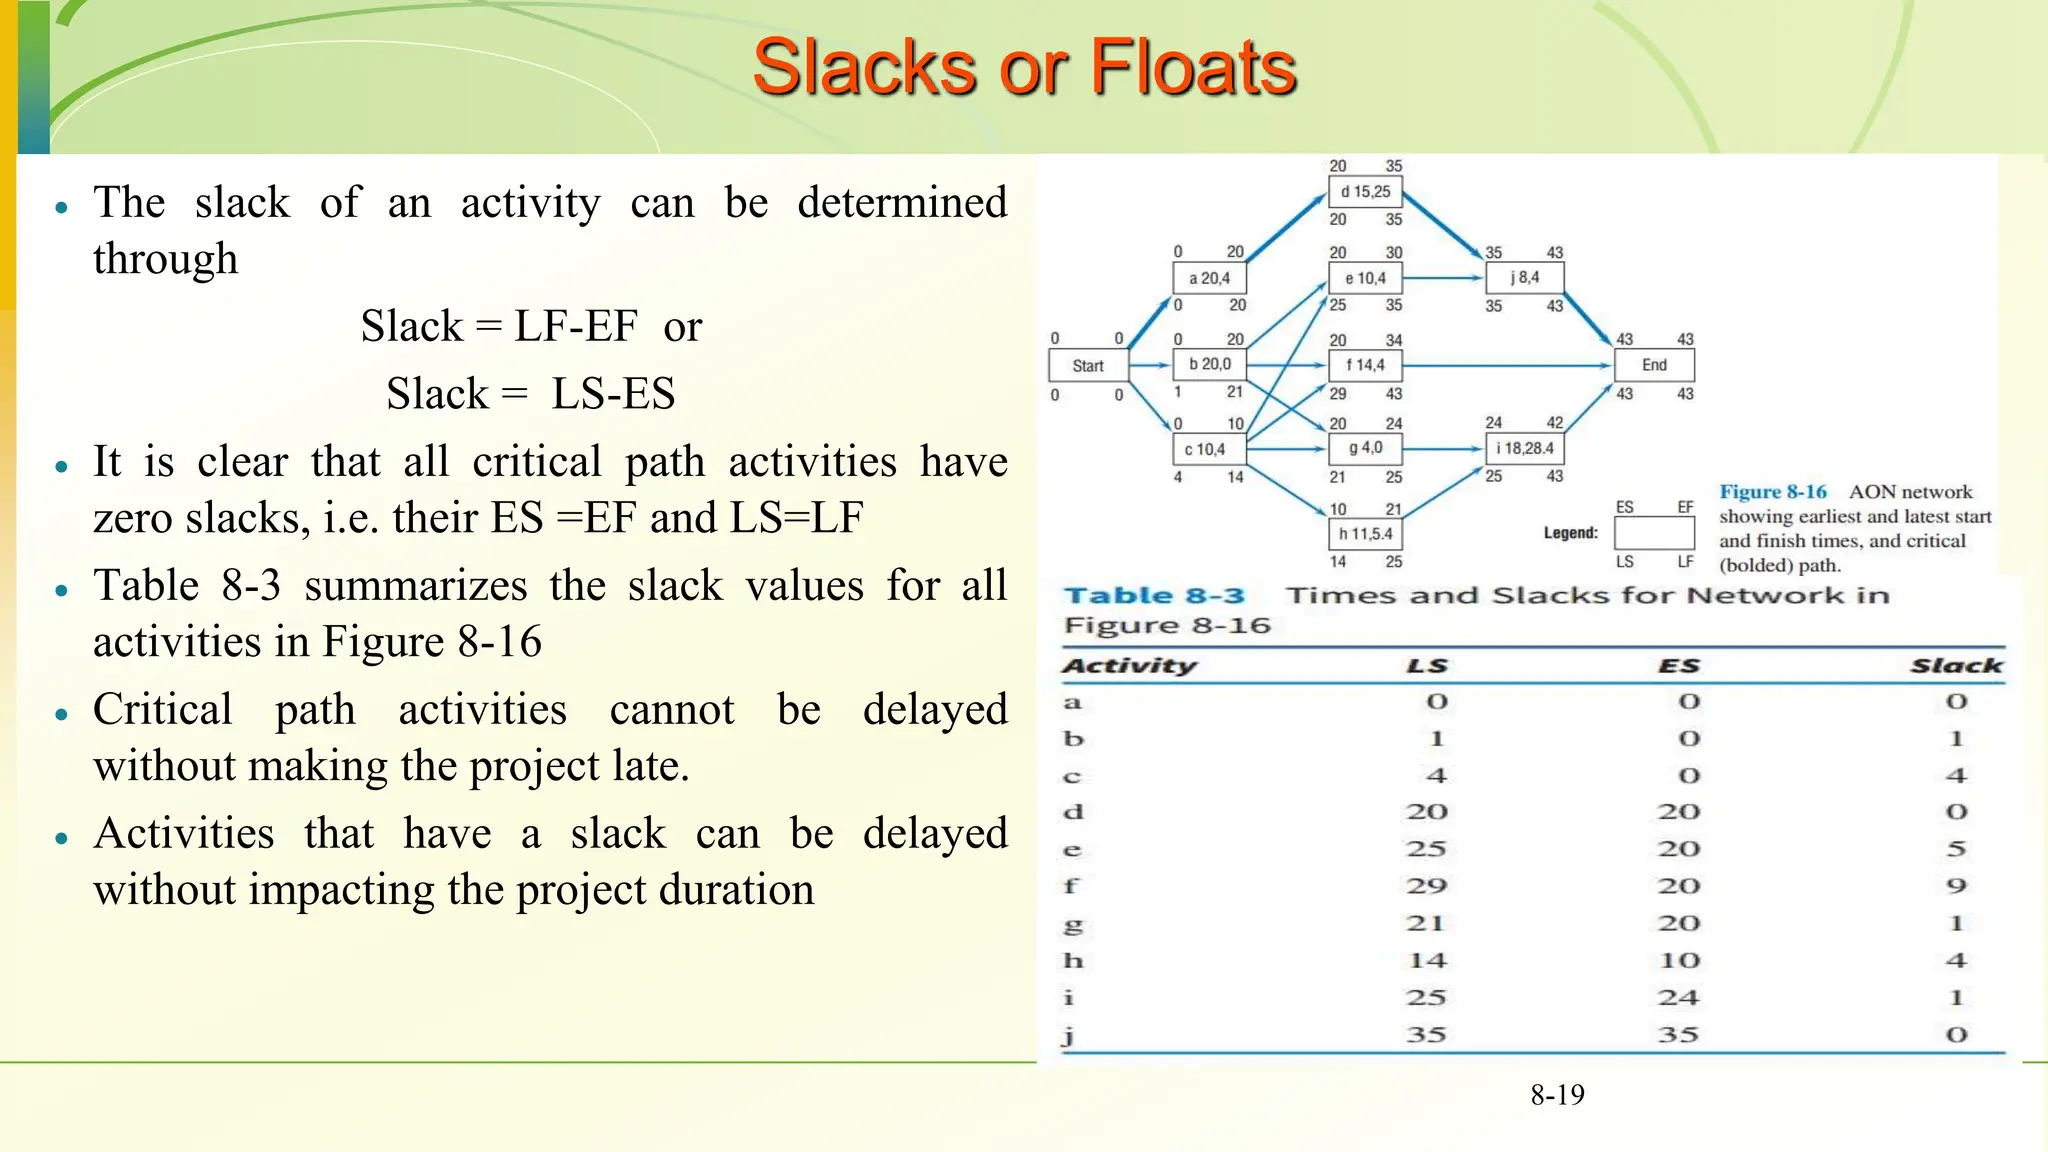
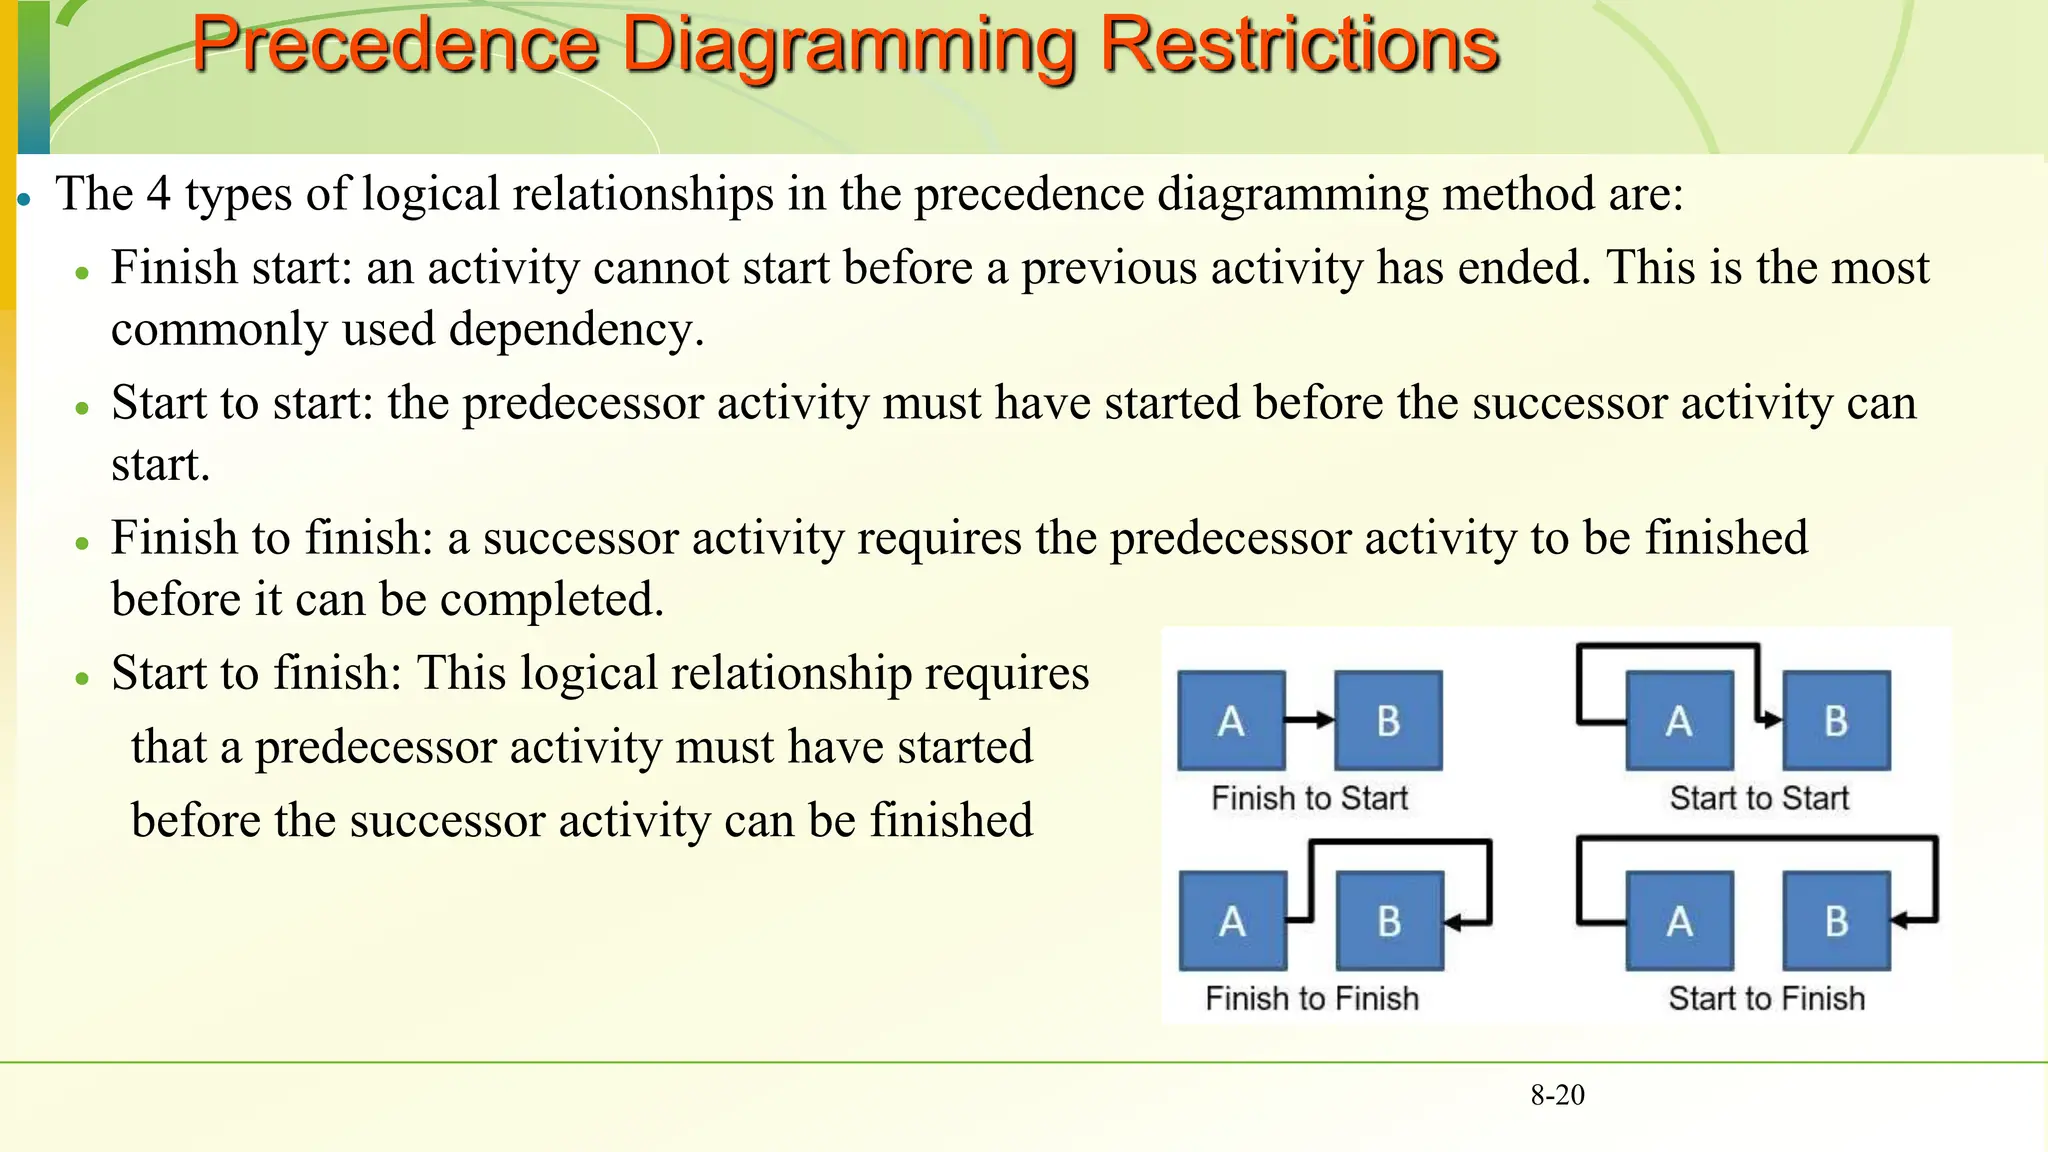
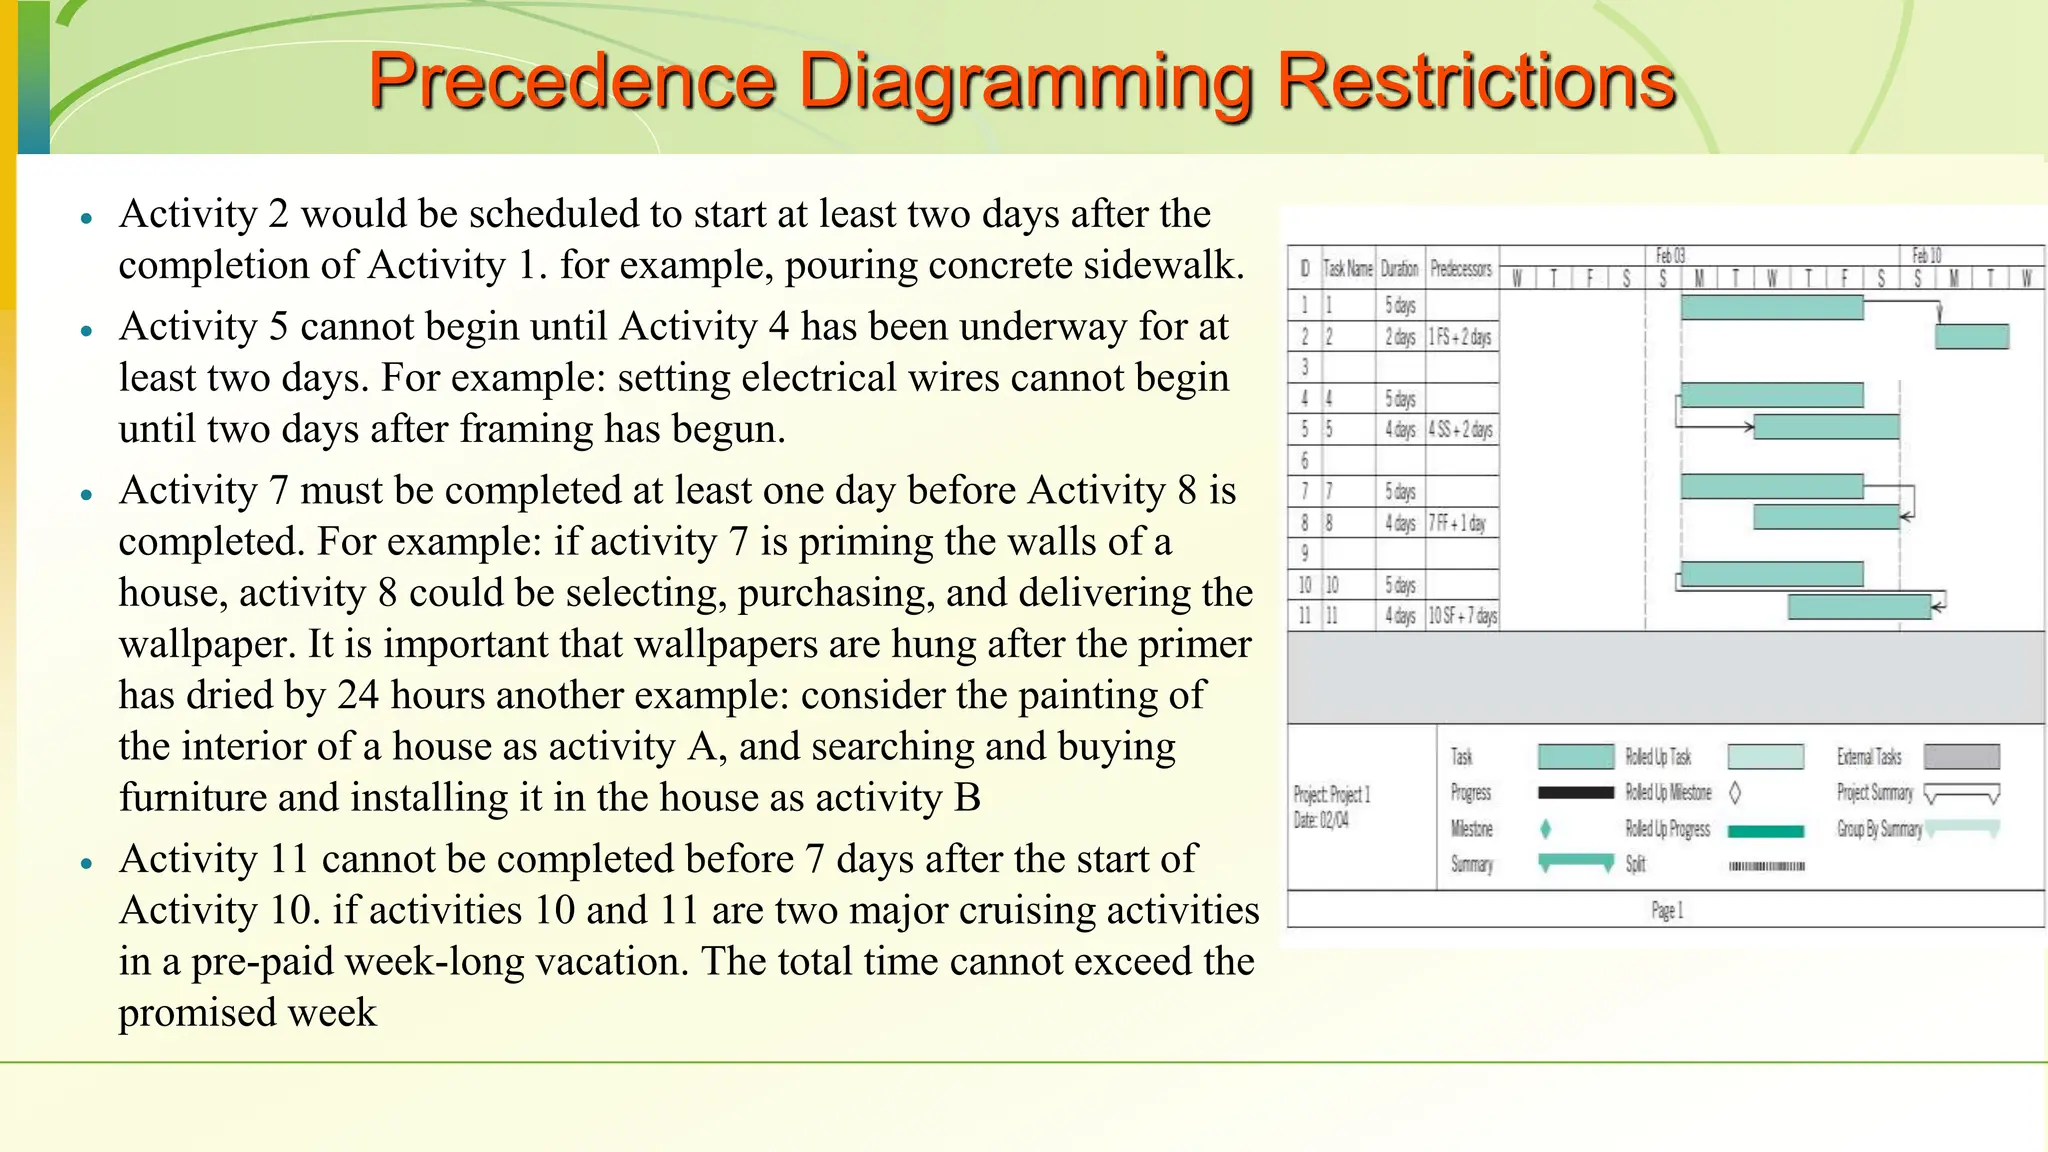
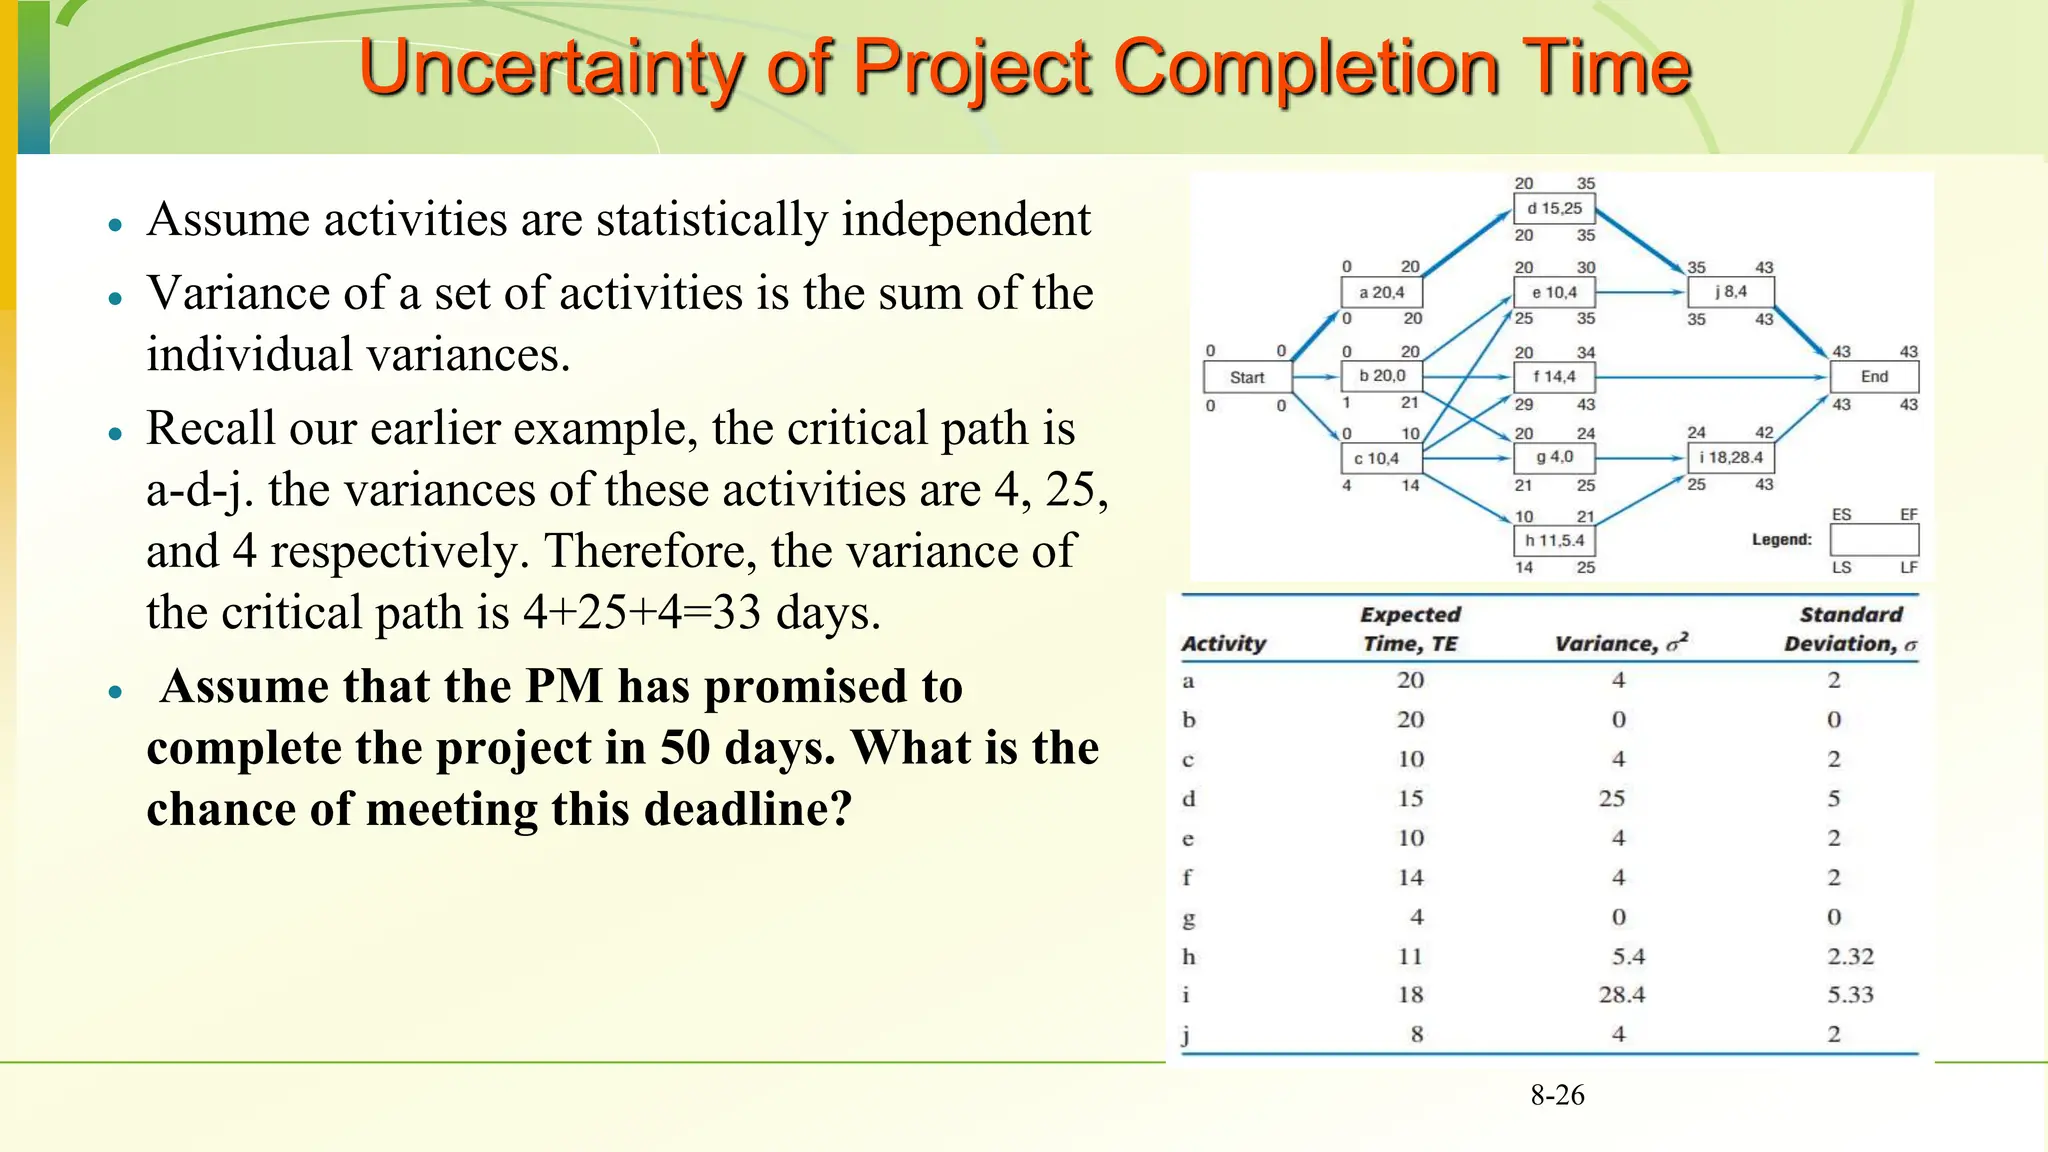
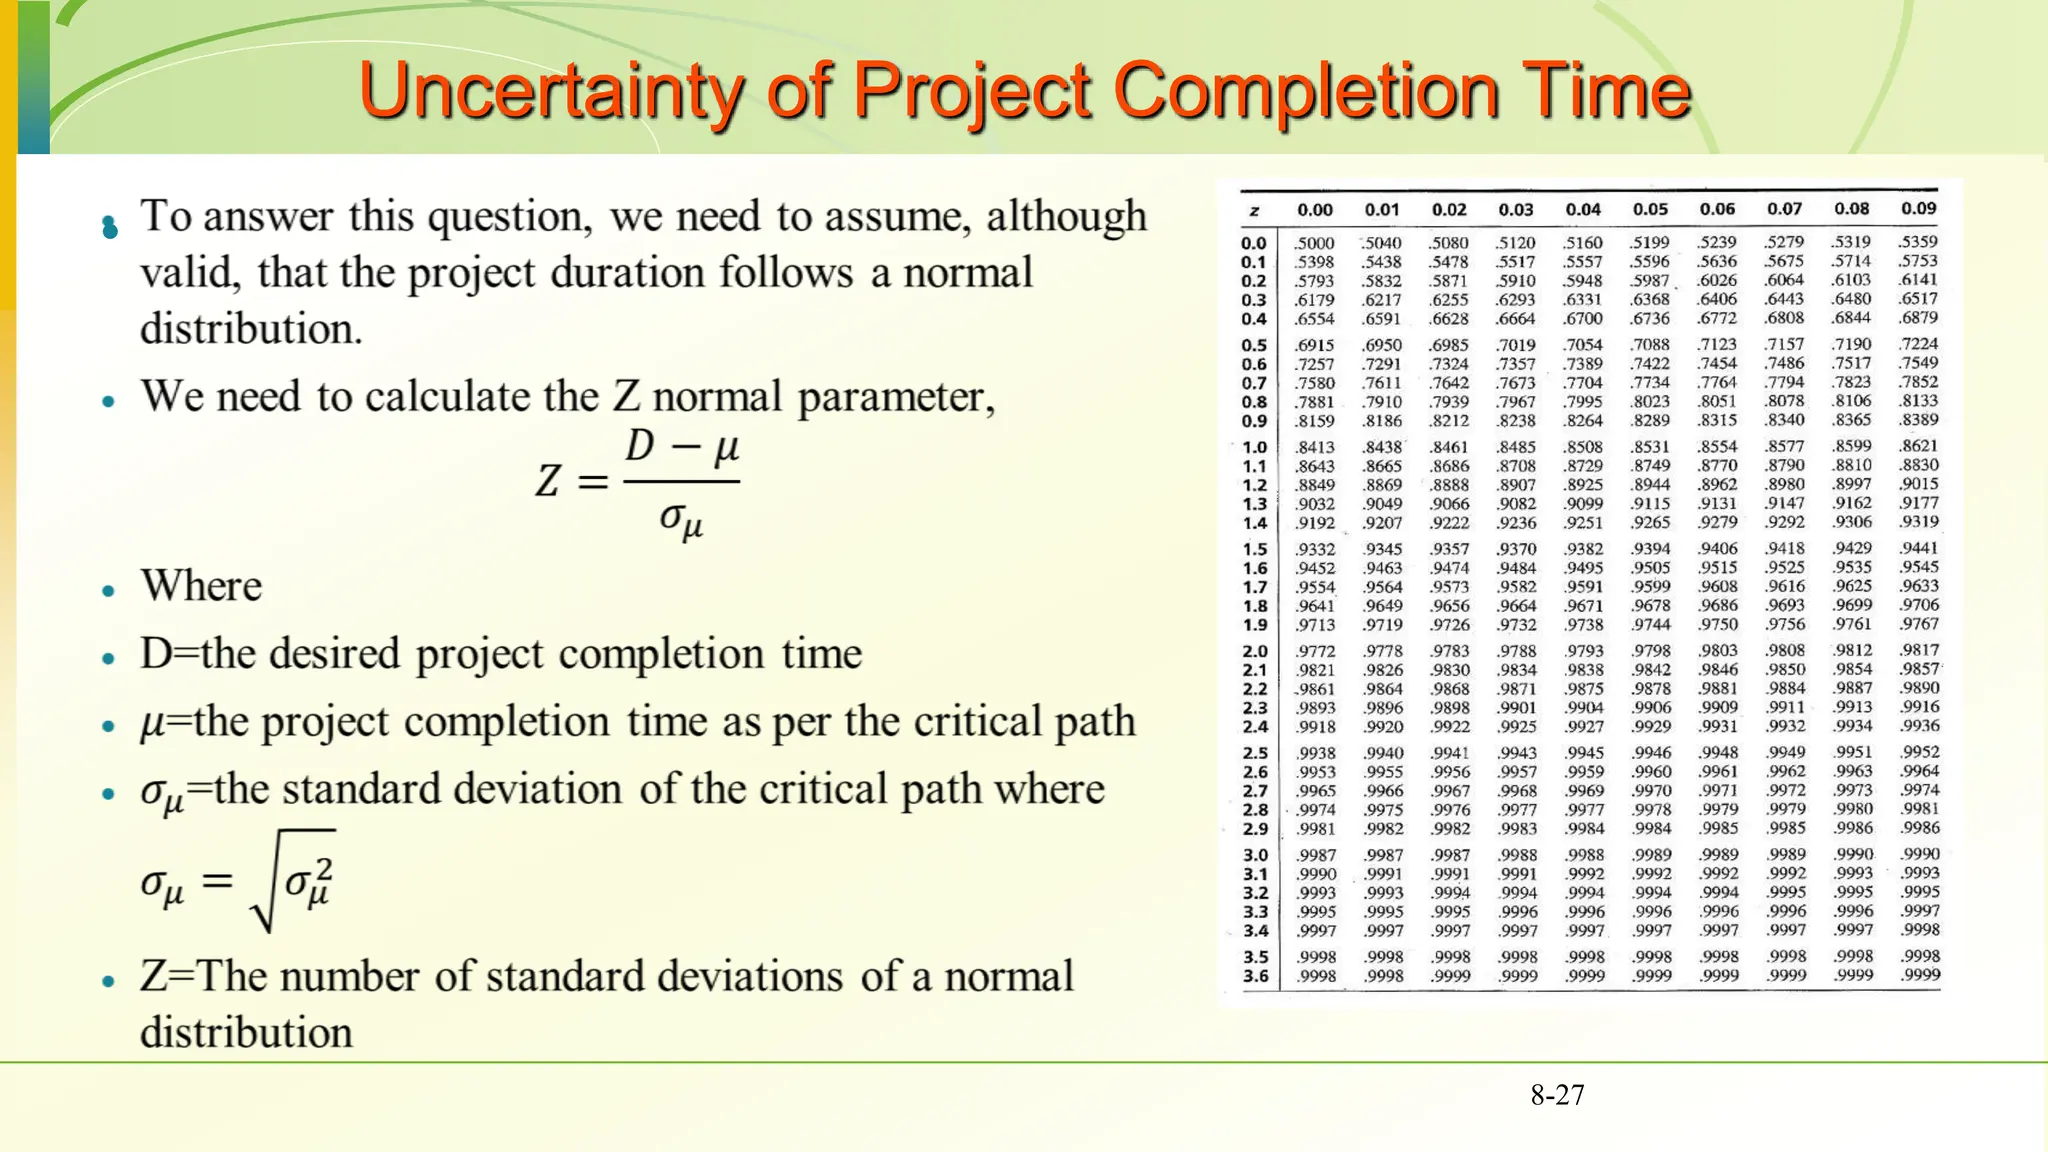
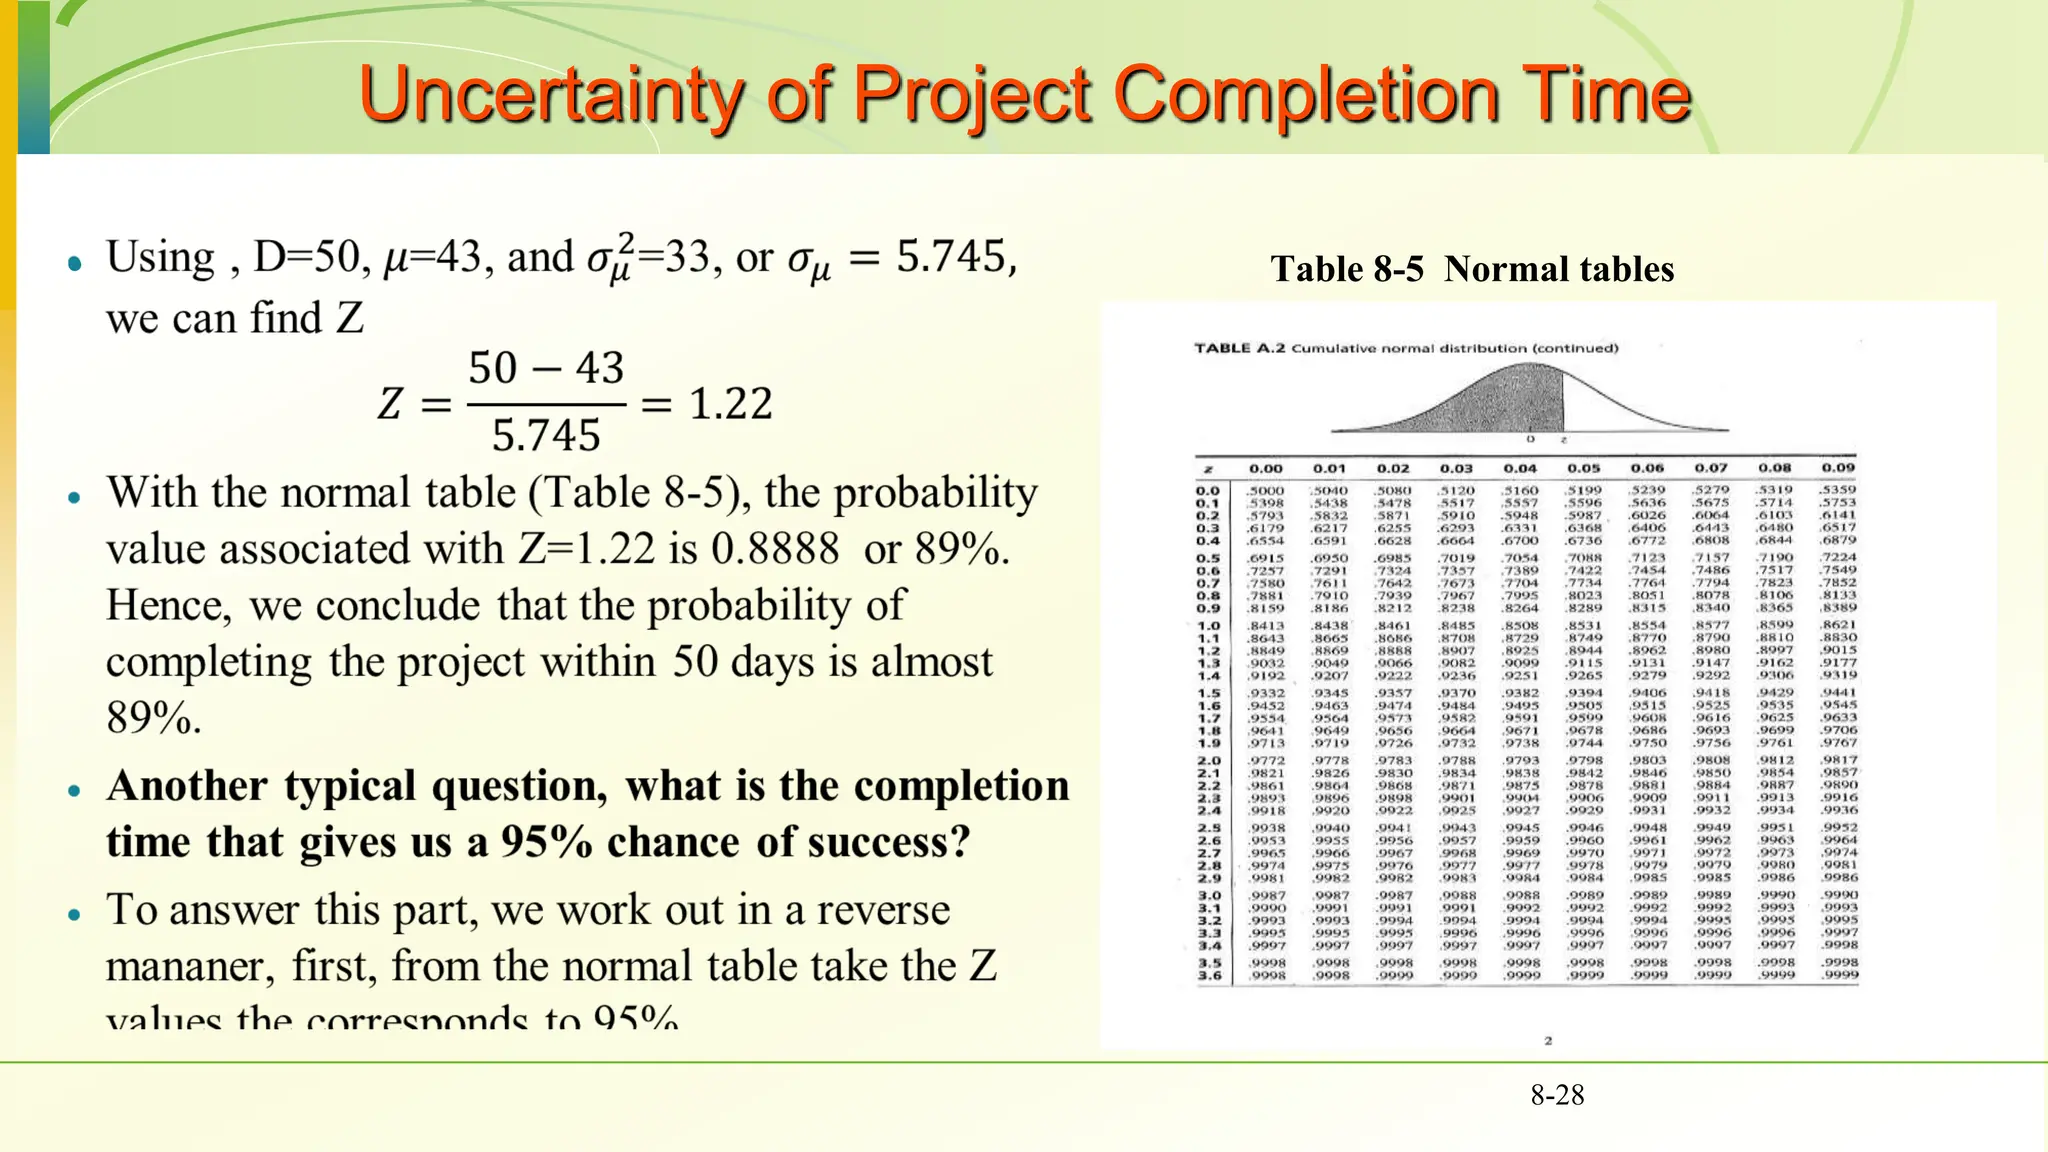
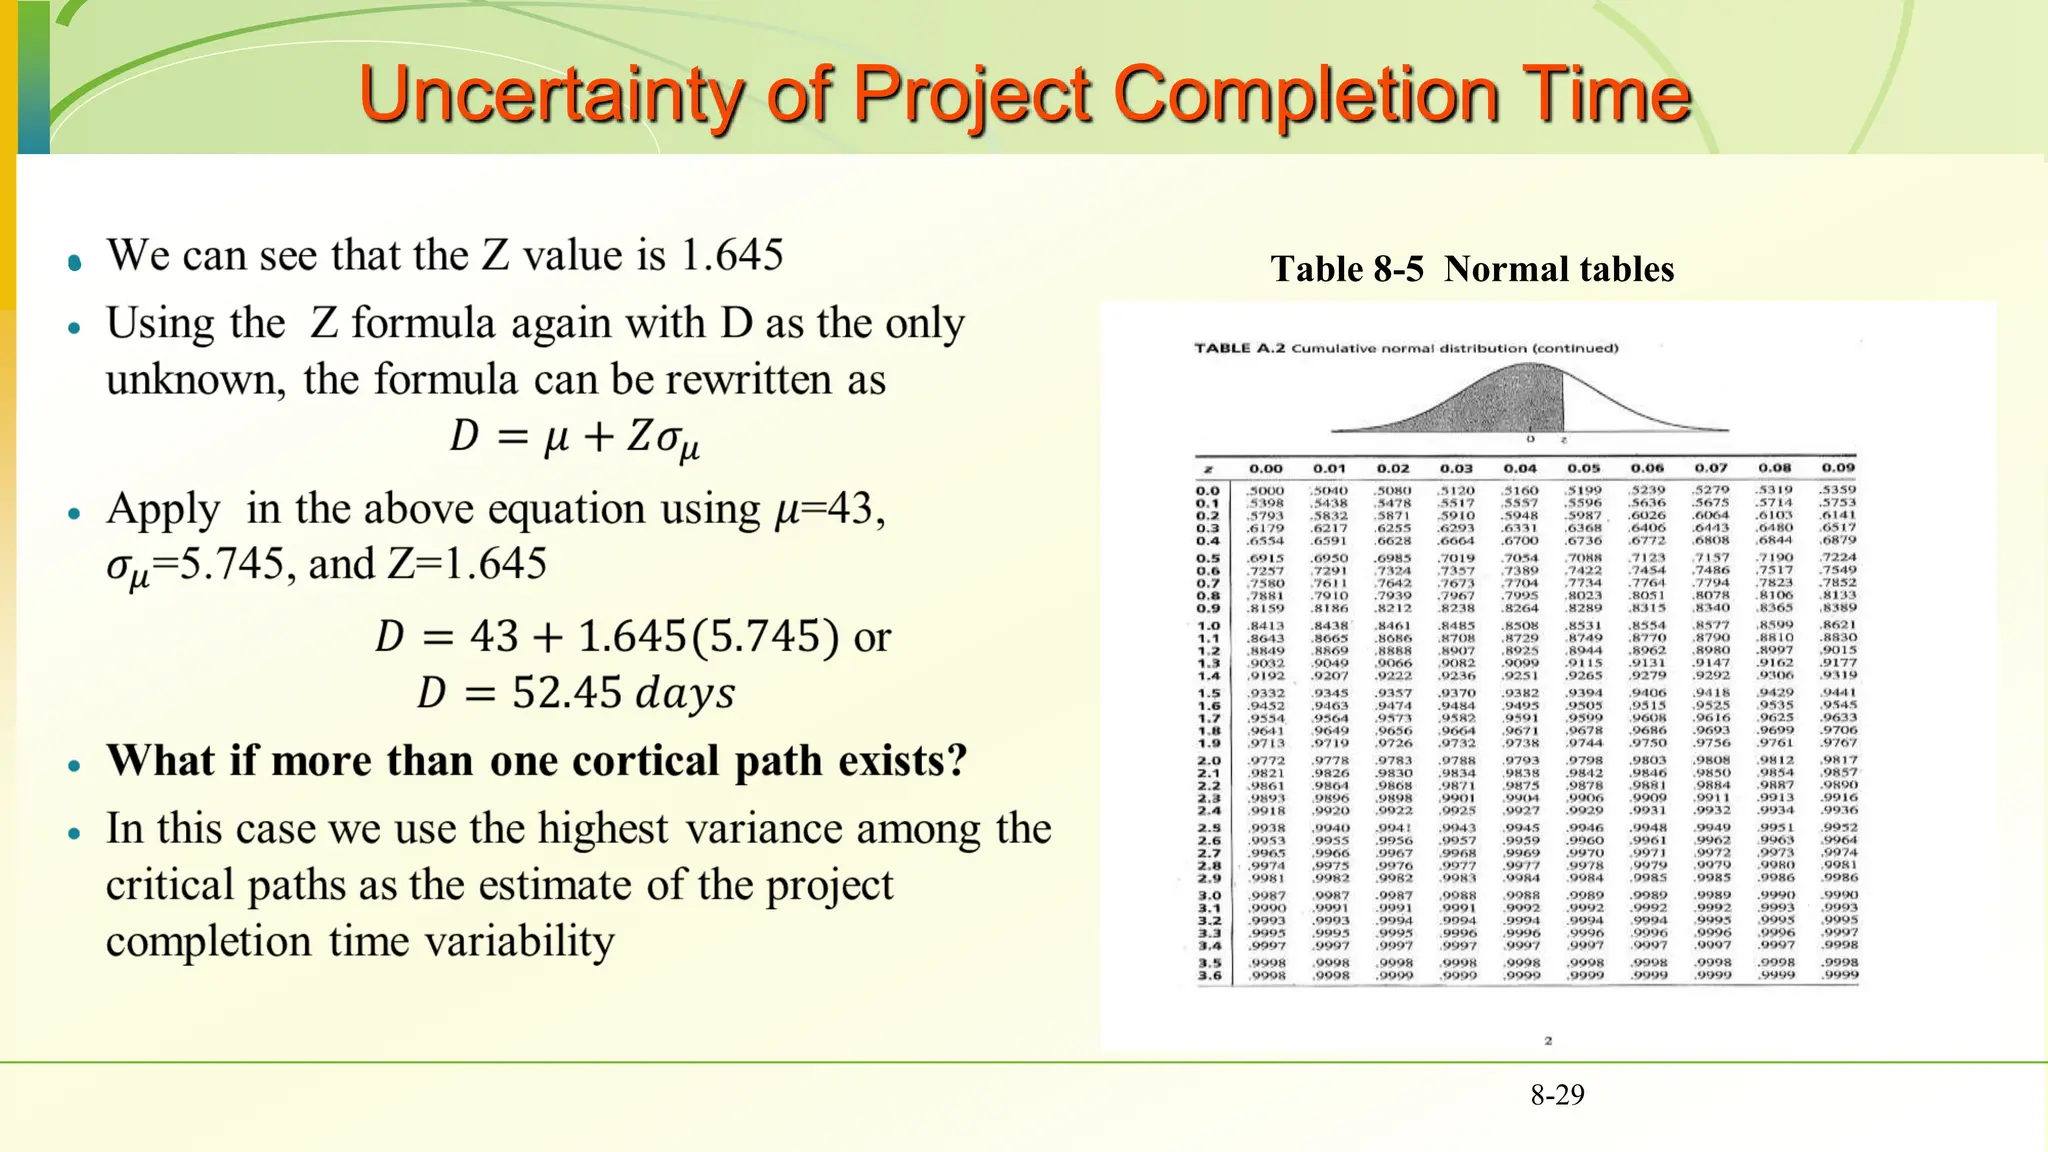
Scheduling
6-1
Chapter 8
6-2
Outline
• Introduction
• Advantages of scheduling
• Scheduling techniques
• PERT and CPM
• Terminologies
• AOA vs AON
• Constructing networks
• Precedence relationships
• Calculating time for activities
• Solving network
• Uncertainty
• Simulation
 Schedule is the conversion of a project action plan (WBS) into an operating
timetable
 Scheduling is one of the major project management tools
 Basis for monitoring a project
 Most of the scheduling is at the WBS level
 Most of the scheduling is based on network drawings
 The basic approach of all scheduling techniques is to form a network of
activity and event relationships between the tasks of the project.
 Tasks that must proceed or follow other tasks are identified in both time
and function
8-3
Introduction
Introduction
 The advantages and benefits of the network
scheduling technique
 Consistent framework
 Shows interdependences
 Shows when resources are needed
 Aids in proper communication
 Determines start dates
 Determines expected completion date
 Identifies critical activities
 Shows which of the activities can be delayed
 Shows which task can be run parallel
 Allows probabilistic estimates
8-4
Network Techniques: PERT and CPM
 The most common techniques to use are
the Critical Path Method (CPM), and the
Program Evaluation and Review
Technique (PERT)
 Both techniques were developed almost
at the same time.
 PERT is oriented to the time element of
the project and used probability estimates
to determine if a project could be
completed at a given time.
 CPM used deterministic time estimates
and is used to control the time and cost
aspects of the project
 In CPM, projects can be expedited by
crashing activity times.
 Both can identify the project’s critical
path with activities that cannot be
delayed and activities with a float or
slack that can be delayed without
affecting project duration.
 Microsoft Project (and others) have
blended CPM and PERT into one approach
8-5
Network Techniques: PERT and CPM
 Terminology
 Activity - A specific task or set of tasks that are required by the project, use up resources and take time to
complete
 Event - The result of completing one or more activities. An identifiable end state that occurs at a particular
time. Events use no resources.
 Network - The combination of all activities and events that define a project
 Drawn from left-to-right
 Connections represent predecessors
 Path - A series of connected activities
 Critical - An activity, event, or path which, if delayed, will delay the completion of the project
 Critical Path - The path through the project where, if any activity is delayed, the project is delayed
 There is always a critical path
 There can be more than one critical path
 Predecessor - That activity that must be completed just before a particular activity can begin
 Successor - Activity following a specific activity
8-6
Network Techniques: PERT and CPM
 Terminology
 An activity can be either in any of these
conditions, starting activity, an ending
activity, or in between. See Fig. 8-1
 When there are multiple activities with
no predecessors they are shown
emanating from a single starting node
“START”. Similarly, when multiple
activities have no successors, they are
connected to an ending node “END”.
Fig 8-2
8-7
Figure 8-2 Activity network, AON format
Network Techniques: PERT and CPM
 Terminology
 There are two formats to use in
building a network
 Activity on Node (AON): where
activities are placed within nodes
 Activity on Arrow (AOA) where
activities are placed on arrows
 Throughout this chapter we follow the
AON format, nevertheless, AOA will
be illustrated.
8-8
Figure 8-2 Activity network, AON format
Figure 8-3 Activity network, AOA format
Network Techniques: PERT and CPM
 Terminology
 All the information we need is
contained in the WBS.
 The WBS shows a list of all
activities, the time for each
activity, resources that will be
used, and the successor–
predecessor relationships between
activities. For example, see
Figure 8-4
8-9
Constructing the Network, AON Version & AOA
 With the WBS (Fig 8-4),
 Begin with the START activity. Activity a
and b have no predecessors, so we draw
arrows out of START to each (AON), or
arrows labeled a and b from the START to
nodes 2, and 3 (AOA). (Figure 8-5 a and b)
 Activity c follows a, and activities d and e
follow b. Now activity f follows both c
and d. (see Fig. 8-6 a)
 For AOA, we draw arrows labeled c, d,
and e following activities a, and b. (see
Fig. 8-6 b)
8-10
Figure 8-5
Sample of a
network
construction
Constructing the Network, AON Version & AOA
 The WBS does not indicate any further
activity is required to complete the task,
so we have reached the End of the plan.
 We thus draw arrows from activities e
and f to the node END, as shown in
Figure 8-7a.
 For AOA, we should have both c and d
terminate at the same node such that
activity f is preceded by both. Finally,
activities e and f are connected to node
5 (the END). Figure 8-7b
8-11
Constructing the Network, AON Version & AOA
 Generally, AON is much simpler and they
are used in most popular computer
software.
 AOA are sometimes harder to draw as they
require the use of dummy activities.
 Dummy activities have zero duration and
use no resources. Its sole purpose is to
indicate the technological relationships.
 Figures 8-10,8-9, and 8-10 shows instances
at which the dummy activity is needed,
and the proper structure of the network
8-12
In our example, a and b
would appear to be the
same, both starting at
node 1 and ending at
node 2.
Activities a, b, and c
must precede activity
d, but only a and b
must precede activity
e.
Figure 8-10 illustrates the
use of dummy activities in
a more complex setting
Gantt (Bar) Charts
 It is one of the most useful methods of presenting
project schedule information
 It was developed around 1917 by Henry L. Gantt,
a pioneer in the field of scientific management.
 Shows planned and actual progress
 Easy-to-read method to know the current status
 Advantages
 Easily understood
 Provide a picture of the current state of a
project
 Gantt charts are easily constructed as a
network
 Disadvantage
 Difficult to follow complex projects
8-13
Gantt (Bar) Charts
 Another advantage is that Gantt charts are easily
constructed as a network
 Figure 8-12 shows the previous example to
construct such a chart.
8-14
Solving the network
 Let us consider a small project with ten
activities (Table 8-1).
 The table shows the optimistic, most likely,
pessimistic completion times for all
activities. In addition to the precedence
relationships among these activities.
 Beginning with the START node, we
connect the activities one by one according
to their precedence relationships. Finally,
the AON network in Figure 8-13 will be
produced for the data in Table 8-1
8-15
Calculating Activity Times

8-16
Critical Path and Time
 Consider again the project shown in Fig. 8-15. For convenience,
assume the time is in days. The first figure is the expected time, and
the second figure is the variance. How long will it take to complete
the project?
 First we need to determine the ES-EF schedule, where
 ES: is the earliest starting time of activity and it can be determined to
be equal to the latest early finish (EF) time leading to that activity.
The ES value is shown on the top left of the activity node.
 EF: the earliest finish time of an activity and is always equal to the
ES time + activity duration and is shown at the top right.
 Moving from left to right, and starting at time zero, we assign the
values of the ES-EF at the top of each node.
 Note activities Start and END have no durations, therefore their
ES=EF.
 After adding the ES-EF times to the network, we can see that the
project should end within 43 days
 The critical path is the longest path from START to END and is easy
to see that it passes over a-d-j 8-17
Slacks or Floats
 Next, we need to estimate the Latest start (LS) –latest finish
(LF) schedule by moving from the END node to the START
node.
 LF is the latest finish time of an activity and it should equal
to the lowest late start time for all activities preceding it.
Typically it is shown at the lower right side of the activity
node
 LS is the latest starting time of activity and it should equal to
LF-activity duration. And it is shown at the lower left side of
the activity node.
 Moving from the END node, we see that LF time for
activities I, and J should be 43 days in order to delay the
project further.
 Moving further till all the LS and LF times are assigned. We
see that The START node typically has to start at time zero.
8-18
Slacks or Floats
 The slack of an activity can be determined
through
Slack = LF-EF or
Slack = LS-ES
 It is clear that all critical path activities have
zero slacks, i.e. their ES =EF and LS=LF
 Table 8-3 summarizes the slack values for all
activities in Figure 8-16
 Critical path activities cannot be delayed
without making the project late.
 Activities that have a slack can be delayed
without impacting the project duration
8-19
Precedence Diagramming Restrictions
 The 4 types of logical relationships in the precedence diagramming method are:
 Finish start: an activity cannot start before a previous activity has ended. This is the most
commonly used dependency.
 Start to start: the predecessor activity must have started before the successor activity can
start.
 Finish to finish: a successor activity requires the predecessor activity to be finished
before it can be completed.
 Start to finish: This logical relationship requires
that a predecessor activity must have started
before the successor activity can be finished
8-20
Precedence Diagramming Restrictions
 Activity 2 would be scheduled to start at least two days after the
completion of Activity 1. for example, pouring concrete sidewalk.
 Activity 5 cannot begin until Activity 4 has been underway for at
least two days. For example: setting electrical wires cannot begin
until two days after framing has begun.
 Activity 7 must be completed at least one day before Activity 8 is
completed. For example: if activity 7 is priming the walls of a
house, activity 8 could be selecting, purchasing, and delivering the
wallpaper. It is important that wallpapers are hung after the primer
has dried by 24 hours another example: consider the painting of
the interior of a house as activity A, and searching and buying
furniture and installing it in the house as activity B
 Activity 11 cannot be completed before 7 days after the start of
Activity 10. if activities 10 and 11 are two major cruising activities
in a pre-paid week-long vacation. The total time cannot exceed the
promised week
Class practice (Problem 12 page 307)
8-22
The Denver Iron & Steel Company is expanding its operations to
include a new drive-in weigh station. The weigh station will be a
heated/air-conditioned building with a large floor and a small office.
The large room will have the scales, a 15-foot counter, and several
display cases for its equipment. Before the erection of the building,
the PM evaluated the project using AON analysis. The activities with
their corresponding times were recorded in Table A. Using AON
analysis, find the path with the longest expected duration, the slack
times, and the expected completion time.
Class practice
8-23
Table A
Class practice (cont.)
8-24
Activity a m b Expected
1 8 10 13 10.2
2 5 6 8 6.2
3 13 15 21 15.7
4 10 12 14 12.0
5 11 20 30 20.2
6 4 5 8 5.3
7 2 3 4 3.0
8 4 6 10 6.3
9 2 3 4 3.0
S,0
Act.,Dur
.
0
ES EF
LS LF
Float
0
0
0
0
1,10.2
0 10.2
11.7
11.7
21.9
2,6.2
0 6.2
0
0
6.2
3,15.7
6.2 21.9
6.2
0
21.9
4,12
21.9 33.9
21.9
0
33.9
5,20.2
33.9 54.1
33.9
0
54.1
6,5.3
54.1 59.4
58.1
4
63.4
7,3.0
54.1 57.1
54.1
0
57.1
8,6.3
57.1 63.4
57.1
0
63.4
9,3.0
63.4 66.4
63.4
0
66.4
Uncertainty of Project Completion Time
 Assume activities are statistically independent
 Variance of a set of activities is the sum of the
individual variances.
 Recall our earlier example, the critical path is
a-d-j. the variances of these activities are 4, 25,
and 4 respectively. Therefore, the variance of
the critical path is 4+25+4=33 days.
 Assume that the PM has promised to
complete the project in 50 days. What is the
chance of meeting this deadline?
8-26

8-27
Uncertainty of Project Completion Time
 Table 8-5 Normal tables
8-28
Uncertainty of Project Completion Time
 Table 8-5 Normal tables
8-29
Toward Realistic Time Estimates
 
8-30
Toward Realistic Time Estimates
 
8-31
Risk Analysis Using Simulation with Crystal Ball
 We will use simulation in
scheduling projects
 Recall the project in Table 8-1
 The network of that project is
shown in Fig. 8-13
8-32
Risk Analysis Using Simulation with Crystal Ball
 In Cells A3 through J3 enter the expected
time for the activity duration
 In the shaded cells define a BetaPERT
distribution according to the three-time
estimates in Table 8-1
 In cells K3 through R3 define the project
completion time as per the path used.
 In defining the project completion time, we
use the activity TEs and the project
completion time is the sum of the activity
Tes over that path
 Note that there are eight paths to follow
from start to end
Fig. 8-27 shows a model for simulating the project
8-33
Risk Analysis Using Simulation with Crystal Ball
 Now enter the formula that
calculates the project duration in
cell S3.
 The formula will select the path
with the longest duration.
 Select S3 as your Forecast output
and start the simulation
Fig. 8-27 shows a model for simulating the project
8-34
Risk Analysis Using Simulation with Crystal Ball
 Fig. 8-28 shows the simulation output
 If you wish to find the likelihood of
finishing the project in 52 days, enter the
number 52 in the box “+ infinity” and then
press enter. The probability you seek will
show up in the Certainty cell (see Fig. 8-20)
 Other questions such as “What is the
duration required if we want to be 90%
sure?”, are also applicable using the
simulation
8-35
Risk Analysis Using Simulation with Crystal Ball
 Simulation can provide more information about the
project completion time
 Figures 8-30, and 8-31 provide statistical
information about the distribution shown in Fig. 8-
28
 The mean of the completion time is 47.8 days and
the median is 47.6 days.
 Recall that the expected completion time over the
critical path was 43 days.
 The difference between the two means is due to
possible path mergers. The probability of path
mergers is not possible to account for through
regular spreadsheets. But it can be handled easily
through simulation
8-36
Final note: Projects are dynamic
 Project activities are most of the time uncertain.
 In reality, rarely project duration is equal to most
likely.
 Floats calculated initially are bound to change
throughout the project.
 Critical paths are also expected to change many time.
 Repeated simulations are advised at various stages of
project once we have more information about our
project.
8-37
Problem 4 page 306
 4. Given the following diagram,
find:
 a. The critical path.
 b. How long it will take to complete the
project?
 c. The ES, LS, EF, and LF for each
activity.
 d. The slack for each activity.
Problem 4 page 306
 4. Solution:-
a. The critical Path is B-E-G
b. The project duration is 23 days
c. The ES, SF, LS, and LF schedules
are shown in the figure to the right.
d. The slacks for A=1, C=5, D=1,and
F=5
(10,15)
(7,18)
(7,18)
(15,20)

ch08 (1).pptttttttttttttttþtttttttttttttt

  • 1.
  • 2.
    6-2 Outline • Introduction • Advantagesof scheduling • Scheduling techniques • PERT and CPM • Terminologies • AOA vs AON • Constructing networks • Precedence relationships • Calculating time for activities • Solving network • Uncertainty • Simulation
  • 3.
     Schedule isthe conversion of a project action plan (WBS) into an operating timetable  Scheduling is one of the major project management tools  Basis for monitoring a project  Most of the scheduling is at the WBS level  Most of the scheduling is based on network drawings  The basic approach of all scheduling techniques is to form a network of activity and event relationships between the tasks of the project.  Tasks that must proceed or follow other tasks are identified in both time and function 8-3 Introduction
  • 4.
    Introduction  The advantagesand benefits of the network scheduling technique  Consistent framework  Shows interdependences  Shows when resources are needed  Aids in proper communication  Determines start dates  Determines expected completion date  Identifies critical activities  Shows which of the activities can be delayed  Shows which task can be run parallel  Allows probabilistic estimates 8-4
  • 5.
    Network Techniques: PERTand CPM  The most common techniques to use are the Critical Path Method (CPM), and the Program Evaluation and Review Technique (PERT)  Both techniques were developed almost at the same time.  PERT is oriented to the time element of the project and used probability estimates to determine if a project could be completed at a given time.  CPM used deterministic time estimates and is used to control the time and cost aspects of the project  In CPM, projects can be expedited by crashing activity times.  Both can identify the project’s critical path with activities that cannot be delayed and activities with a float or slack that can be delayed without affecting project duration.  Microsoft Project (and others) have blended CPM and PERT into one approach 8-5
  • 6.
    Network Techniques: PERTand CPM  Terminology  Activity - A specific task or set of tasks that are required by the project, use up resources and take time to complete  Event - The result of completing one or more activities. An identifiable end state that occurs at a particular time. Events use no resources.  Network - The combination of all activities and events that define a project  Drawn from left-to-right  Connections represent predecessors  Path - A series of connected activities  Critical - An activity, event, or path which, if delayed, will delay the completion of the project  Critical Path - The path through the project where, if any activity is delayed, the project is delayed  There is always a critical path  There can be more than one critical path  Predecessor - That activity that must be completed just before a particular activity can begin  Successor - Activity following a specific activity 8-6
  • 7.
    Network Techniques: PERTand CPM  Terminology  An activity can be either in any of these conditions, starting activity, an ending activity, or in between. See Fig. 8-1  When there are multiple activities with no predecessors they are shown emanating from a single starting node “START”. Similarly, when multiple activities have no successors, they are connected to an ending node “END”. Fig 8-2 8-7 Figure 8-2 Activity network, AON format
  • 8.
    Network Techniques: PERTand CPM  Terminology  There are two formats to use in building a network  Activity on Node (AON): where activities are placed within nodes  Activity on Arrow (AOA) where activities are placed on arrows  Throughout this chapter we follow the AON format, nevertheless, AOA will be illustrated. 8-8 Figure 8-2 Activity network, AON format Figure 8-3 Activity network, AOA format
  • 9.
    Network Techniques: PERTand CPM  Terminology  All the information we need is contained in the WBS.  The WBS shows a list of all activities, the time for each activity, resources that will be used, and the successor– predecessor relationships between activities. For example, see Figure 8-4 8-9
  • 10.
    Constructing the Network,AON Version & AOA  With the WBS (Fig 8-4),  Begin with the START activity. Activity a and b have no predecessors, so we draw arrows out of START to each (AON), or arrows labeled a and b from the START to nodes 2, and 3 (AOA). (Figure 8-5 a and b)  Activity c follows a, and activities d and e follow b. Now activity f follows both c and d. (see Fig. 8-6 a)  For AOA, we draw arrows labeled c, d, and e following activities a, and b. (see Fig. 8-6 b) 8-10 Figure 8-5 Sample of a network construction
  • 11.
    Constructing the Network,AON Version & AOA  The WBS does not indicate any further activity is required to complete the task, so we have reached the End of the plan.  We thus draw arrows from activities e and f to the node END, as shown in Figure 8-7a.  For AOA, we should have both c and d terminate at the same node such that activity f is preceded by both. Finally, activities e and f are connected to node 5 (the END). Figure 8-7b 8-11
  • 12.
    Constructing the Network,AON Version & AOA  Generally, AON is much simpler and they are used in most popular computer software.  AOA are sometimes harder to draw as they require the use of dummy activities.  Dummy activities have zero duration and use no resources. Its sole purpose is to indicate the technological relationships.  Figures 8-10,8-9, and 8-10 shows instances at which the dummy activity is needed, and the proper structure of the network 8-12 In our example, a and b would appear to be the same, both starting at node 1 and ending at node 2. Activities a, b, and c must precede activity d, but only a and b must precede activity e. Figure 8-10 illustrates the use of dummy activities in a more complex setting
  • 13.
    Gantt (Bar) Charts It is one of the most useful methods of presenting project schedule information  It was developed around 1917 by Henry L. Gantt, a pioneer in the field of scientific management.  Shows planned and actual progress  Easy-to-read method to know the current status  Advantages  Easily understood  Provide a picture of the current state of a project  Gantt charts are easily constructed as a network  Disadvantage  Difficult to follow complex projects 8-13
  • 14.
    Gantt (Bar) Charts Another advantage is that Gantt charts are easily constructed as a network  Figure 8-12 shows the previous example to construct such a chart. 8-14
  • 15.
    Solving the network Let us consider a small project with ten activities (Table 8-1).  The table shows the optimistic, most likely, pessimistic completion times for all activities. In addition to the precedence relationships among these activities.  Beginning with the START node, we connect the activities one by one according to their precedence relationships. Finally, the AON network in Figure 8-13 will be produced for the data in Table 8-1 8-15
  • 16.
  • 17.
    Critical Path andTime  Consider again the project shown in Fig. 8-15. For convenience, assume the time is in days. The first figure is the expected time, and the second figure is the variance. How long will it take to complete the project?  First we need to determine the ES-EF schedule, where  ES: is the earliest starting time of activity and it can be determined to be equal to the latest early finish (EF) time leading to that activity. The ES value is shown on the top left of the activity node.  EF: the earliest finish time of an activity and is always equal to the ES time + activity duration and is shown at the top right.  Moving from left to right, and starting at time zero, we assign the values of the ES-EF at the top of each node.  Note activities Start and END have no durations, therefore their ES=EF.  After adding the ES-EF times to the network, we can see that the project should end within 43 days  The critical path is the longest path from START to END and is easy to see that it passes over a-d-j 8-17
  • 18.
    Slacks or Floats Next, we need to estimate the Latest start (LS) –latest finish (LF) schedule by moving from the END node to the START node.  LF is the latest finish time of an activity and it should equal to the lowest late start time for all activities preceding it. Typically it is shown at the lower right side of the activity node  LS is the latest starting time of activity and it should equal to LF-activity duration. And it is shown at the lower left side of the activity node.  Moving from the END node, we see that LF time for activities I, and J should be 43 days in order to delay the project further.  Moving further till all the LS and LF times are assigned. We see that The START node typically has to start at time zero. 8-18
  • 19.
    Slacks or Floats The slack of an activity can be determined through Slack = LF-EF or Slack = LS-ES  It is clear that all critical path activities have zero slacks, i.e. their ES =EF and LS=LF  Table 8-3 summarizes the slack values for all activities in Figure 8-16  Critical path activities cannot be delayed without making the project late.  Activities that have a slack can be delayed without impacting the project duration 8-19
  • 20.
    Precedence Diagramming Restrictions The 4 types of logical relationships in the precedence diagramming method are:  Finish start: an activity cannot start before a previous activity has ended. This is the most commonly used dependency.  Start to start: the predecessor activity must have started before the successor activity can start.  Finish to finish: a successor activity requires the predecessor activity to be finished before it can be completed.  Start to finish: This logical relationship requires that a predecessor activity must have started before the successor activity can be finished 8-20
  • 21.
    Precedence Diagramming Restrictions Activity 2 would be scheduled to start at least two days after the completion of Activity 1. for example, pouring concrete sidewalk.  Activity 5 cannot begin until Activity 4 has been underway for at least two days. For example: setting electrical wires cannot begin until two days after framing has begun.  Activity 7 must be completed at least one day before Activity 8 is completed. For example: if activity 7 is priming the walls of a house, activity 8 could be selecting, purchasing, and delivering the wallpaper. It is important that wallpapers are hung after the primer has dried by 24 hours another example: consider the painting of the interior of a house as activity A, and searching and buying furniture and installing it in the house as activity B  Activity 11 cannot be completed before 7 days after the start of Activity 10. if activities 10 and 11 are two major cruising activities in a pre-paid week-long vacation. The total time cannot exceed the promised week
  • 22.
    Class practice (Problem12 page 307) 8-22 The Denver Iron & Steel Company is expanding its operations to include a new drive-in weigh station. The weigh station will be a heated/air-conditioned building with a large floor and a small office. The large room will have the scales, a 15-foot counter, and several display cases for its equipment. Before the erection of the building, the PM evaluated the project using AON analysis. The activities with their corresponding times were recorded in Table A. Using AON analysis, find the path with the longest expected duration, the slack times, and the expected completion time.
  • 23.
  • 24.
    Class practice (cont.) 8-24 Activitya m b Expected 1 8 10 13 10.2 2 5 6 8 6.2 3 13 15 21 15.7 4 10 12 14 12.0 5 11 20 30 20.2 6 4 5 8 5.3 7 2 3 4 3.0 8 4 6 10 6.3 9 2 3 4 3.0
  • 25.
    S,0 Act.,Dur . 0 ES EF LS LF Float 0 0 0 0 1,10.2 010.2 11.7 11.7 21.9 2,6.2 0 6.2 0 0 6.2 3,15.7 6.2 21.9 6.2 0 21.9 4,12 21.9 33.9 21.9 0 33.9 5,20.2 33.9 54.1 33.9 0 54.1 6,5.3 54.1 59.4 58.1 4 63.4 7,3.0 54.1 57.1 54.1 0 57.1 8,6.3 57.1 63.4 57.1 0 63.4 9,3.0 63.4 66.4 63.4 0 66.4
  • 26.
    Uncertainty of ProjectCompletion Time  Assume activities are statistically independent  Variance of a set of activities is the sum of the individual variances.  Recall our earlier example, the critical path is a-d-j. the variances of these activities are 4, 25, and 4 respectively. Therefore, the variance of the critical path is 4+25+4=33 days.  Assume that the PM has promised to complete the project in 50 days. What is the chance of meeting this deadline? 8-26
  • 27.
  • 28.
    Uncertainty of ProjectCompletion Time  Table 8-5 Normal tables 8-28
  • 29.
    Uncertainty of ProjectCompletion Time  Table 8-5 Normal tables 8-29
  • 30.
    Toward Realistic TimeEstimates   8-30
  • 31.
    Toward Realistic TimeEstimates   8-31
  • 32.
    Risk Analysis UsingSimulation with Crystal Ball  We will use simulation in scheduling projects  Recall the project in Table 8-1  The network of that project is shown in Fig. 8-13 8-32
  • 33.
    Risk Analysis UsingSimulation with Crystal Ball  In Cells A3 through J3 enter the expected time for the activity duration  In the shaded cells define a BetaPERT distribution according to the three-time estimates in Table 8-1  In cells K3 through R3 define the project completion time as per the path used.  In defining the project completion time, we use the activity TEs and the project completion time is the sum of the activity Tes over that path  Note that there are eight paths to follow from start to end Fig. 8-27 shows a model for simulating the project 8-33
  • 34.
    Risk Analysis UsingSimulation with Crystal Ball  Now enter the formula that calculates the project duration in cell S3.  The formula will select the path with the longest duration.  Select S3 as your Forecast output and start the simulation Fig. 8-27 shows a model for simulating the project 8-34
  • 35.
    Risk Analysis UsingSimulation with Crystal Ball  Fig. 8-28 shows the simulation output  If you wish to find the likelihood of finishing the project in 52 days, enter the number 52 in the box “+ infinity” and then press enter. The probability you seek will show up in the Certainty cell (see Fig. 8-20)  Other questions such as “What is the duration required if we want to be 90% sure?”, are also applicable using the simulation 8-35
  • 36.
    Risk Analysis UsingSimulation with Crystal Ball  Simulation can provide more information about the project completion time  Figures 8-30, and 8-31 provide statistical information about the distribution shown in Fig. 8- 28  The mean of the completion time is 47.8 days and the median is 47.6 days.  Recall that the expected completion time over the critical path was 43 days.  The difference between the two means is due to possible path mergers. The probability of path mergers is not possible to account for through regular spreadsheets. But it can be handled easily through simulation 8-36
  • 37.
    Final note: Projectsare dynamic  Project activities are most of the time uncertain.  In reality, rarely project duration is equal to most likely.  Floats calculated initially are bound to change throughout the project.  Critical paths are also expected to change many time.  Repeated simulations are advised at various stages of project once we have more information about our project. 8-37
  • 38.
    Problem 4 page306  4. Given the following diagram, find:  a. The critical path.  b. How long it will take to complete the project?  c. The ES, LS, EF, and LF for each activity.  d. The slack for each activity.
  • 39.
    Problem 4 page306  4. Solution:- a. The critical Path is B-E-G b. The project duration is 23 days c. The ES, SF, LS, and LF schedules are shown in the figure to the right. d. The slacks for A=1, C=5, D=1,and F=5 (10,15) (7,18) (7,18) (15,20)

Editor's Notes

  • #7 ADM arrow diagraming method, PDM precedence diagramming method PERT was primarily for R&D projects CPM was for construction projects
  • #8 ADM arrow diagraming method, PDM precedence diagramming method PERT was primarily for R&D projects CPM was for construction projects
  • #9 ADM arrow diagraming method, PDM precedence diagramming method PERT was primarily for R&D projects CPM was for construction projects
  • #10 ADM arrow diagraming method, PDM precedence diagramming method PERT was primarily for R&D projects CPM was for construction projects
  • #21 Finish to start (most common): You cannot start taking the class without finishing your office work Start to start: you can only take notes once you enter the class, physically or virtually. concrete leveling can only start once concrete has been poured Finish to finish: Editing can only be finished if writing has been finished Start to finish (most uncommon): Duty of guard can only finish if next guard has started his duty
  • #23 Perform this exercise in class, draw AON, do forward, backward pass, calculate slack
  • #24 Perform this exercise in class, draw AON, do forward, backward pass, calculate slack