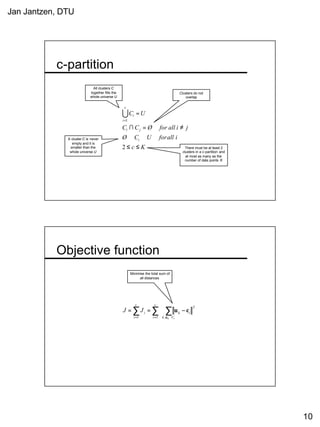
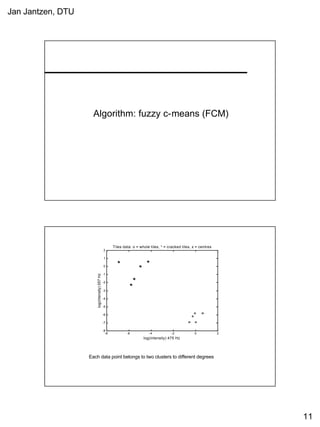
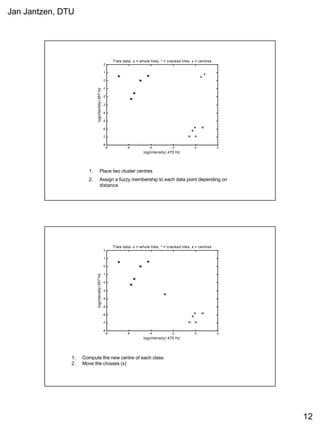
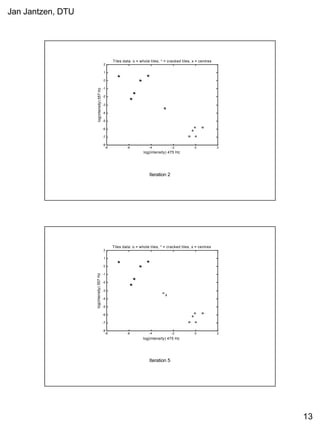
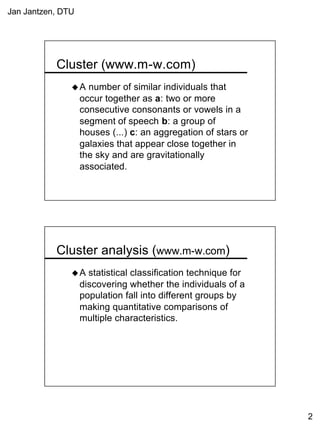
This document provides a tutorial on fuzzy clustering techniques. It begins with definitions of clustering and fuzzy clustering. It then walks through examples of applying hard c-means and fuzzy c-means clustering algorithms to classify tiles and cancer cells. Hard c-means results in data points being strictly assigned to one cluster, while fuzzy c-means allows partial membership in multiple clusters. The document demonstrates how both algorithms can be used to find optimal cluster centers and classify new data points.

![Jan Jantzen, DTU
3
Vehicle Example
Vehicle Top speed
km/h
Colour Air
resistance
Weight
Kg
V1 220 red 0.30 1300
V2 230 black 0.32 1400
V3 260 red 0.29 1500
V4 140 gray 0.35 800
V5 155 blue 0.33 950
V6 130 white 0.40 600
V7 100 black 0.50 3000
V8 105 red 0.60 2500
V9 110 gray 0.55 3500
Vehicle Clusters
100 150 200 250 300
500
1000
1500
2000
2500
3000
3500
Top speed [km/h]
Weight[kg]
Sports cars
Medium market cars
Lorries](https://image.slidesharecdn.com/clustering-tutorial-130701165659-phpapp01/85/Clustering-tutorial-3-320.jpg)
![Jan Jantzen, DTU
4
Terminology
100 150 200 250 300
500
1000
1500
2000
2500
3000
3500
Top speed [km/h]
Weight[kg]
Sports cars
Medium market cars
Lorries
Object or data point
feature
feature space
cluster
feature
label
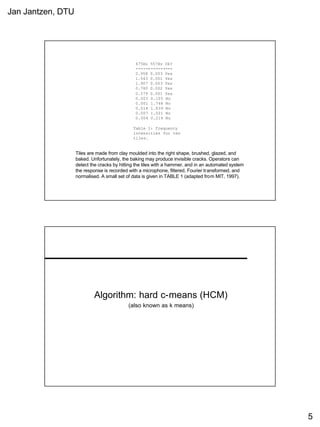
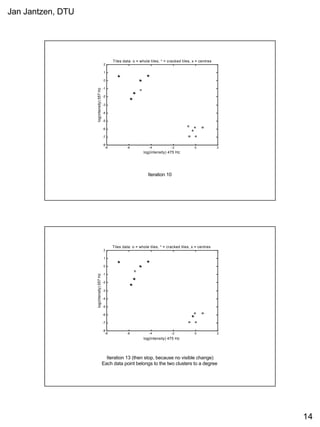
Example: Classify cracked tiles](https://image.slidesharecdn.com/clustering-tutorial-130701165659-phpapp01/85/Clustering-tutorial-4-320.jpg)