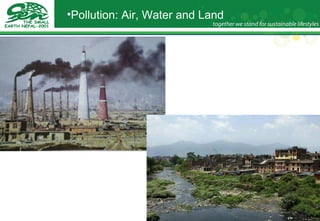
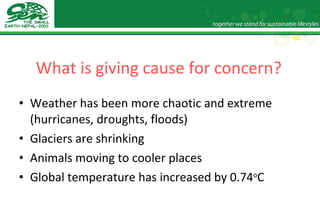
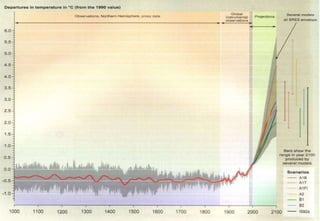
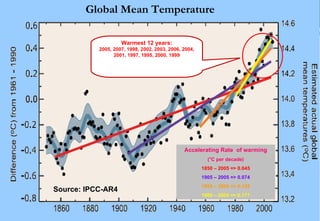
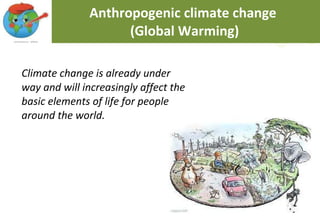
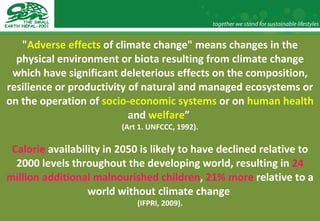
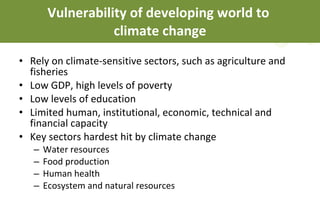
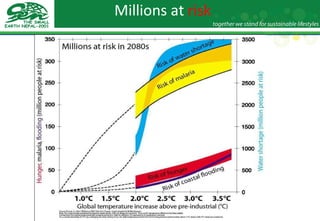
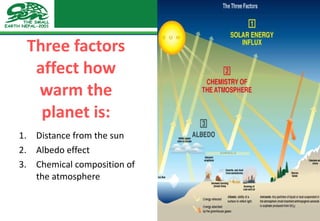
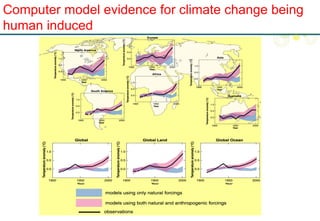
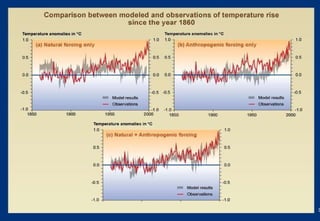
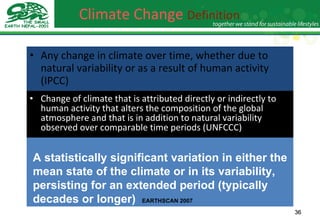
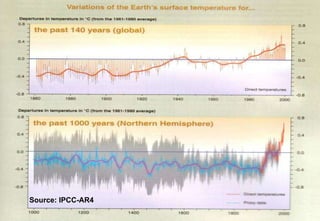
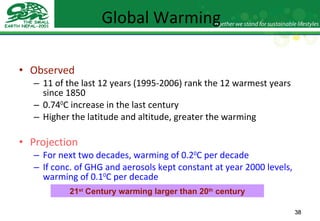
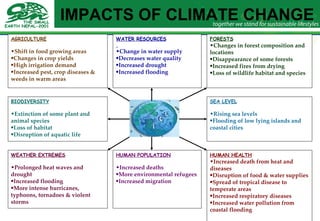
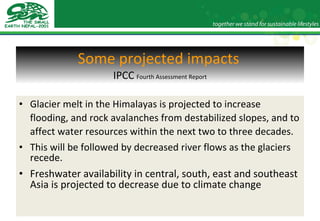
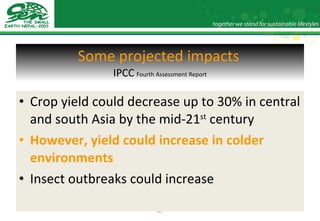
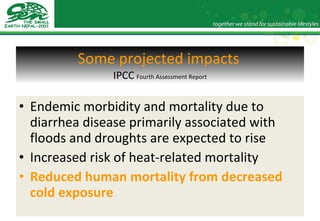
The document discusses climate change science and the role of youth. It provides an overview of the causes and impacts of climate change, including increasing global temperatures, rising sea levels, and more extreme weather events. It also summarizes observed and projected climate trends in Nepal, such as increasing temperatures, more heavy rainfall events, and glacial retreat in the Himalayas. The role of youth in understanding and responding to climate change through adaptation efforts is emphasized.
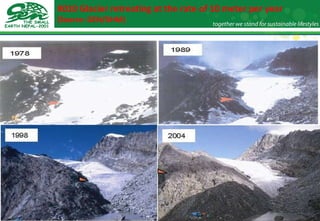
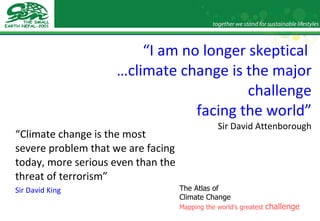
![How Fast They Are Shrinking? Faster than the other glaciers Faster than the previous estimate Dyurgerov [2002]; Fujita et al. [1997, JG; 1998; BGR; 2001, BGR]](https://image.slidesharecdn.com/rucdhiraj6aug2011-110927022100-phpapp01/85/Climate-Science-Dhiraj-Pradhananga-58-320.jpg)

![Discussion!!! The Small Earth Nepal 626 Bhakti Thapa Sadak Naya Baneshwor Tel: +977-1-4782738 Email: [email_address] URL: http://www.smallearth.org.np](https://image.slidesharecdn.com/rucdhiraj6aug2011-110927022100-phpapp01/85/Climate-Science-Dhiraj-Pradhananga-96-320.jpg)