Downloaded 171 times


![Some emerging trends in fighting Global Warming? Save Energy by technology options Carbon Trading Carbon sequestration Cleaner Technology of Production Reuse of Wastes & Waste Energy Carbon Di Oxide Capture & Storage [Mineral Carbonation, Ocean Storage, Geological Storage] Clean Development Mechanism!](https://image.slidesharecdn.com/gwfinal-090808055931-phpapp01/85/Gw-Final-65-320.jpg)
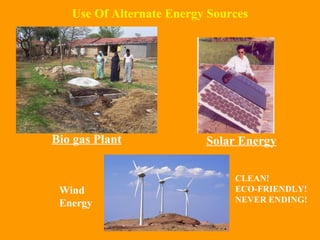
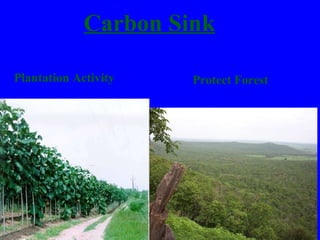
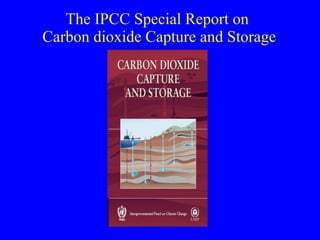
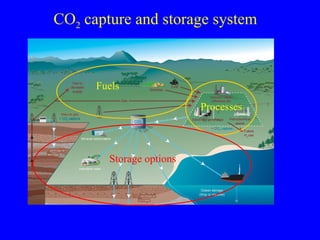
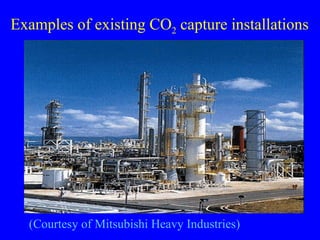
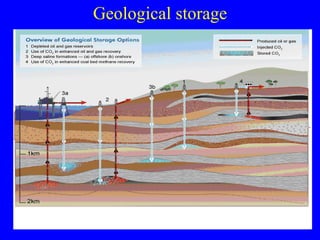
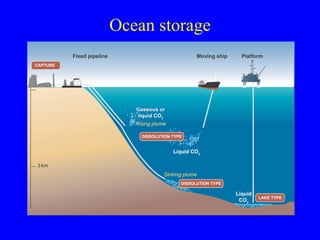
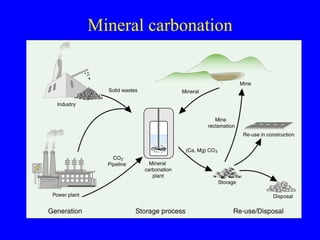
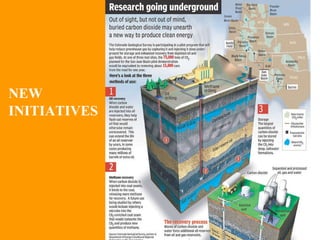


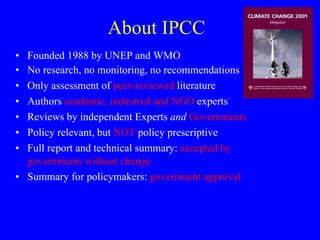
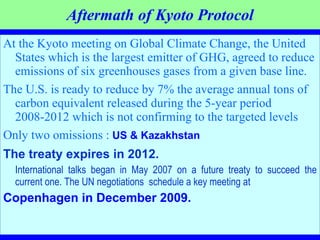
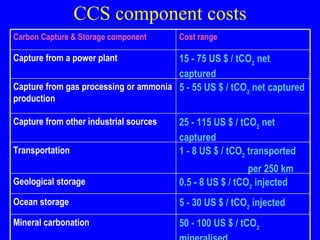
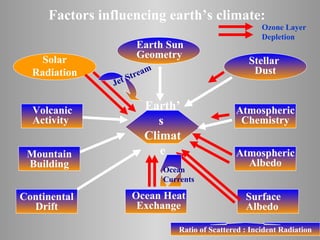
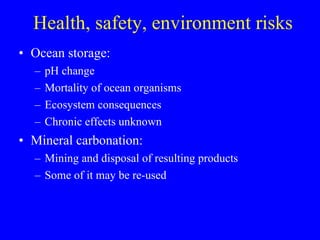
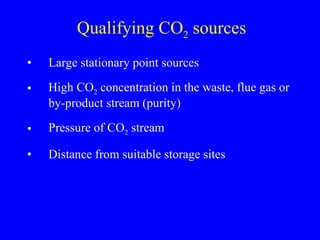
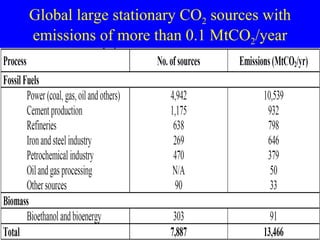
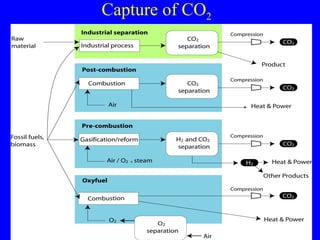
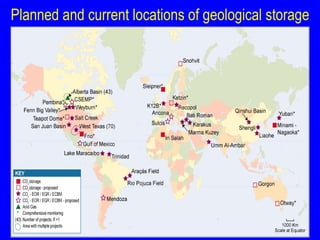
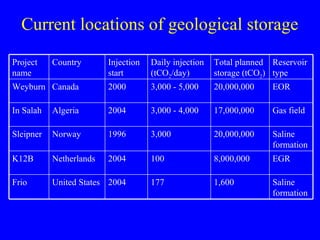
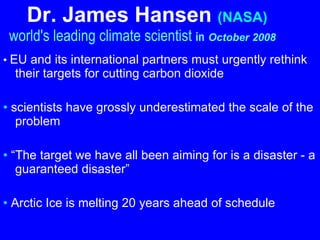

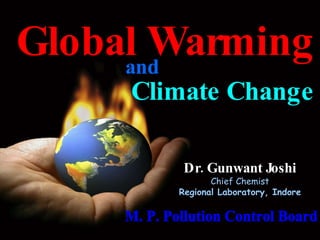
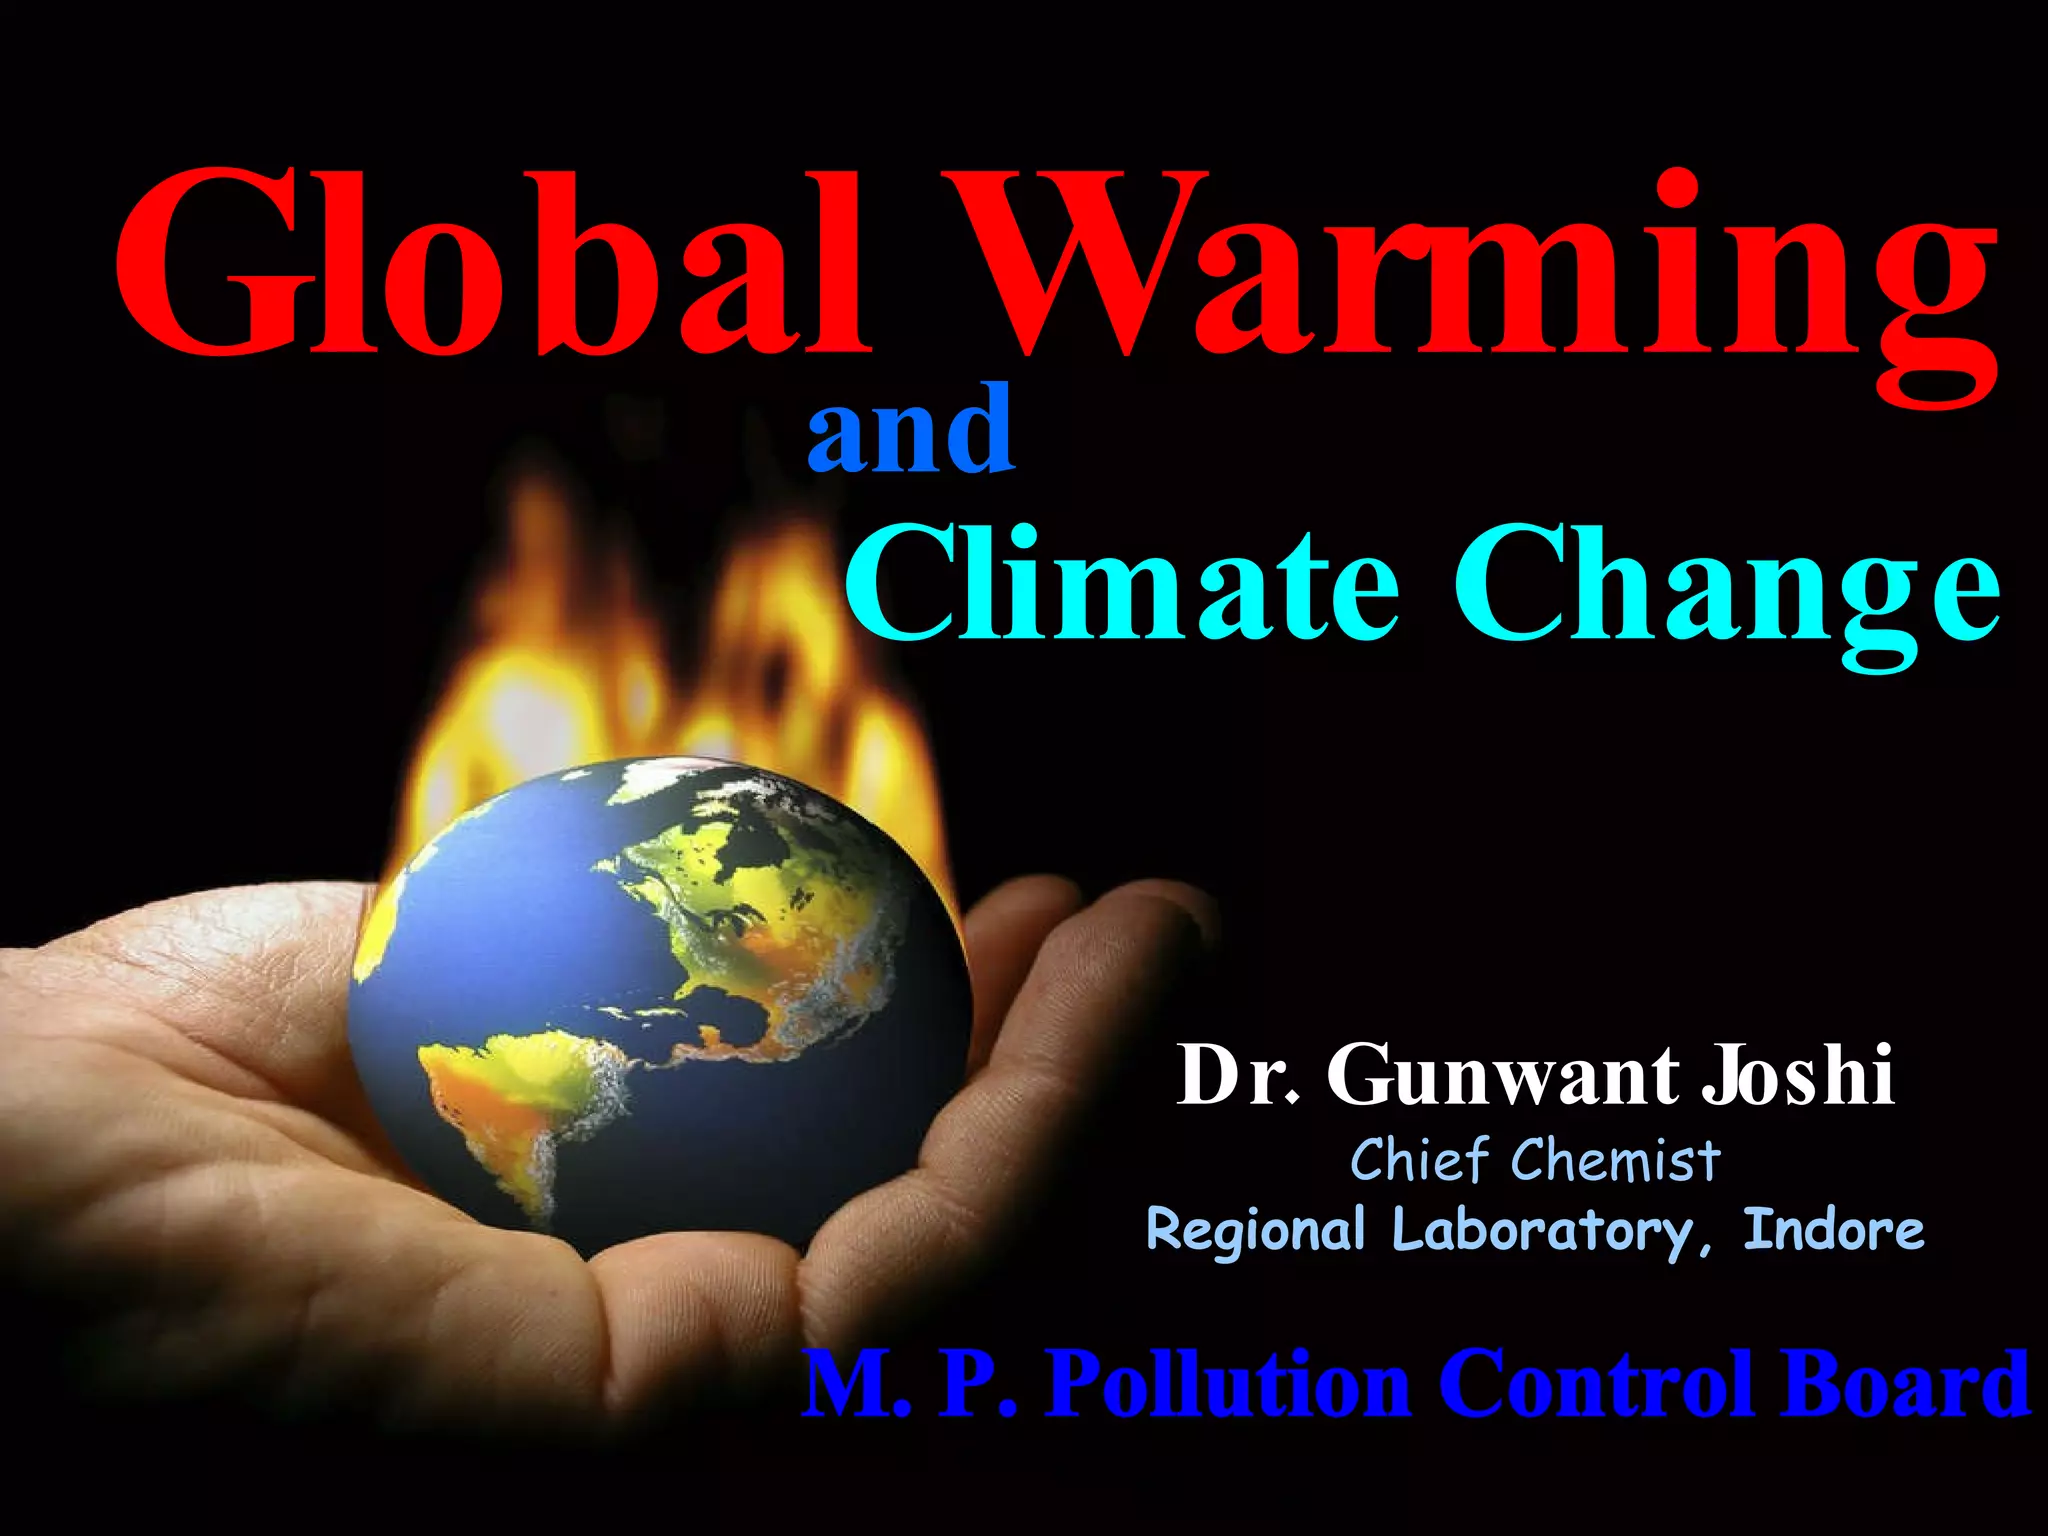
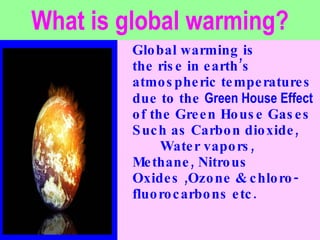
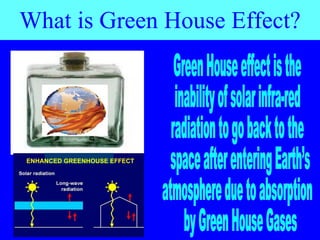
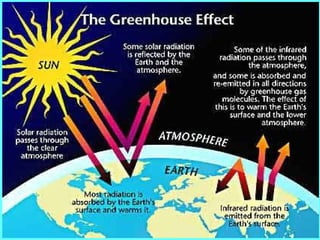
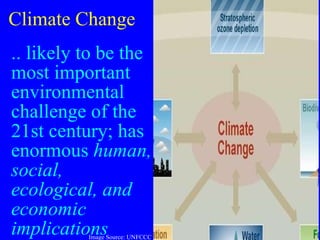
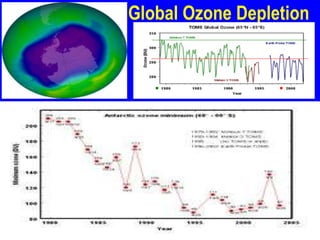
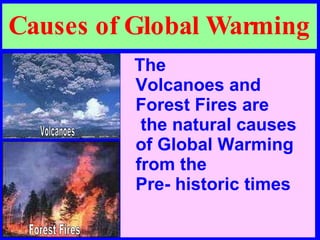
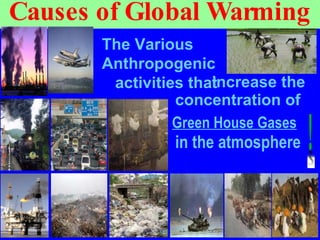
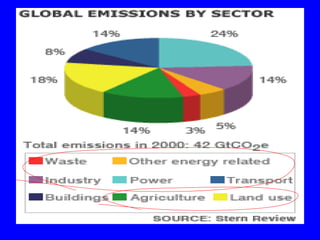
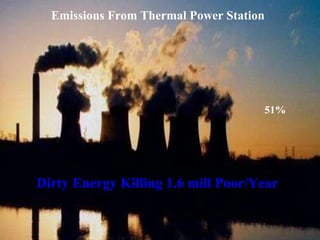
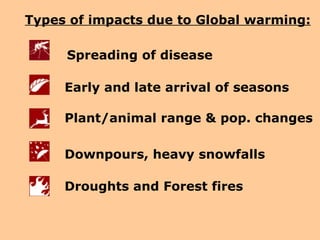
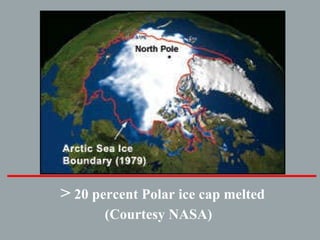
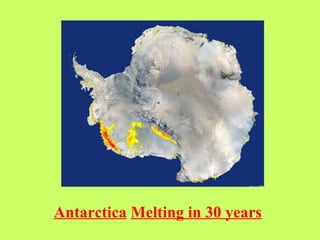
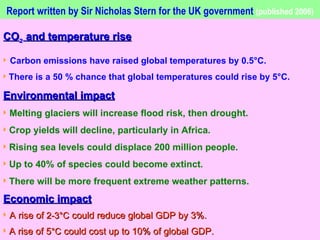
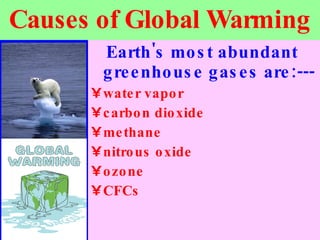
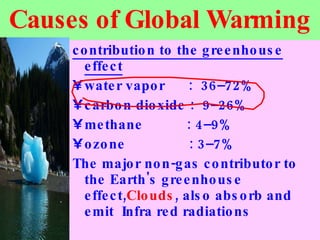
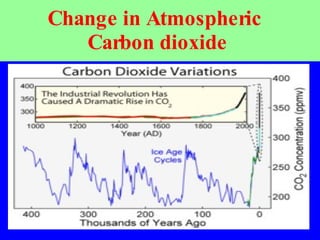
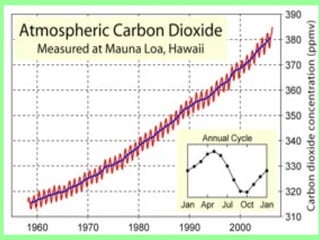
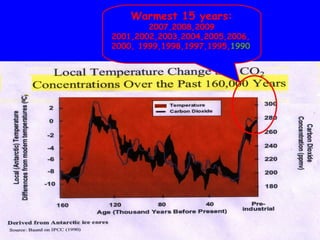
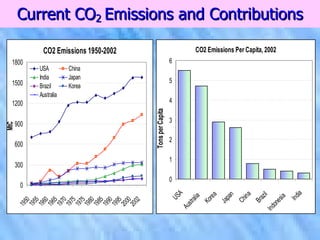
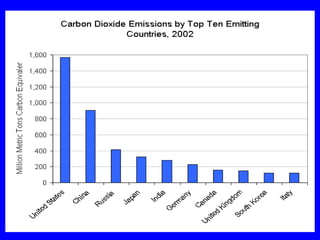
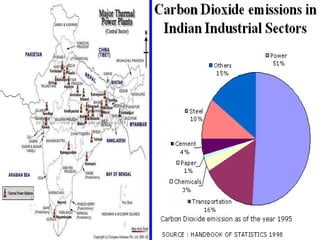
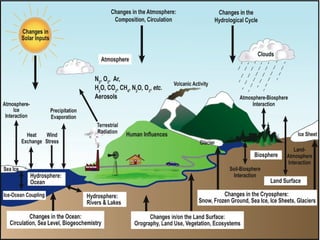
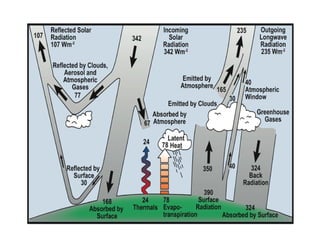
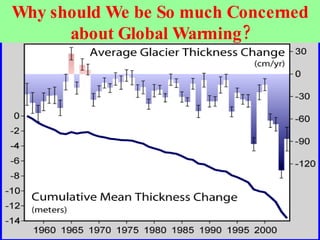
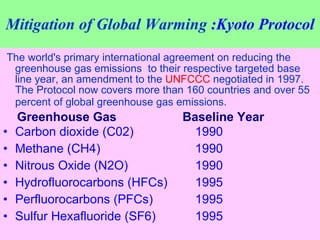
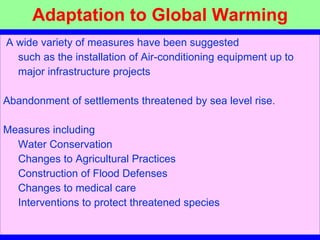
The document discusses global warming and its causes, evidence, and potential impacts. It also outlines strategies to mitigate and adapt to global warming effects, including the Kyoto Protocol which aims to reduce greenhouse gas emissions. Key technologies discussed are carbon capture and storage from large industrial sources, with geological storage seen as a promising option to help address the global challenge of climate change.


![Global Warming P P T [97 03]](https://cdn.slidesharecdn.com/ss_thumbnails/globalwarmingppt97-03-090408023255-phpapp02-thumbnail.jpg?width=640&height=640&fit=bounds)


