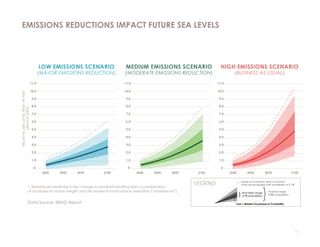
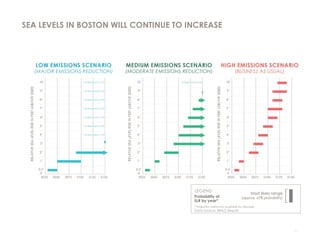
3. 1
To help us understand climate
change impacts at the local level,
the City of Boston and Green
Ribbon Commission convened
a working group of the region’s
top climate scientists. The Boston
Research Advisory Group (BRAG),
overseen by the University of
Massachusetts-Boston School for
the Environment, developed this
Bostonians need
to understand the
likely impacts of
climate change in
order to plan for
a strong, resilient
future.
consensus about how Boston’s
climate will change over the
course of the 21st century.
The Climate Project Consensus
projects future climate impacts
in the Boston region, including
extreme temperatures, sea level
rise, heavy precipitation and
coastal storms.
EXTREME
TEMPERATURES
EXTREME
PRECIPITATION
STORMSSEA LEVEL RISE
4. 2
Because we do not know how well
we will do, scientists use multiple
emissions scenarios as the bases for
their projections. Climate projections
for the next few decades are
relatively consistent, regardless of
which emissions scenario they rely
on. However, the projections become
increasingly different the further we
look into the future. This is because
the past 200+ years of burning
fossil fuels and clearing forests have
already changed our climate and will
continue to do so, but our actions
going forward will have an important
impact on whether climate change
accelerates or slows down.
These projections use three emissions
scenarios from the International
Panel on Climate Change, which are
called “representative concentration
pathways” or RCPs.
RCP 8.5 is a high-emissions trajectory
and is often characterized as a
continuation of “business as usual.”
RCP 4.5 assumes that emissions
remain around their current levels
through 2050, then are slowly
reduced in the second half of the
century.
RCP 2.6 is a stringent emissions
reduction pathway, and the pathway
most consistent with the net-zero
emissions in the second half of the
21st century envisioned by the 2015
Paris Agreement on climate change.
INTRODUCTION
The longer-term
impacts of
climate change
are largely
dependent on
our success at
curbing global
emissions of
greenhouse
gases.
5. 3
The amount of future changes
depends on our actions today
Our choices about transportation, energy, and land
use determine the level of greenhouse gases in the
atmosphere. As greenhouse gases increase, the
impacts of climate change like sea level rise, extreme
precipitation, and extreme temperatures increase. We
don’t know the exact amount of changes because the
amount of future emissions is uncertain. Will we take
actions now that will help minimize future change?
6. 4
EXTREME TEMPERATURES KEY FINDINGS
Average temperatures in the
Northeast have been slowly
rising for over a century.
Temperatures in the Northeastern
United States increased by almost
two degrees Fahrenheit between
1895 and 2011.
The rate of increase in average
temperatures is accelerating.
While over the past century,
temperatures in the Northeast
rose about two degrees, the
increase over the next century
may be greater than ten degrees.
As an urban area, Boston tends
to be hotter than surrounding
communities that are more
suburban or rural.
Urban areas generally tend to be
hotter than nearby rural areas
because concrete, steel, and
other building materials retain
more heat than vegetation. This
phenomenon, known as the
“urban heat island effect”, is
compounded by climate change.
7. 5
Boston’s summers
are getting hotter.
While the average summer
temperature in Boston from
1981 to 2010 was 69 degrees, it
may be as high as 76 degrees by
2050 and 84 degrees by 2100.
Future temperatures in
Boston will depend on how
much we are able to cut our
greenhouse gas emissions.
The rise in temperatures
between now and 2030 is
largely consistent between all
emission scenarios. However,
the scenarios show that cutting
emissions now can greatly slow
the rise in temperatures in the
second half of the century.
EXTREME TEMPERATURES KEY FINDINGS
8. 6
There will be more days
of extreme heat.
Compared to the period
from 1971 to 2000, when
there were 11 days per year
over 90 degrees, there may
be as many as 40 by 2030,
and 90 by 2070 – nearly the
entire summer.
Heat waves will become
more common, last
longer, and be hotter.
The City of Boston defines
heat waves as periods of
three or more days above 90
degrees, and heat waves are
a leading cause of weather-
related mortality in the
United States.
EXTREME TEMPERATURES KEY FINDINGS
9. 7
Although winters will be
warmer, the risk of frost
and freeze damage and
cold snaps will continue.
While from 1981 to 2010,
Boston reached below-
freezing almost one out of
three days per year, by the
end of the century this may
happen only around one in
ten days.
EXTREME TEMPERATURES KEY FINDINGS
10. 8
The relative sea level in Boston
Harbor has risen over the past
century.
From 1921 to 2015, the overall
trend in relative sea level rise
was about 0.11 inches per year.
Relative sea level is the difference
in elevation between the sea
surface and land surface at a
specific place and time, so relative
sea level rise can be a combination
of changes in the sea surface and
changes in the land surface. In
Boston, the sinking of the land
surface – called “subsidence” – is
relatively minor compared to
changes in the sea level.
SEA LEVEL RISE KEY FINDINGS
The pace of relative sea level rise
is accelerating. Over the entire
20th century, sea levels rose
about 9 inches relative to land.
The next nine inches of relative sea
level rise may happen by 2030, over
three times the speed. By 2070, the
relative sea level may be over 4 feet
higher than it was in 2000.
Sea level rise is caused by
a combination of land-ice
melting, thermal expansion, and
changes in land water storage.
Land-ice melting includes the
melting of mountain (alpine)
glaciers, ice caps, and the
continental-scale ice sheets on
Greenland, West Antarctica,
and East Antarctica. Thermal
expansion describes the
phenomenon that, as water
warms, it generally occupies
a greater volume. Land water
storage describes activities that
affect the amount of water stored
on land, such as holding water in
reservoirs and/or behind dams or
pumping out underground water
for irrigation and use by people.
11. 9
As sea levels rise, a deeper
harbor will mean higher and
more powerful waves.
Although Boston remains
relatively protected from Atlantic
waves by Winthrop, Hull, and the
Harbor Islands, stronger waves are
more likely to damage sea walls
and erode beaches. The outer
islands and peninsula shorelines
of Boston Harbor are likely to
experience these impacts to a
greater extent than the Boston
proper shoreline.
A major reduction in global
greenhouse gas emissions can
have a tremendous impact on
the future of Boston Harbor.
While sea level rise projections
for 2030 are consistent across all
emission scenarios, in later years
there are big differences between
scenarios. With a sharp emissions
reduction, we may be able to
keep end-of-century sea level rise
to under two feet, while higher
emissions may result in over
seven feet of sea level rise.
SEA LEVEL RISE KEY FINDINGS
14. 12
In the Northeast, there has
already been a very large
increase in the intensity of
extreme rain and snow.
From 1958 to 2010, there was a
70% increase in the amount of
precipitation that fell on the days
with the heaviest precipitation.
This increase is greater in the
Northeast than for any other
region of the country.
EXTREME PRECIPITATION KEY FINDINGS
The increase in extreme
precipitation is expected
to continue.
As the climate warms, more ocean
water evaporates into the air, and
warmer air can hold more water,
supporting heavier precipitation
events. Heavy precipitation
events will continue to increase
in Boston. However, due to the
complexity of the processes
underlying precipitation as well as
natural variability, the magnitude
of this increase is not yet clear.
While the total amount of
annual snowfall will decrease,
there may still be some heavy
snow events through the end of
the century.
Based on regional projections,
total snow accumulations could
decrease 31-48% by 2100, and
the start to the snow season is
expected to be delayed. However,
changes in daily heavy snowfall
events can be quite different
from changes in annual snowfall.
Expected changes to individual
heavy snow events, ice storms, and
drought are not clear.
15. 13
Both stormwater and riverine
flooding are affected by
extreme precipitation.
Boston’s stormwater drainage
system may be overwhelmed
by major rain events. It may be
further compromised by sea level
rise as drain outlets are flooded
by the rising ocean, reducing the
ability of the drainage system to
convey stormwater to the coast.
River flooding is also likely to
increase, but there are large
uncertainties associated with river
flooding due to the complexity
of the climate and hydrological
systems involved.
If we take action to cut global
greenhouse gas emissions, we
can prevent the most extreme
precipitation projections from
becoming a reality.
A commonly used measure of
major rain and snow events is the
amount of precipitation that has at
most a one-in-ten annual chance
of falling during a 24-hour period.
While projections for these events
are similar in the short term across
different emission scenarios,
by the end of the century the
difference between medium
and high scenarios is about ten
percent.
EXTREME PRECIPITATION KEY FINDINGS
17. 15
STORMS KEY FINDINGS
For Boston, the storms that
are of greatest concern are
“extratropical cyclones”,
followed by “tropical cyclones.”
Extratropical cyclones, which are
more common and longer-lasting
in the Northeast than tropical
cyclones, currently produce most
of the storm-induced flooding
in the Boston region and will
continue to do so in the near
future. These are storms that
originate outside of the tropics and
are sometimes called nor’easters.
They can form during any time of
the year but are most prevalent in
the extended cold-season months.
Tropical cyclones are storms that
originate in the tropics and are
called hurricanes once they reach a
sustained wind speed of more than
74 miles per hour.
Current climate projections do
not provide a clear projection
of how the intensity, frequency,
and trajectory (tracks) of
tropical and extratropical
storms will change.
There are large uncertainties
about how climate change will
affect future storms. This is
particularly true for extratropical
storms. For tropical storms,
there is some evidence that their
intensity has been increasing. If
tropical storm intensity increases,
there could be more frequent
major hurricanes (Category 3
and greater), even if the total
number of tropical storms does
not increase.
Rising sea levels mean that any
given storm will cause more
flooding in the future than in
would today.
During a storm, winds can blow
ocean water towards the land,
creating a “storm surge” on top
of the baseline sea level. When
storm surge is combined with tidal
processes, the result is known as a
“storm tide”. With higher seas, it
takes less precipitation and a less
powerful storm surge to produce
the same amount of flooding as
a more powerful storm would
produce when the seas are lower.
18. NEXT STEPS
THE INTEGRATED VULNERABILITY
ASSESSMENT WILL ANALYZE THE
IMPACT OF THESE CHANGES
ON OUR CITY, AND RESILIENCE
STRATEGIES WILL INCLUDE
PRELIMINARY IDEAS FOR PROJECTS,
POLICIES, AND PROGRAMS TO
HELP OUR NEIGHBORHOODS AND
INFRASTRUCTURE RESPOND TO
CLIMATE CHANGE AND BECOME
MORE RESILIENT.