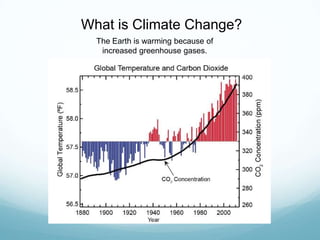
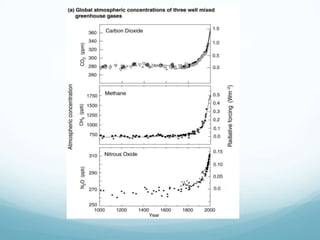
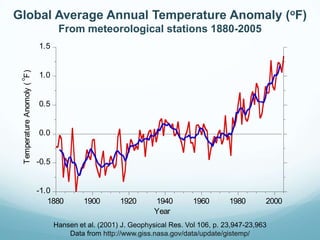
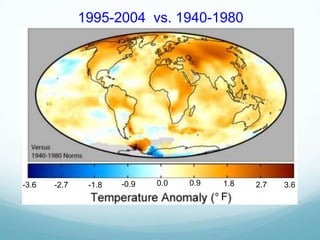
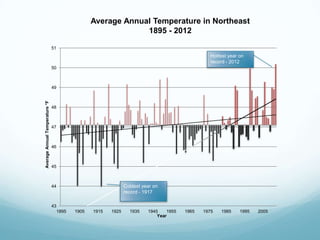
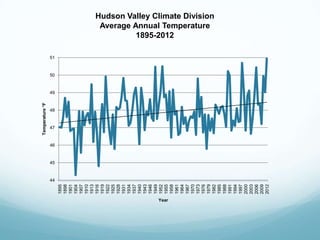
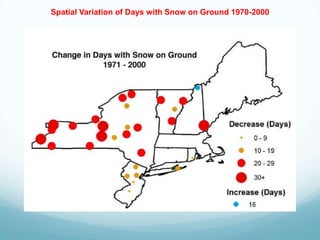
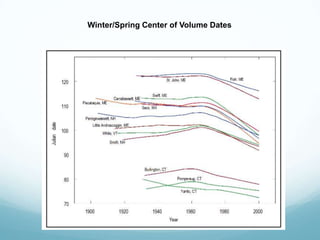
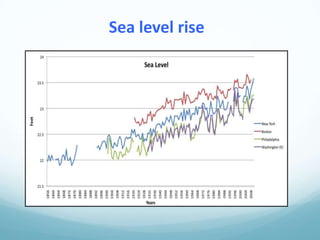
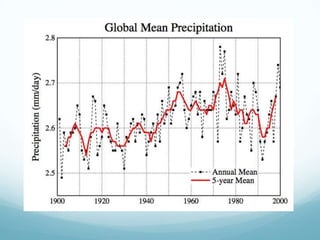
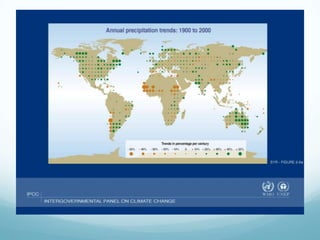
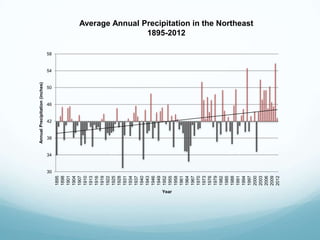
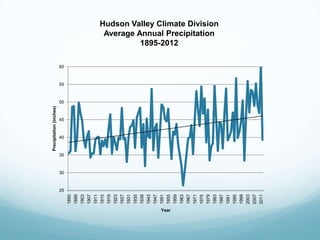
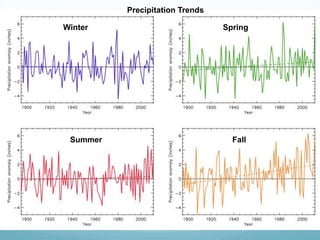
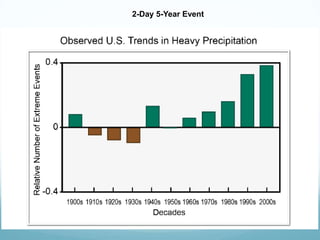
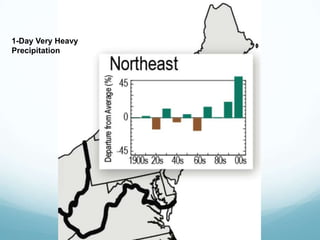
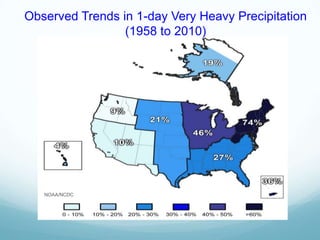
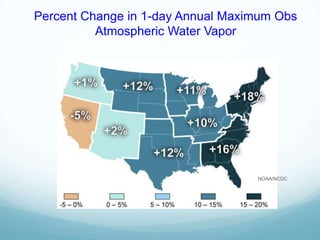
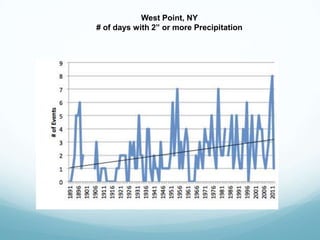
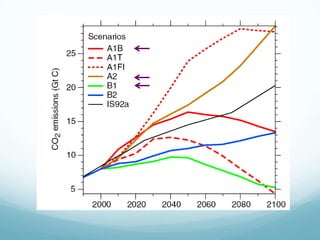
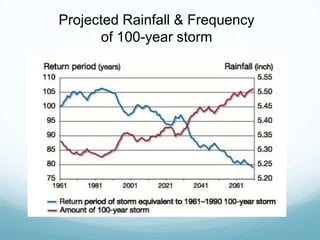
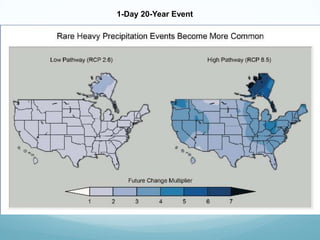
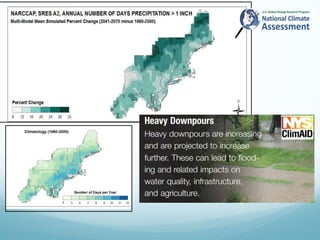
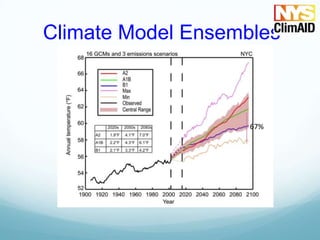
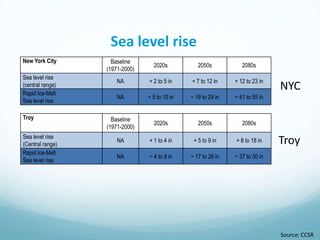
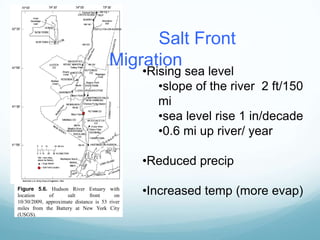
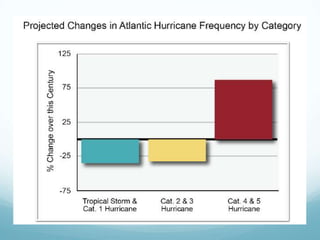
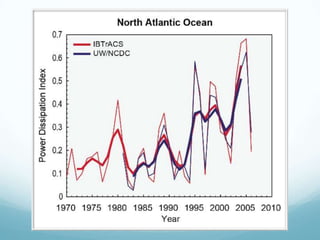
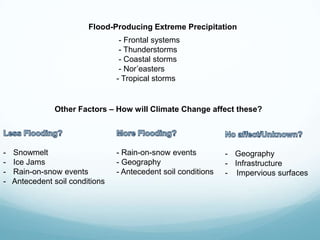
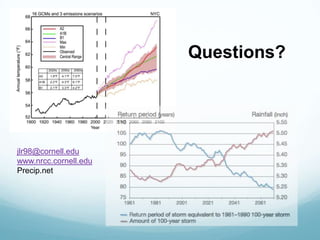
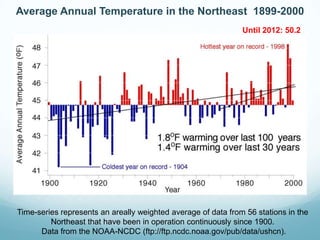
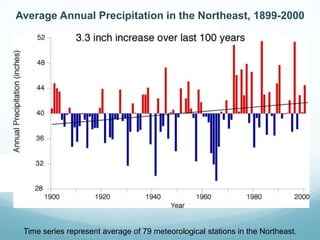
Climate Change
&
Extreme Precipitation
Jessica Rennells
NOAA, Northeast Regional Climate Center at Cornell
University
What is Climate Change?
The Earth is warming because of
increased greenhouse gases.
Global Average Annual Temperature Anomaly (oF)
From meteorological stations 1880-2005
Hansen et al. (2001) J. Geophysical Res. Vol 106, p. 23,947-23,963
Data from http://www.giss.nasa.gov/data/update/gistemp/
-1.0
-0.5
0.0
0.5
1.0
1.5
1880 1900 1920 1940 1960 1980 2000
TemperatureAnomoly(
o
F)
Year
1995-2004 vs. 1940-1980
-3.6 -1.8-2.7 -0.9 3.62.71.80.90.0
F
43
44
45
46
47
48
49
50
51
1895 1905 1915 1925 1935 1945 1955 1965 1975 1985 1995 2005
AverageAnnualTemperature°F
Year
Coldest year on
record - 1917
Hottest year on
record - 2012
Average Annual Temperature in Northeast
1895 - 2012
Hudson Valley Climate Division
Average Annual Temperature
1895-2012
44
45
46
47
48
49
50
51
1895
1898
1901
1904
1907
1910
1913
1916
1919
1922
1925
1928
1931
1934
1937
1940
1943
1946
1949
1952
1955
1958
1961
1964
1967
1970
1973
1976
1979
1982
1985
1988
1991
1994
1997
2000
2003
2006
2009
2012
Temperature°F
Year
Spatial Variation of Days with Snow on Ground 1970-2000
Winter/Spring Center of Volume Dates
Sea level rise
30
34
38
42
46
50
54
58
1895
1898
1901
1904
1907
1910
1913
1916
1919
1922
1925
1928
1931
1934
1937
1940
1943
1946
1949
1952
1955
1958
1961
1964
1967
1970
1973
1976
1979
1982
1985
1988
1991
1994
1997
2000
2003
2006
2009
2012
AnnualPrecipitation(inches)
Year
Average Annual Precipitation in the Northeast
1895-2012
Hudson Valley Climate Division
Average Annual Precipitation
1895-2012
25
30
35
40
45
50
55
60
1895
1899
1903
1907
1911
1915
1919
1923
1927
1931
1935
1939
1943
1947
1951
1955
1959
1963
1967
1971
1975
1979
1983
1987
1991
1995
1999
2003
2007
2011
Precipitation(inches)
Year
Winter Spring
Summer Fall
Precipitation Trends
2-Day 5-Year Event
1-Day Very Heavy
Precipitation
Observed Trends in 1-day Very Heavy Precipitation
(1958 to 2010)
NOAA/NCDC
Percent Change in 1-day Annual Maximum Obs
Atmospheric Water Vapor
NOAA/NCDC
West Point, NY
# of days with 2” or more Precipitation
72-h Precipitation (in) Ending at 8 AM 29 Aug 2011
Rainfall Associated with TC Irene
1-Day storm events on 8/28/2011
Slide Mtn: 8.62” = 200 yr storm event (8.03”) Rosendale:
8.52” = 100 yr storm event (7.37”) Mohonk Lake: 8.21” =
100yr storm event (7.36”)
Walden: 6.65” = 50yr storm event (6.13”)
Projected Rainfall & Frequency
of 100-year storm
1-Day 20-Year Event
Climate Model Ensembles
67%
Average
Summer
Heat Index 
# Days Over 90 
Seasonality
Area with Snow Cover for at least 30 days
Under high emissions scenario
Source: CCSR
NYC
Troy
New York City Baseline
(1971-2000)
2020s 2050s 2080s
Sea level rise
(central range)
NA + 2 to 5 in + 7 to 12 in + 12 to 23 in
Rapid Ice-Melt
Sea level rise
NA ~ 5 to 10 in ~ 19 to 29 in ~ 41 to 55 in
Troy Baseline
(1971-2000)
2020s 2050s 2080s
Sea level rise
(Central range)
NA + 1 to 4 in + 5 to 9 in + 8 to 18 in
Rapid Ice-Melt
Sea level rise
NA ~ 4 to 9 in ~ 17 to 26 in ~ 37 to 50 in
Sea level rise
Figure 5.6. Hudson River Estuary with
location of salt front on
10/30/2009, approximate distance is 53 river
miles from the Battery at New York City
(USGS).
•Rising sea level
•slope of the river 2 ft/150
mi
•sea level rise 1 in/decade
•0.6 mi up river/ year
•Reduced precip
•Increased temp (more evap)
Salt Front
Migration
Flood-Producing Extreme Precipitation
- Frontal systems
- Thunderstorms
- Coastal storms
- Nor’easters
- Tropical storms
Other Factors – How will Climate Change affect these?
- Rain-on-snow events
- Geography
- Antecedent soil conditions
- Snowmelt
- Ice Jams
- Rain-on-snow events
- Antecedent soil conditions
- Geography
- Infrastructure
- Impervious surfaces
Questions?
jlr98@cornell.edu
www.nrcc.cornell.edu
Precip.net
Time-series represents an areally weighted average of data from 56 stations in the
Northeast that have been in operation continuously since 1900.
Data from the NOAA-NCDC (ftp://ftp.ncdc.noaa.gov/pub/data/ushcn).
Average Annual Temperature in the Northeast 1899-2000
Until 2012: 50.2
Average Annual Precipitation in the Northeast, 1899-2000
Time series represent average of 79 meteorological stations in the Northeast.

Climate Change and Extreme Precipitation

Editor's Notes

  • #3 A non-random change in climate that is measured over several decades or longer. The change may be due to natural or human-induced causes. (nws)Global annual average temperature (as measured over both land and oceans; scale on left) has increased by more than 1.4°F (0.8°C) since 1880. (NOAA NCDC)
  • #7 1895-2012 = increase of 1 deg F (46.6 – 47.6) 1983-2012 = increase of 1.5 (46.9 – 48.4)Axis at 47.1, average of all yearsSecond trend line is 30 years (1983-2012)
  • #8 Through 2012. warmed about 1.2 deg F (47.2 – 48.4)
  • #10 13 longest-record rural, unregulated rivers (I.e. do not have a dam on them) in New England (Hodgkins et al. 2003). provides a date when half of the volume of a river has passed a gauging station for a particular season. Center-of-volume flows have been getting earlier on all the rivers studied, indicating the snowpack is melting earlier. Note the significant change around 1970. Over last 30 years, 1-2 weeks earlierEffect on Spring flooding – when flow rates at their highest.Jan – May; chart Mar 11, Mar 21, Mar 31, Apr 10, Apr 20, Apr 30, May 10Annual peak stream flows have increased at gauges in the Northeast during the past 85 years (Hirsch and Ryberg 2012)
  • #11 Annual mean sea level for gauges at four major Northeast coastal cities. Data from PSMSL (2012). 1856-2006Over past 1000 years regional rising of .34-.43” /decade. During 20th century rise of 1.2”/decade. Rate of change similar in recent decades Observed Sea Level Rise in NYC (at the Battery, NYC) 1.2’ over 100 years, exceeding the global ave of 8” (from NYC Panel on CC 2010)Warming water => increase ocean water volume (thermal expansion), melting of glaciers & ice sheets, changes in Atlantic Ocean Circulation, geological processes (land subsidence)Saltwater front moves further up the Hudson River (sea level rise), saltwater intrusion
  • #14 Increase by almost 6” (39 – 44.9)Axis at 41.9 – average of all years
  • #15 Through 2012. shows considerable year-to-year variability, overall increase. . This increase in precipitation is consistent with the warmer temperatures the region has experienced (warmenr temperatures - more evaporation - increased capacity of atmosphere to hold moisture - more precipitation.One of the most striking features in the drought in the first half of the 1960sIncrease of about 7.2” (38.8 – 46)
  • #16 1895-2011 (using CDDv2 data set) Summer doesn’t exhibit the trend, but some very wet summers in past 10 years (2006, 2009). Fall is statistically significant: +0.24”/decade
  • #17 a 2-day 5-year storm event for contiguous US (1901-2011) compared to 1901-1960 period. (Figure source: adapted from (Kunkel et al. 2012)
  • #18 Very Heavy events (heaviest 1% of daily events from 1901-2011) compared to 1901-1960 average (Figure source: NOAA NCDC/CICS-NC)
  • #21 Increase of about 2 days
  • #22 Iren on 8/28/2011 (NASA Satellite Image)
  • #23  72-h precipitation (inches, shaded every 2 in) ending at 1200 UTC 29 Aug 2011. From the Northeast Regional Climate Center (NRCC) high-resolution gridded dataset.
  • #24 Based on precip amounts only. From precip.netSlide Mtn: 8.62” = 200 yr storm event (8.03”) (Ulster County)Rosendale: 8.52” = 100 yr storm event (7.37”) (Ulster County)Mohonk Lake: 8.21” = 100yr storm event (7.36”) (Ulster County)Walden: 6.65” = 50yr storm event (6.13”) (Orange County)Poughkeepsie: 5.95” = 25yr storm event (5.16”) (Dutchess County)
  • #26 100-year storm(ClimAID) HadCM3 model, consistent w/ other 15 gcm’sNYS stations
  • #27 1-day 20-year event for 2081-2100 compared to 1981-2000. Left: emissions reduction scenario (1-2x more), Right: continued increases in emissions (3-4x more)
  • #29 This method is one of the most straightforward and popular procedures for climate risk assessment, provided that the prerequisite climate model outputs are available. Change factors are typically calculated for calendar months by comparing the present and projected climatology in GCM for grid boxes overlying the target region.Change factors for temperature are calculated by subtracting the model averages representing baseline (1961–1990) from the future (e.g. 2020s, 2050s or 2080s) temperatures. Change factors for precipitation arenormally derived from the ratio of the projected-to-baseline averages, but absolute differences can also be applied. The temperature changes are then added to observations (or in the case of P multiplied by observations) to yield a climate series at the study location.Pros:Easy to apply; Can handle probabilistic climate model outputCons:1. Perturbs only baseline mean and variance
  • #30 90 days- Days per year reaching 90 or hotter (low & high scenarios)- Heat waves increasing in frequency, duration, intensity- Overnight temps too Heat Index- Averages summer heat index under high & low scenarios (temp & RH)- higher RH b/c warmer atmosphere can hold more moisture
  • #32 Droughtincreased in late summer/fall b/c warmer temps = higher evap rates, earlier spring snow meltextreme rain – too much of a good thing – ground can’t absorb/runoff/flooding - Short term droughts (lasting 1-3 months) could occur once per year, under higher-emissions scenario
  • #33 Snow MapHistoric vs late century : dusting of snow for at least 30 daysNortheast projected to lose 4-8 days / 10-15 days snow cover per monthMore precip falling as rain
  • #34 Global sea level rise of 1-4’ by 21004” more than global ave in Northeast (b/c land subsidence)
  • #36 Cat 4&5 Hurricanes are expected to increase 75% from the 2001-2020 period to the 2081-2100 period.
  • #37 measure of overall hurricane intensity; upward trend in strength of hurricanes and the # of strong hurricanes (Cat 4&5)­­ from 1983-2009 (Kossin et al. 2007)There has been an increase in the overall strength of hurricanes and in the number of strong (Category 4 and 5) hurricanes in the North Atlantic since the early 1980s. The intensity of the strongest hurricanes is projected to continue to increase as theoceans continue to warm.