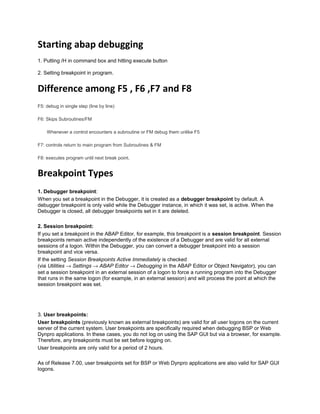
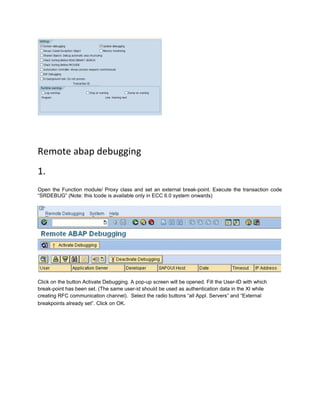
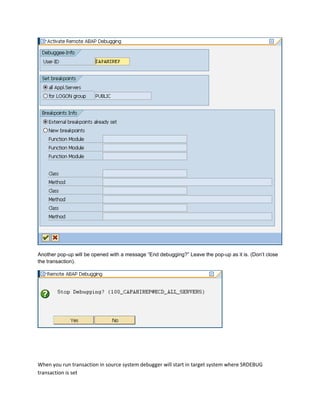
Setting breakpoints and using different debug step functions like F5, F6, F7 and F8 are described for debugging ABAP programs. The different types of breakpoints - debugger breakpoints, session breakpoints and user breakpoints are explained. Methods for debugging remote function modules using transaction SRDEBUG, debugging background jobs using transactions SM37 and SM50, and setting watchpoints to monitor variable changes are provided. Debugging techniques for smart forms using program lines and transaction SFTRACE are also summarized.
This document provides a tutorial on creating a graphical user interface (GUI) in Visual Basic Express to control a Phidget servo controller. It describes installing Visual Basic Express, creating the GUI with labels, a trackbar, and button, writing code to handle events like loading the form, trackbar movement, and Phidget attachment/detachment. The code initializes label texts, sets the trackbar range and value, centers the servo when attached, links the trackbar to change the servo position, and updates labels with status information. The tutorial is intended for beginners to learn how to interface Visual Basic with Phidget hardware.
The document provides instructions for two student programming exercises using the LogixPro Door Simulation. In the first exercise, students are asked to design a program to control a simulated door using relay logic instructions. The program must monitor limit switches and control the door motor to open and close the door based on push button inputs, while preventing issues like both motors energizing at once. In the second exercise, additional requirements are to be met, but are not described. Students are expected to fully design, document, debug and test their programs adhering to best practices.
1. The document discusses using the CX-Programmer integrated simulation to test ladder logic programs and associated HMI screens.
2. It provides instructions on starting the integrated simulation, opening a project, checking operation of the ladder and screen, resizing screens and saving locations.
3. The document also covers simulating PLC errors to test error handling programs and saving error log data to a CSV file.
The document provides an overview of the Blocos programming environment, which allows users to program using visual blocks instead of text code. Blocos translates the blocks into Cricket Logo code, compiles it, and sends it to a controller board to execute. It supports various controller boards and can run on Windows, Linux, and Mac OS. The main window interface is described, including the blocks pane, program pane, and other areas. Command references are provided for various block types like control blocks, flow blocks, test condition blocks, and others.
The document describes an automation testing framework based on Business Process Testing. Subject matter experts define business processes, components, and tests, while automation engineers define resources, libraries, and recovery scenarios. Together they build, run, and document business process tests without requiring programming knowledge from subject matter experts. The framework uses HP Functional Test (UFT/QTP) and supports Windows XP/Vista/7 and Internet Explorer 7-11. It includes diagrams of the framework and folder structure, and approaches test automation through requirement gathering, test case identification, script development, and reporting.
Blockly for PICAXE is a visual programming tool that allows users to generate programs for PICAXE microcontrollers by dragging and dropping colored blocks. It can be used online, within the PICAXE Editor software, or as a standalone Chrome app. The document provides an overview of Blockly and instructions for building, testing, and downloading programs to a PICAXE microcontroller.
This document defines standards for application development at SwissFEL to ensure consistent user interfaces. Key requirements include using MEDM displays where possible, standard menu layouts, fonts, colors, and widgets. Applications should integrate with EPICS, exporting scalar data to channels and non-scalar data to Nexus files. Example templates are provided for magnet and vacuum applications to illustrate the guidelines.
DevHelper Installation and User DocumentationPatrick O'Conor
The document provides installation and usage instructions for the DevHelper application. It describes how to install DevHelper, including required dependencies. It then explains how to use DevHelper to perform various file development tasks like deploying patches, migrating files to production, creating new packages, and assisting with triage processes. Screenshots are included to illustrate the user interface and steps to complete tasks within the application.
The document discusses the benefits of exercise for mental health. Regular physical activity can help reduce anxiety and depression and improve mood and cognitive function. Exercise causes chemical changes in the brain that may help protect against mental illness and improve symptoms.
This document summarizes the development of cardiac mesoderm from lateral plate mesoderm. It discusses how signaling pathways like BMP, Wnt, and noggin regulate this process through inhibition and activation of genes. BMP activates Mesp1, which inhibits Wnt and allows cardiac mesoderm to form. Noggin inhibits BMP to allow mmp-3 to activate cardiac genes. The current model has gaps, like how noggin increases mmp-3. Future experiments aim to fill these gaps, like seeing cardiogenesis without BMP or noggin.
The document discusses the benefits of exercise for mental health. Regular physical activity can help reduce anxiety and depression and improve mood and cognitive functioning. Exercise causes chemical changes in the brain that may help boost feelings of calmness and well-being.
This document discusses three major subfields in computer graphics: geometry, animation, and rendering. It also lists Autodesk Maya and Pixologic ZBrush as examples of software for polygonal modeling and sculpture modeling respectively. Performance capture, key frame animation, and simulation are provided as examples of techniques for animation.
Climate Ready Boston: Projection Consensus Summary Patrick Murray
The document summarizes climate projections for Boston from a working group of regional climate scientists. It finds that Boston will see increasing extreme temperatures, heavy precipitation, and sea level rise over the course of the 21st century depending on global greenhouse gas emission levels. Temperatures are projected to rise by over 10 degrees Fahrenheit by 2100 under a high emissions scenario, bringing many more days over 90 degrees each summer. Sea level is projected to rise up to 4 feet by 2070 and over 7 feet by 2100 under a high emissions scenario, increasing coastal flooding and beach erosion. Heavy rainfall events are also expected to continue increasing in frequency and intensity.
The document discusses the benefits of exercise for mental health. Regular physical activity can help reduce anxiety and depression and improve mood and cognitive function. Exercise causes chemical changes in the brain that may help protect against mental illness and improve symptoms.
Este documento presenta un resumen de las teorías conductista y cognitiva del aprendizaje. Explica que el aprendizaje debe basarse en una teoría para su implementación correcta. Luego describe brevemente los principales puntos del modelo conductista de acuerdo con autores como Ormrod y Woolfolk, así como teóricos clave como Thorndike, Skinner, Pavlov y Guthrie. También incluye mapas conceptuales que resumen los modelos conductista y cognitivo. Finalmente, concluye que ambos modelos son complementarios y que el aprendiz
Custom Facts - Raleigh Puppet User Group 2016Jere Julian
This document discusses custom facts in Puppet - facts that provide additional system information beyond built-in facts. It covers creating custom facts using Ruby code in modules to parse data like the hostname, using confinement to restrict facts to certain operating systems, returning facts as structured data or strings, setting fact precedence, and aggregating facts. Examples are provided of custom facts to extract the datacenter from a hostname and return LLDP neighbor information on Arista switches.
This document provides a review for a 2nd 9 weeks exam and covers the following topics:
- Disclaimers emphasizing the importance of repeated study over simply copying answers
- Chapter reviews covering topics like operations with integers, solving equations, ratios and proportions, percent problems, and geometry formulas
- Sample problems worked through each concept
- Reminders about proportional relationships and using graphs to determine proportionality
- Well wishes for the final exam
Kamal Al-Sukhun has over 20 years of experience as a telecommunications and security supervisor, specializing in CCTV, satellite, fiber optics, and networking systems. He currently works at Qatar Foundation supervising maintenance and support of security systems. Previously he held senior roles installing and troubleshooting communications infrastructure for Ras Gas and utilities in Jordan.
This document provides instructions for installing and configuring the Language Translator extension for Magento 2. It allows translating product, category, CMS page and review content from one language to another using Google Translate API. The summary is:
The document outlines the installation process for the Language Translator extension via manual file upload or composer. It describes configuring translation settings including enabling the extension, adding the Google API key, selecting languages and fields to translate. It provides instructions for translating product, category, CMS page and review content individually or in batches.
To understand the basic features and functions to create and debug a project in CCS v3.3
To get familar with CCS v3.3
More in-depth explanations of Code Composer Studio’s various features .
Ex: Breakpoints,watch window, single stepping, memory etc..,
Finally, you will able to work with CCS v3.3
The document provides steps for using the debugger and profiler in NetBeans 6.0. [1] It describes setting breakpoints, stepping through code, and viewing variables to debug a simple program. [2] It then demonstrates profiling the same program to monitor execution time and memory usage. [3] Adding a line of code that creates Date objects without disposing of them showed how this could lead to memory leak issues.
A IBM® Debug Tool for z/OS® permite examinar, monitorar e controlar a execução de programas C, C++, COBOL e PL/I. Esse programa sofisticado fornece múltiplos pontos de interrupção condicionais e não condicionais, depuração em modo de etapas e a capacidade de monitorar e atualizar variáveis e armazenamento. A Debug Tool é uma ferramenta de depuração de nível de origem interativa para aplicativos compilados em uma variedade de ambientes de desenvolvimento.
Keil uVision is an integrated development environment (IDE) that provides a single solution for coding, building, debugging and flashing programs onto microcontrollers. The debugger in Keil uVision allows users to observe registers, memory, ports and peripherals, set breakpoints, monitor code execution and modify variables. It displays the disassembly code, assembly/high level code, registers and memory to help debug programs on a simulator.
Dynamic debugging in 8085 microprocessorRamaPrabha24
The document discusses dynamic debugging in the 8085 microprocessor. It describes how a debugger helps debug programs by allowing checking of register and memory contents during execution, altering contents, and setting breakpoints. Dynamic debugging checks for errors by observing instruction execution, using tools like single-stepping, register examination, and breakpoints. Single-stepping executes one instruction at a time to check addresses, codes, and flag status. Register examination displays register contents. Breakpoints execute a program in sections to isolate errors. Sample addition and subtraction programs are provided.
This document discusses how to debug a MuleSoft program. It explains how to run a program in debug mode using the Mule Debug perspective. It notes potential issues like ports that could prevent debugging and provides solutions. It also describes how to set breakpoints and use the debugger to analyze message properties, evaluate expressions, and step through processors. The next session topic will be filters and references are provided.
The document discusses the benefits of exercise for mental health. Regular physical activity can help reduce anxiety and depression and improve mood and cognitive function. Exercise causes chemical changes in the brain that may help protect against mental illness and improve symptoms.
This document summarizes the development of cardiac mesoderm from lateral plate mesoderm. It discusses how signaling pathways like BMP, Wnt, and noggin regulate this process through inhibition and activation of genes. BMP activates Mesp1, which inhibits Wnt and allows cardiac mesoderm to form. Noggin inhibits BMP to allow mmp-3 to activate cardiac genes. The current model has gaps, like how noggin increases mmp-3. Future experiments aim to fill these gaps, like seeing cardiogenesis without BMP or noggin.
The document discusses the benefits of exercise for mental health. Regular physical activity can help reduce anxiety and depression and improve mood and cognitive functioning. Exercise causes chemical changes in the brain that may help boost feelings of calmness and well-being.
This document discusses three major subfields in computer graphics: geometry, animation, and rendering. It also lists Autodesk Maya and Pixologic ZBrush as examples of software for polygonal modeling and sculpture modeling respectively. Performance capture, key frame animation, and simulation are provided as examples of techniques for animation.
Climate Ready Boston: Projection Consensus Summary Patrick Murray
The document summarizes climate projections for Boston from a working group of regional climate scientists. It finds that Boston will see increasing extreme temperatures, heavy precipitation, and sea level rise over the course of the 21st century depending on global greenhouse gas emission levels. Temperatures are projected to rise by over 10 degrees Fahrenheit by 2100 under a high emissions scenario, bringing many more days over 90 degrees each summer. Sea level is projected to rise up to 4 feet by 2070 and over 7 feet by 2100 under a high emissions scenario, increasing coastal flooding and beach erosion. Heavy rainfall events are also expected to continue increasing in frequency and intensity.
The document discusses the benefits of exercise for mental health. Regular physical activity can help reduce anxiety and depression and improve mood and cognitive function. Exercise causes chemical changes in the brain that may help protect against mental illness and improve symptoms.
Este documento presenta un resumen de las teorías conductista y cognitiva del aprendizaje. Explica que el aprendizaje debe basarse en una teoría para su implementación correcta. Luego describe brevemente los principales puntos del modelo conductista de acuerdo con autores como Ormrod y Woolfolk, así como teóricos clave como Thorndike, Skinner, Pavlov y Guthrie. También incluye mapas conceptuales que resumen los modelos conductista y cognitivo. Finalmente, concluye que ambos modelos son complementarios y que el aprendiz
Custom Facts - Raleigh Puppet User Group 2016Jere Julian
This document discusses custom facts in Puppet - facts that provide additional system information beyond built-in facts. It covers creating custom facts using Ruby code in modules to parse data like the hostname, using confinement to restrict facts to certain operating systems, returning facts as structured data or strings, setting fact precedence, and aggregating facts. Examples are provided of custom facts to extract the datacenter from a hostname and return LLDP neighbor information on Arista switches.
This document provides a review for a 2nd 9 weeks exam and covers the following topics:
- Disclaimers emphasizing the importance of repeated study over simply copying answers
- Chapter reviews covering topics like operations with integers, solving equations, ratios and proportions, percent problems, and geometry formulas
- Sample problems worked through each concept
- Reminders about proportional relationships and using graphs to determine proportionality
- Well wishes for the final exam
Kamal Al-Sukhun has over 20 years of experience as a telecommunications and security supervisor, specializing in CCTV, satellite, fiber optics, and networking systems. He currently works at Qatar Foundation supervising maintenance and support of security systems. Previously he held senior roles installing and troubleshooting communications infrastructure for Ras Gas and utilities in Jordan.
This document provides instructions for installing and configuring the Language Translator extension for Magento 2. It allows translating product, category, CMS page and review content from one language to another using Google Translate API. The summary is:
The document outlines the installation process for the Language Translator extension via manual file upload or composer. It describes configuring translation settings including enabling the extension, adding the Google API key, selecting languages and fields to translate. It provides instructions for translating product, category, CMS page and review content individually or in batches.
To understand the basic features and functions to create and debug a project in CCS v3.3
To get familar with CCS v3.3
More in-depth explanations of Code Composer Studio’s various features .
Ex: Breakpoints,watch window, single stepping, memory etc..,
Finally, you will able to work with CCS v3.3
The document provides steps for using the debugger and profiler in NetBeans 6.0. [1] It describes setting breakpoints, stepping through code, and viewing variables to debug a simple program. [2] It then demonstrates profiling the same program to monitor execution time and memory usage. [3] Adding a line of code that creates Date objects without disposing of them showed how this could lead to memory leak issues.
A IBM® Debug Tool for z/OS® permite examinar, monitorar e controlar a execução de programas C, C++, COBOL e PL/I. Esse programa sofisticado fornece múltiplos pontos de interrupção condicionais e não condicionais, depuração em modo de etapas e a capacidade de monitorar e atualizar variáveis e armazenamento. A Debug Tool é uma ferramenta de depuração de nível de origem interativa para aplicativos compilados em uma variedade de ambientes de desenvolvimento.
Keil uVision is an integrated development environment (IDE) that provides a single solution for coding, building, debugging and flashing programs onto microcontrollers. The debugger in Keil uVision allows users to observe registers, memory, ports and peripherals, set breakpoints, monitor code execution and modify variables. It displays the disassembly code, assembly/high level code, registers and memory to help debug programs on a simulator.
Dynamic debugging in 8085 microprocessorRamaPrabha24
The document discusses dynamic debugging in the 8085 microprocessor. It describes how a debugger helps debug programs by allowing checking of register and memory contents during execution, altering contents, and setting breakpoints. Dynamic debugging checks for errors by observing instruction execution, using tools like single-stepping, register examination, and breakpoints. Single-stepping executes one instruction at a time to check addresses, codes, and flag status. Register examination displays register contents. Breakpoints execute a program in sections to isolate errors. Sample addition and subtraction programs are provided.
This document discusses how to debug a MuleSoft program. It explains how to run a program in debug mode using the Mule Debug perspective. It notes potential issues like ports that could prevent debugging and provides solutions. It also describes how to set breakpoints and use the debugger to analyze message properties, evaluate expressions, and step through processors. The next session topic will be filters and references are provided.
This document discusses debugging fundamentals and provides an overview of different debuggers. It summarizes how debuggers like Immunity Debugger, WinDbg, and OllyDbg work to test and troubleshoot target programs. The document also introduces security fuzzers and describes how they work with debuggers to detect vulnerabilities by providing unexpected input data to programs and monitoring for exceptions or memory leaks. An example is provided of using the Immunity Debugger and Infigo FTPStress Fuzzer to analyze and attempt to crash an FTP server.
The document provides an overview of the basic construction of C programming language code. It discusses the typical sections included such as documentation, linking, symbolic constants, global declarations, the main function, and user-defined function definitions. Key points include that the main function contains declaration and executable sections, loops like while and for are used to repeat code blocks, and arrays allow declaring multiple variables of the same type in contiguous memory locations.
The document provides an overview of debugging in ABAP, including defining debugging, branching to debugging mode, key concepts such as breakpoints and watchpoints, examining and changing variables, and viewing contents of internal tables. It describes debugging modes, the debugging display, and the most important debugging functions such as single step, continue, breakpoint, watchpoint, and hexadecimal display. It also discusses setting breakpoints and watchpoints and using the ABAP debugger.
User exits allow customers to customize SAP functionality without modifying core SAP code. There are different types of user exits including function module exits, menu exits, screen exits, and field exits. Function module exits are called via function modules and allow custom code to be added to include programs. Menu exits can be used to add custom menu items. Screen exits define custom subscreens that can be added to standard SAP screens. Field exits trigger custom code for specific fields.
The document discusses an interactive debugging system. It describes debugging functions like breakpoints, conditional expressions, and program tracing. It also covers capabilities like program display, unit testing, and handling optimized code. The system must be language-independent and interface with language translators. It should integrate with the runtime environment and production system securely. The user interface criteria include friendly menus, commands, and help for debugging programs efficiently across different languages.
Language Translator Magento 2 ExtensionBiztech Store
Magento 2 Language Translator helps you translate product attributes, CMS pages along with CMS blocks, meta title & description, product reviews, tags and many more parts of store content. With Language translator, mass language translation of store content is possible as well. See More Details: https://store.biztechconsultancy.com/magento2-language-translator-extension.htm
The document discusses different modularization techniques in ABAP including macros, include programs, subroutines, function groups, and function modules. It provides details on how each technique works, how to define and call them, and how to pass parameters. Modularization makes ABAP programs easier to maintain, reuse code, and avoid redundancy.
A View of MPC Control from Operations to DesignJim Cahill
The document provides an overview of the various display, navigation, and configuration options available in a DeltaV system. It describes how users can access alarms, loop details, MPC variables, trends, and engineering environments with the appropriate privileges. Composite blocks and drilling down/backing out of block configurations are also summarized.
This document provides an outline and overview of an introductory Visual Basic for Applications course in Microsoft Access. The course covers event-driven programming, the VBA language, and working with data programmatically. The outline includes sessions on event programming, VBA constructs, variables, data types, modules, functions, procedures, and built-in functions. Interactive exercises are provided to help learners practice creating and calling functions and procedures.
This document provides instructions for a laboratory activity that introduces students to assembly language programming. It discusses using tools like a text editor, assembler, linker, and debugger to write, assemble, link, and debug assembly language programs. The activity has students write two short programs - one that moves values into registers, and one that performs a multiplication in a loop. It guides them on running the programs in an debugger to observe the results and make modifications to test changes. The conclusion asks students to explain what the multiplication program does and note any observations from changing a constant value.
Similar to Abapdebuggingfrombasictoadvance 140214043218-phpapp01 (20)
This document provides an overview of wound healing, its functions, stages, mechanisms, factors affecting it, and complications.
A wound is a break in the integrity of the skin or tissues, which may be associated with disruption of the structure and function.
Healing is the body’s response to injury in an attempt to restore normal structure and functions.
Healing can occur in two ways: Regeneration and Repair
There are 4 phases of wound healing: hemostasis, inflammation, proliferation, and remodeling. This document also describes the mechanism of wound healing. Factors that affect healing include infection, uncontrolled diabetes, poor nutrition, age, anemia, the presence of foreign bodies, etc.
Complications of wound healing like infection, hyperpigmentation of scar, contractures, and keloid formation.
ISO/IEC 27001, ISO/IEC 42001, and GDPR: Best Practices for Implementation and...PECB
Denis is a dynamic and results-driven Chief Information Officer (CIO) with a distinguished career spanning information systems analysis and technical project management. With a proven track record of spearheading the design and delivery of cutting-edge Information Management solutions, he has consistently elevated business operations, streamlined reporting functions, and maximized process efficiency.
Certified as an ISO/IEC 27001: Information Security Management Systems (ISMS) Lead Implementer, Data Protection Officer, and Cyber Risks Analyst, Denis brings a heightened focus on data security, privacy, and cyber resilience to every endeavor.
His expertise extends across a diverse spectrum of reporting, database, and web development applications, underpinned by an exceptional grasp of data storage and virtualization technologies. His proficiency in application testing, database administration, and data cleansing ensures seamless execution of complex projects.
What sets Denis apart is his comprehensive understanding of Business and Systems Analysis technologies, honed through involvement in all phases of the Software Development Lifecycle (SDLC). From meticulous requirements gathering to precise analysis, innovative design, rigorous development, thorough testing, and successful implementation, he has consistently delivered exceptional results.
Throughout his career, he has taken on multifaceted roles, from leading technical project management teams to owning solutions that drive operational excellence. His conscientious and proactive approach is unwavering, whether he is working independently or collaboratively within a team. His ability to connect with colleagues on a personal level underscores his commitment to fostering a harmonious and productive workplace environment.
Date: May 29, 2024
Tags: Information Security, ISO/IEC 27001, ISO/IEC 42001, Artificial Intelligence, GDPR
-------------------------------------------------------------------------------
Find out more about ISO training and certification services
Training: ISO/IEC 27001 Information Security Management System - EN | PECB
ISO/IEC 42001 Artificial Intelligence Management System - EN | PECB
General Data Protection Regulation (GDPR) - Training Courses - EN | PECB
Webinars: https://pecb.com/webinars
Article: https://pecb.com/article
-------------------------------------------------------------------------------
For more information about PECB:
Website: https://pecb.com/
LinkedIn: https://www.linkedin.com/company/pecb/
Facebook: https://www.facebook.com/PECBInternational/
Slideshare: http://www.slideshare.net/PECBCERTIFICATION
How to Make a Field Mandatory in Odoo 17Celine George
In Odoo, making a field required can be done through both Python code and XML views. When you set the required attribute to True in Python code, it makes the field required across all views where it's used. Conversely, when you set the required attribute in XML views, it makes the field required only in the context of that particular view.
Beyond Degrees - Empowering the Workforce in the Context of Skills-First.pptxEduSkills OECD
Iván Bornacelly, Policy Analyst at the OECD Centre for Skills, OECD, presents at the webinar 'Tackling job market gaps with a skills-first approach' on 12 June 2024
বাংলাদেশের অর্থনৈতিক সমীক্ষা ২০২৪ [Bangladesh Economic Review 2024 Bangla.pdf] কম্পিউটার , ট্যাব ও স্মার্ট ফোন ভার্সন সহ সম্পূর্ণ বাংলা ই-বুক বা pdf বই " সুচিপত্র ...বুকমার্ক মেনু 🔖 ও হাইপার লিংক মেনু 📝👆 যুক্ত ..
আমাদের সবার জন্য খুব খুব গুরুত্বপূর্ণ একটি বই ..বিসিএস, ব্যাংক, ইউনিভার্সিটি ভর্তি ও যে কোন প্রতিযোগিতা মূলক পরীক্ষার জন্য এর খুব ইম্পরট্যান্ট একটি বিষয় ...তাছাড়া বাংলাদেশের সাম্প্রতিক যে কোন ডাটা বা তথ্য এই বইতে পাবেন ...
তাই একজন নাগরিক হিসাবে এই তথ্য গুলো আপনার জানা প্রয়োজন ...।
বিসিএস ও ব্যাংক এর লিখিত পরীক্ষা ...+এছাড়া মাধ্যমিক ও উচ্চমাধ্যমিকের স্টুডেন্টদের জন্য অনেক কাজে আসবে ...
1. Starting abap debugging
1. Putting /H in command box and hitting execute button
2. Setting breakpoint in program.
Difference among F5 , F6 ,F7 and F8
F5: debug in single step (line by line)
F6: Skips Subroutines/FM
Whenever a control encounters a subroutine or FM debug them unlike F5
F7: controls return to main program from Subroutines & FM
F8: executes program until next break point.
Breakpoint Types
1. Debugger breakpoint:
When you set a breakpoint in the Debugger, it is created as a debugger breakpoint by default. A
debugger breakpoint is only valid while the Debugger instance, in which it was set, is active. When the
Debugger is closed, all debugger breakpoints set in it are deleted.
2. Session breakpoint:
If you set a breakpoint in the ABAP Editor, for example, this breakpoint is a session breakpoint. Session
breakpoints remain active independently of the existence of a Debugger and are valid for all external
sessions of a logon. Within the Debugger, you can convert a debugger breakpoint into a session
breakpoint and vice versa.
If the setting Session Breakpoints Active Immediately is checked
(via Utilities → Settings → ABAP Editor → Debugging in the ABAP Editor or Object Navigator), you can
set a session breakpoint in an external session of a logon to force a running program into the Debugger
that runs in the same logon (for example, in an external session) and will process the point at which the
session breakpoint was set.
3. User breakpoints:
User breakpoints (previously known as external breakpoints) are valid for all user logons on the current
server of the current system. User breakpoints are specifically required when debugging BSP or Web
Dynpro applications. In these cases, you do not log on using the SAP GUI but via a browser, for example.
Therefore, any breakpoints must be set before logging on.
User breakpoints are only valid for a period of 2 hours.
As of Release 7.00, user breakpoints set for BSP or Web Dynpro applications are also valid for SAP GUI
logons.
2. Within the Debugger, you can convert debugger or session breakpoints into user breakpoints and vice
versa.
We can create maximum 30 breakpoints only.
System Debugging
If you set this option, the Debugger is also activated for system programs (programs with status S in their
program attributes). When you save breakpoints, the System Debugging setting is also saved.
Update Debugging
Update function modules do not run in the same user session as the program that is currently running in
the ABAP Debugger. These function modules are therefore not included in debugging. Only if you select
the Update Debugging option you can display and debug them after the COMMIT WORK.
3. Remote abap debugging
1.
Open the Function module/ Proxy class and set an external break-point. Execute the transaction code
“SRDEBUG” (Note: this tcode is available only in ECC 6.0 system onwards)
Click on the button Activate Debugging. A pop-up screen will be opened. Fill the User-ID with which
break-point has been set. (The same user-id should be used as authentication data in the XI while
creating RFC communication channel). Select the radio buttons “all Appl. Servers” and “External
breakpoints already set”. Click on OK.
4. Another pop-up will be opened with a message “End debugging?” Leave the pop-up as it is. (Don’t close
the transaction).
When you run transaction in source system debugger will start in target system where SRDEBUG
transaction is set
5. 2.
For example we are calling an RFC enabled FM in ECC system from CRM system.
Scenario 1: Calling a custom RFC FM
1: Add an infinite loop in the remote custom Function Module (adding a “DO. ENDDO.” statement at
the start of the FM would be enough).
2: Execute your program in the CRM system. The execution stops at the RFC call, because of the
infinite loop.
3: login to the ECC system and go to transaction SM50. Select the process which is executing
the RFC and navigate to the menu: “Program/Session->Program->Debugging” this triggers the debugger
Session in a separate window.
Scenario 2: Calling a Standard RFC FM
When we are debugging a standard program we cannot add the infinite loop, hence we cannot go to
SM50 and debug the work process. The RFC destination for the ECC system has a User specified, the
RFC function module gets executed using this users credentials. Usually the basis team set up the RFC
user as non Dialog user, this does not allow debugging. Contact your Basis team and get this changed to
a dialog user enabling you to debug RFC function calls via the normal debugger.
Debugging a Popup Window
Sometimes we might want to start debugging from a popup window / information message, in this case
we cannot type "/h" as the “OK Code” box is not available.
Method 1: From any SAP windows press the “Customize Local Layout” button (Alt + F12) and select
“Create Shortcut…” Select system command in Type and and put /h in Command Provide desktop in
location and click on finish. A file is generated on your desktop. Now drag the file onto the popup
window / information message or click on file and debugging is enabled!
6. Method 2: For this create a text file with .SAP extension on your desktop, and type the below lines into
the file:
7. [System]
Name= ECD
Description= ECD [host.com]
Client=100
[User]
Name= Username
Language=EN
[Function]
Title=
Command=/H
Type=SystemCommand
[Configuration]
WorkDir=C:Documents and SettingsJohnSapWorkDir
[Options]
Reuse=1
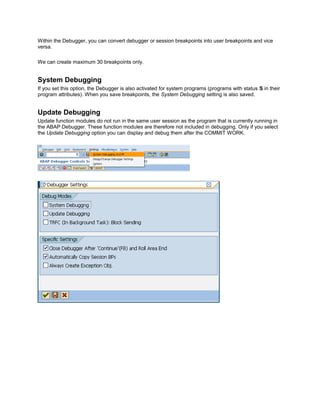
Debugging background job
1. To debug active background process Go to the transaction SM37 and select the background job (with
job status ‘Active’) that you want to debug. Now select ‘Capture: active job’ from menu ‘Job’,
2. Also you can do the same from transaction SM50. Select the work process where this job is running
and then choose the menu path Program/ModeProgramDebugging.
3. To debug completed background process select job in SM37 and write 'JDBG' in command prompt and
press enter. You will be in debug mode. Press F7 couple of time until you get into the code.
8. Watchpoints
Watchpoints allow you the option of monitoring the content of individual variables. The Debugger stops as
soon as the value of the monitored variable changes. In addition, conditions can be specified. The
Debugger also checks whether such a condition is fulfilled.
Like a breakpoint, a watchpoint is an indicator in a program that tells the ABAP runtime processor to
interrupt the program at a particular point. Unlike breakpoints, however, watchpoints are not activated
until the contents of a specified field change. Watchpoints, like dynamic breakpoints, are user-specific,
and so do not affect other users running the same program. You can only define watchpoints in the
Debugger.
Use
You set watchpoints in the Debugger to monitor the contents of specific fields. They inform you when the value of a
field changes. When the value changes, the Debugger interrupts the program.
We can create maximum 24 watchpoints in a session
Creating a Watchpoint
In the toolbar of the New Debugger, you will find the pushbutton Create Watchpoint . It brings
you to the dialog box Create Watchpoint.
Using this function, you can enter the variable to be monitored.
All possible ABAP data structures are allowed here.
9. Watchpoint is reached
After you have created the watchpoint, the value of the variable will be monitored.
As soon as a change is found in the content of the variable after a Debug step and any conditions set
have been met, the Debugger will stop and you see the message "Watchpoint is reached
(<Watchpointvariable>)“.
In the Breakpoints tool (desktop Breakpoints/Watchpoints / Tab Watchpoints), you can view this reached
watchpoint in detail.
The reached watchpoint is marked with a yellow arrow. The old and the new values of the watchpoint
variable are at your disposal.
In addition, you can use the pushbutton Compare Variables ( ) to determine the differences between
the old and the new variable.
In addition, you can maintain the watchpoint in this view – that is change, activate, deactivate, or delete it.
Validity Area for Watchpoints
In contrast to breakpoints, watchpoints are only valid locally in the roll area. If a roll area changes, none of
the watchpoints defined in the underlying roll area are visible. Also, watchpoints that were created in the
New ABAP Debugger cannot be used further in the Classic Debugger (for example, after changing the
Debugger) and vice versa.
10. To debug script:
Execute the report RSTXDBUG to activate the script debugger.
OR Goto SE71 and give your form name and go to Utilities-->Active De-bugger.
To debug Smart form:
1. One way to debug smart form is to debug the Function Module of that smart form.
Within PERFORM %GLOBAL_INIT node level coding can be found.
2. If you want to debug particular smart form node that the solution would be, insert a "Program Line" just
above the node you want to debug and this program line write a normal abap breakpoint.
3. SFTRACE can be used for debugging SMARTFORMS.
Go to tcode SFTRACE / SMARTFORM_TRACE --> click "trace on" and click checkboxes Warning/Error
under abap breakpoints tab.
So whenever you call the smart forms, it will stop at this breakpoint and you can debug onwards