Download as PDF, PPTX


![Design own monitoring (March 2016)
Jenkins Python InfluxDB
import influxdb
import jenkins
j = Jenkins(“jenkins.host”)
queue_info = j.get_queue_info()
for q in queue_info:
influx_server.push({“name”: q[‘job_name’],
“reason”: q[‘why’]})
API API](https://image.slidesharecdn.com/7-171114115524/75/CI-Jenkins-HERE-Technologies-23-2048.jpg)
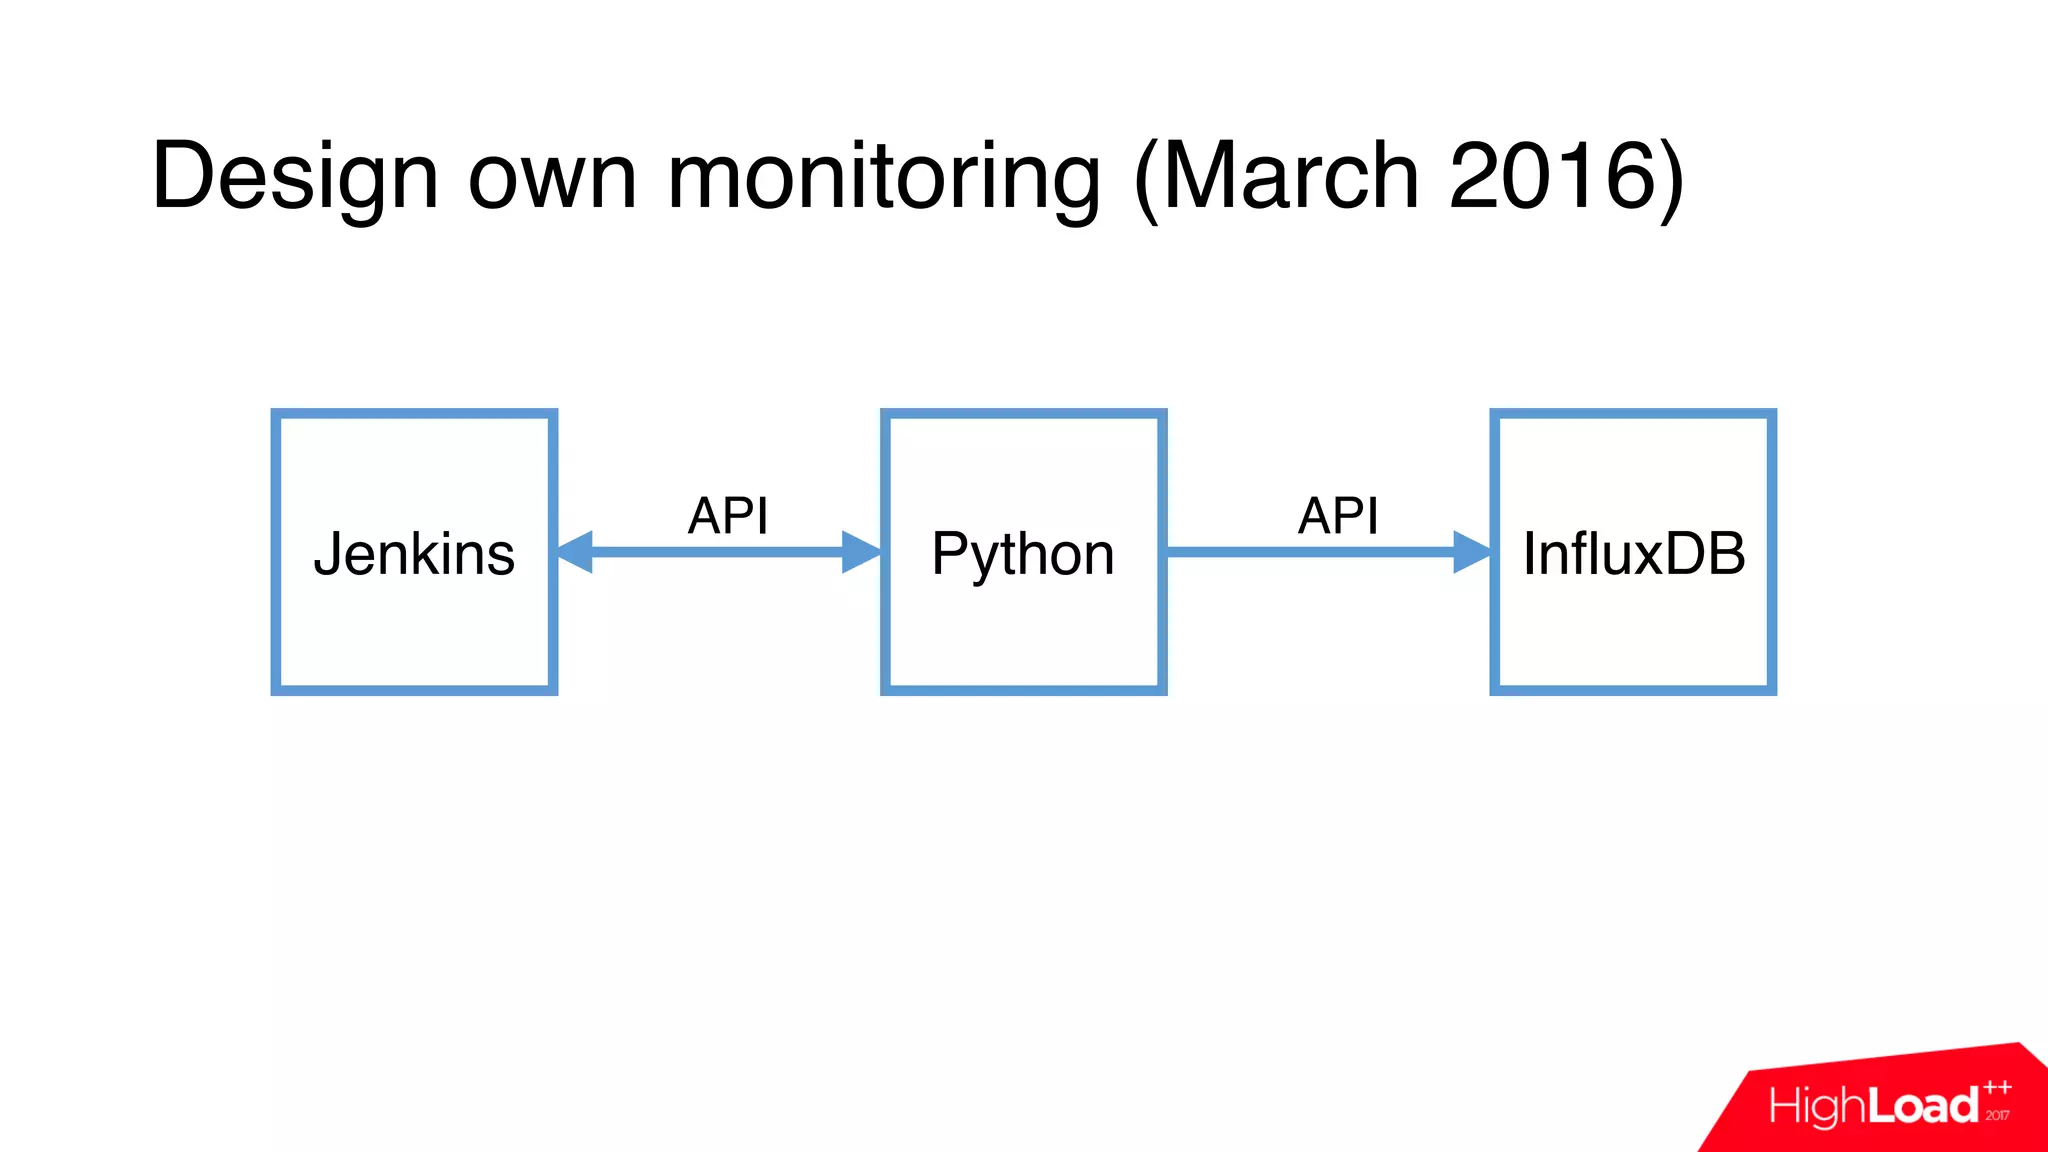
![Design own monitoring (March 2016)
Jenkins Python InfluxDB
import influxdb
import jenkins
j = Jenkins(“jenkins.host”)
queue_info = j.get_queue_info()
for q in queue_info:
influx_server.push({“name”: q[‘job_name’],
“reason”: q[‘why’]})
API API](https://image.slidesharecdn.com/7-171114115524/75/CI-Jenkins-HERE-Technologies-24-2048.jpg)
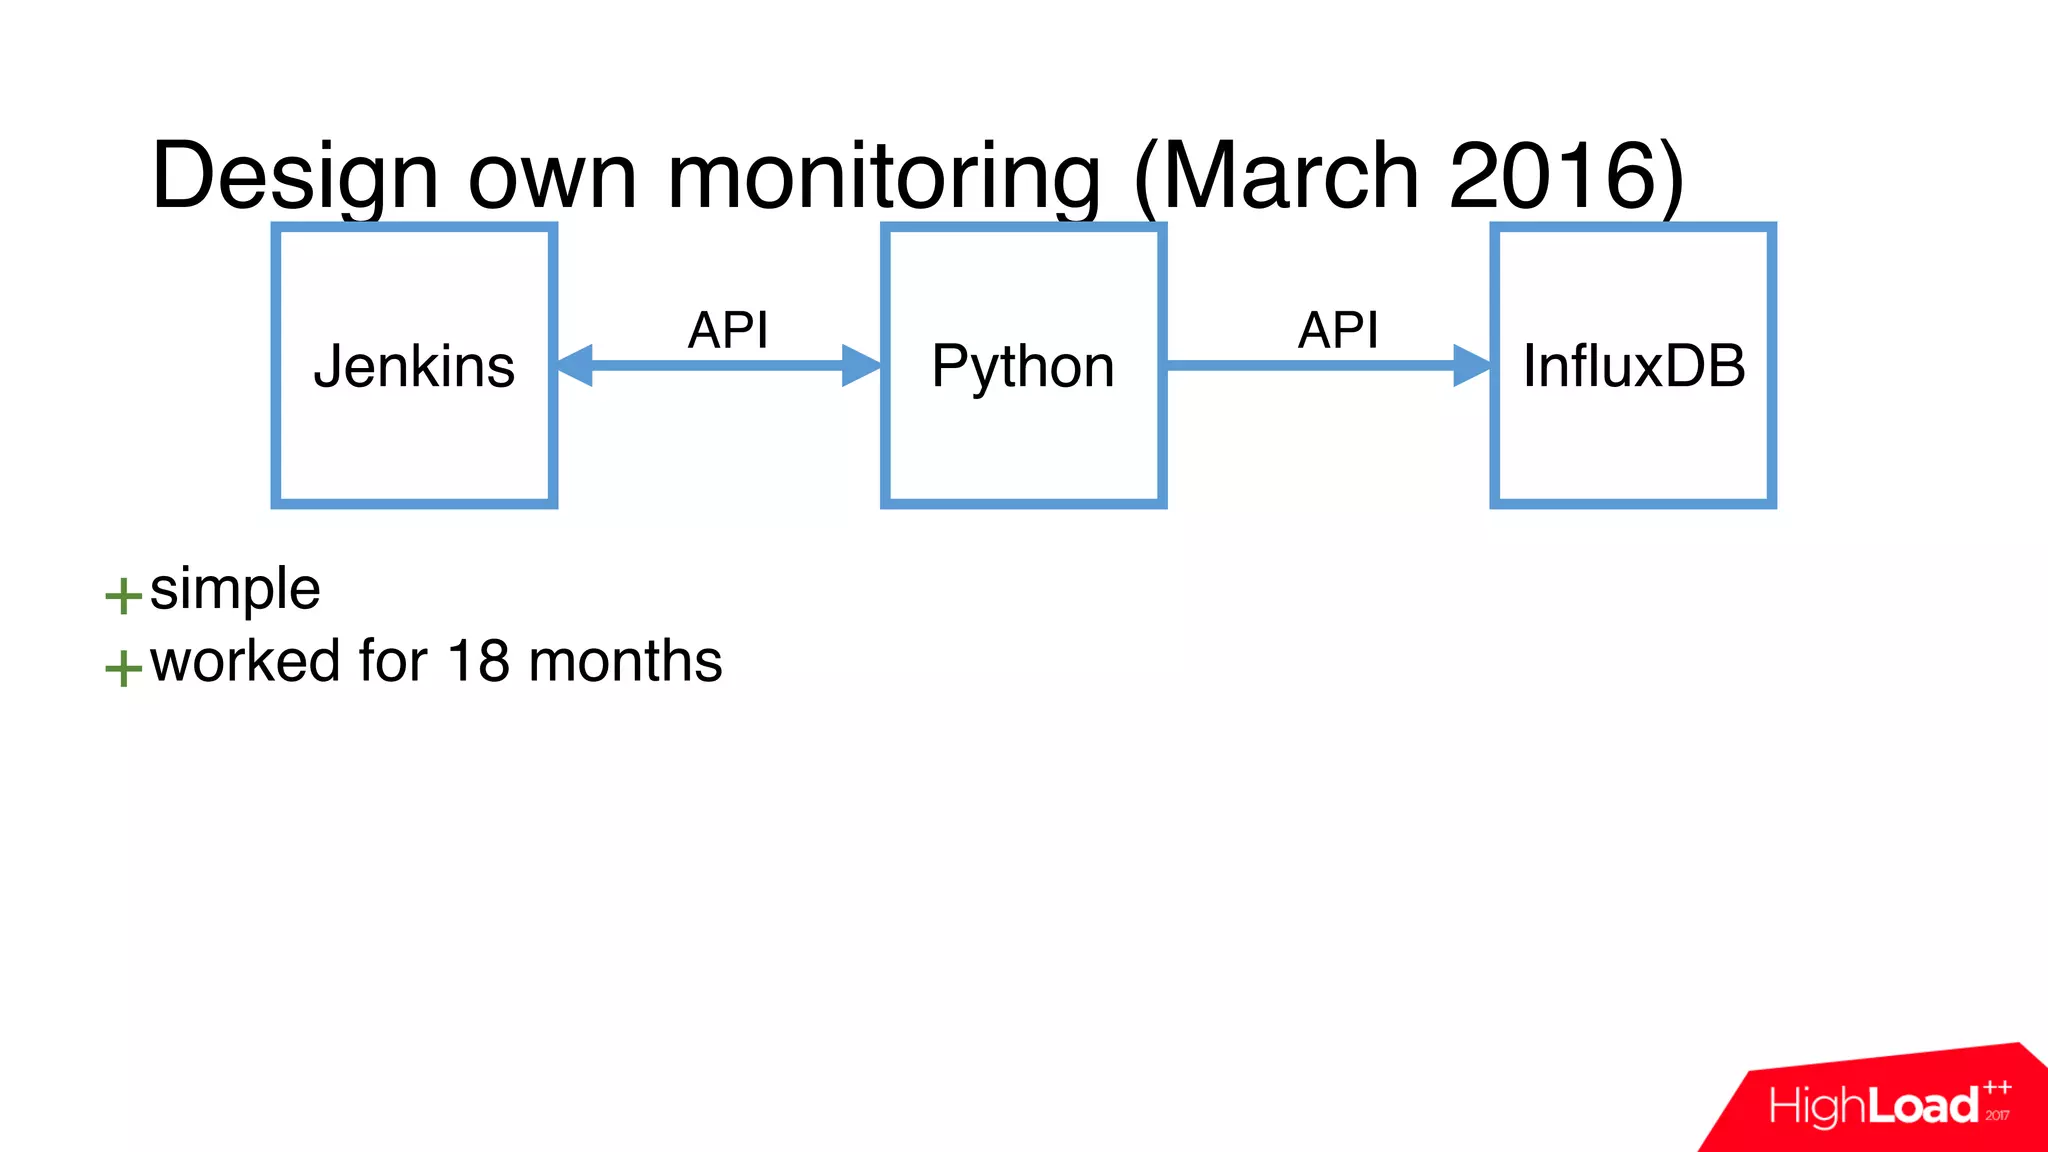
![Design own monitoring (March 2016)
Jenkins Python InfluxDB
import influxdb
import jenkins
j = Jenkins(“jenkins.host”)
queue_info = j.get_queue_info()
for q in queue_info:
influx_server.push({“name”: q[‘job_name’],
“reason”: q[‘why’]})
API API](https://image.slidesharecdn.com/7-171114115524/75/CI-Jenkins-HERE-Technologies-25-2048.jpg)


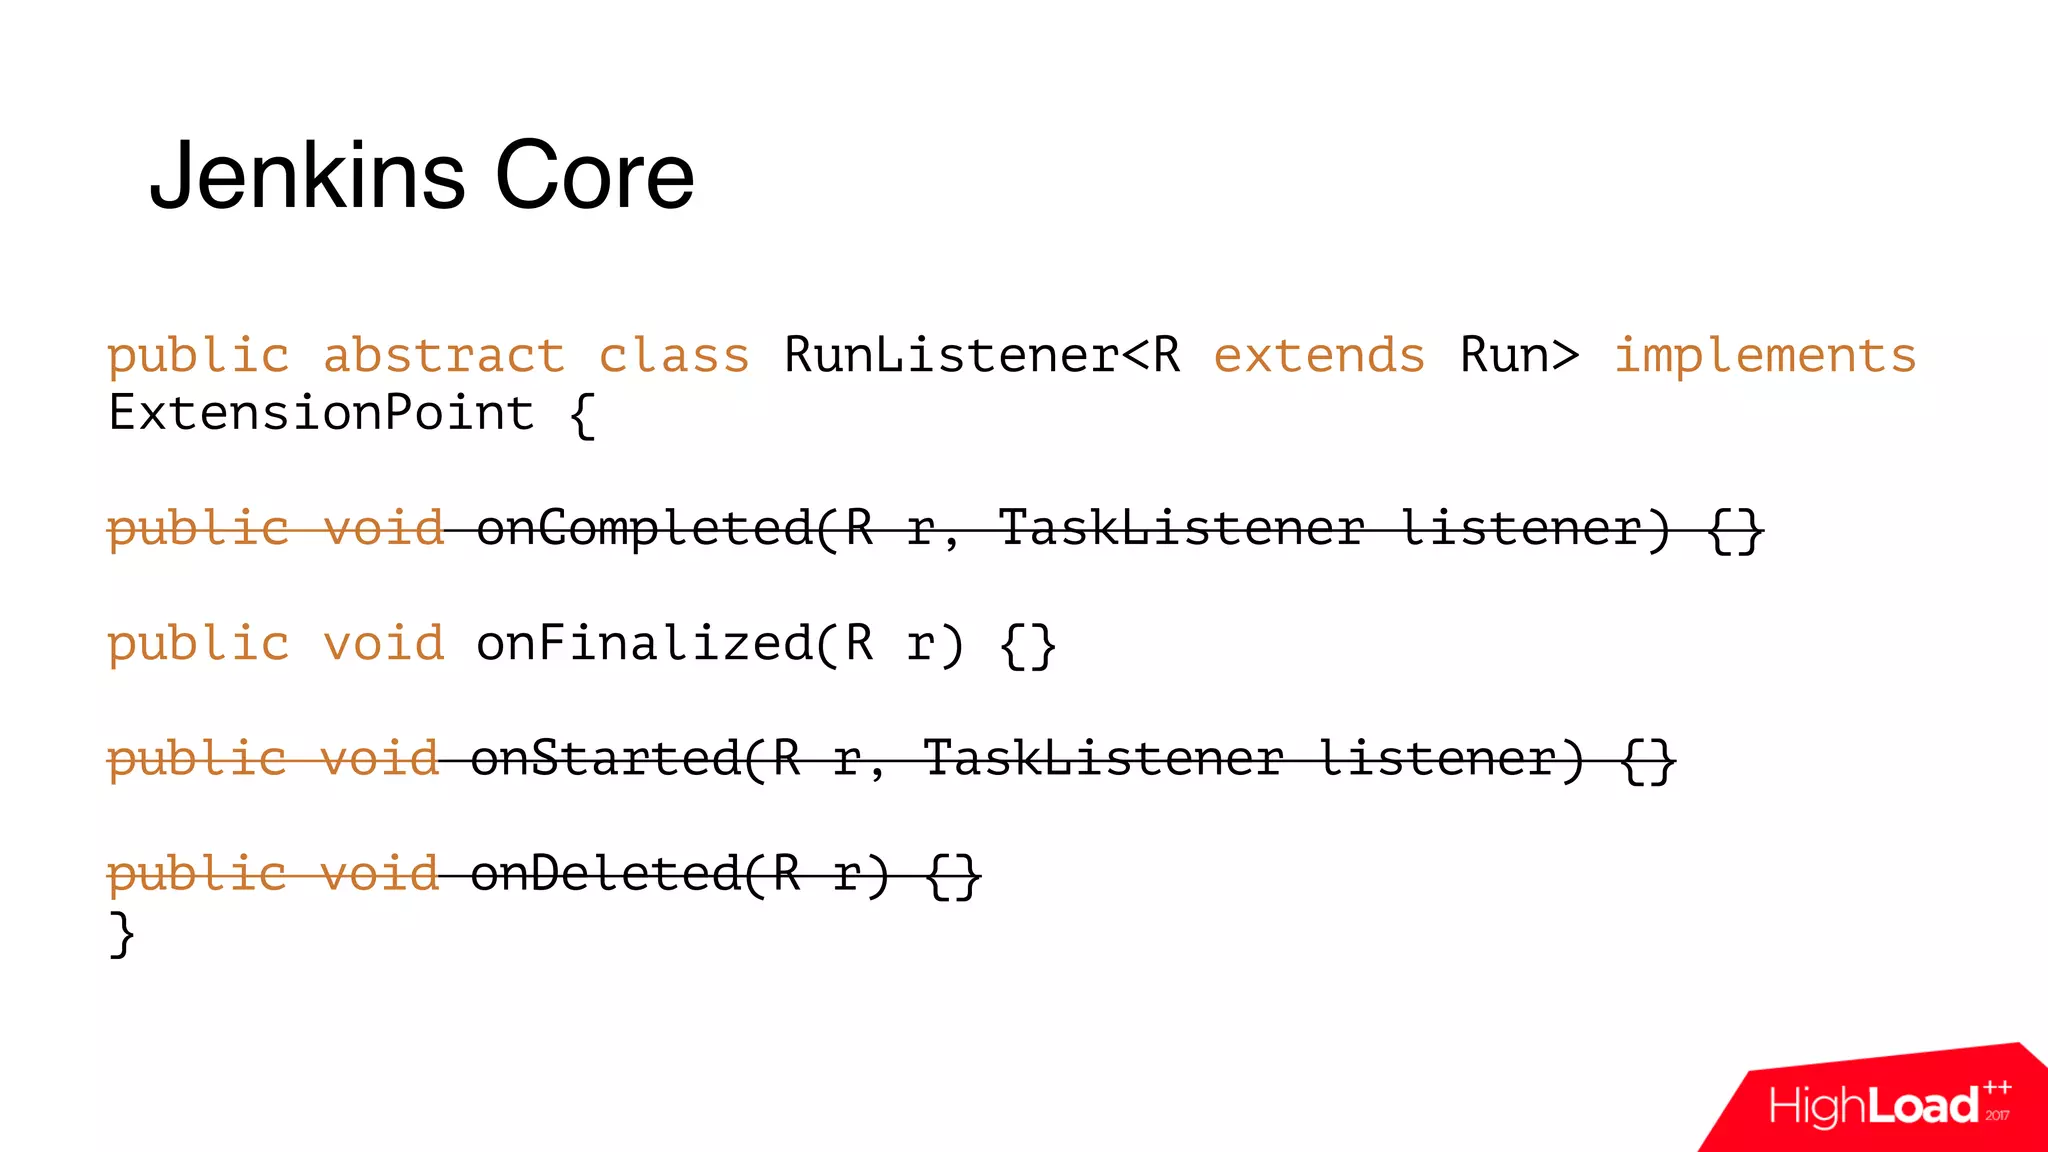


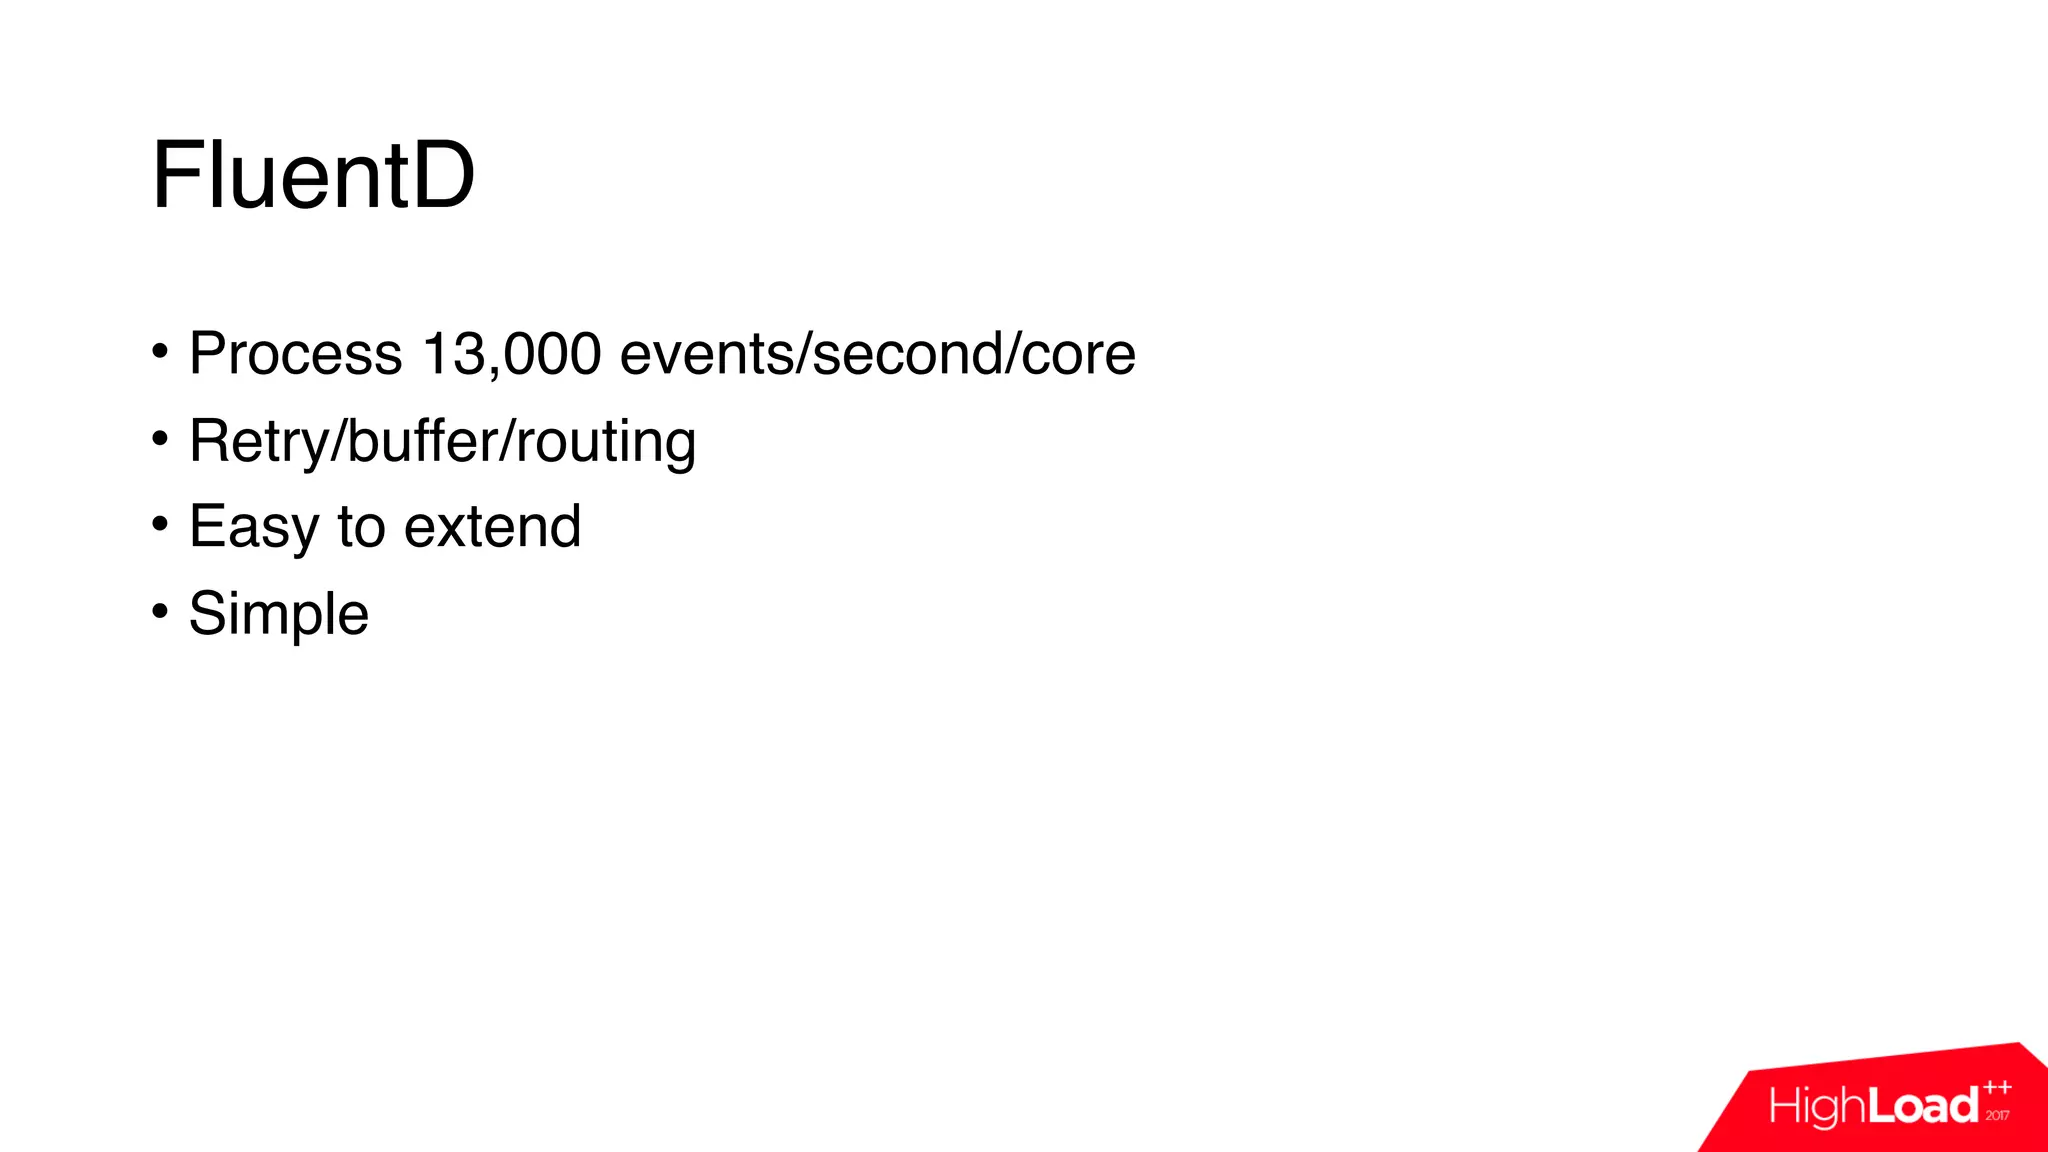


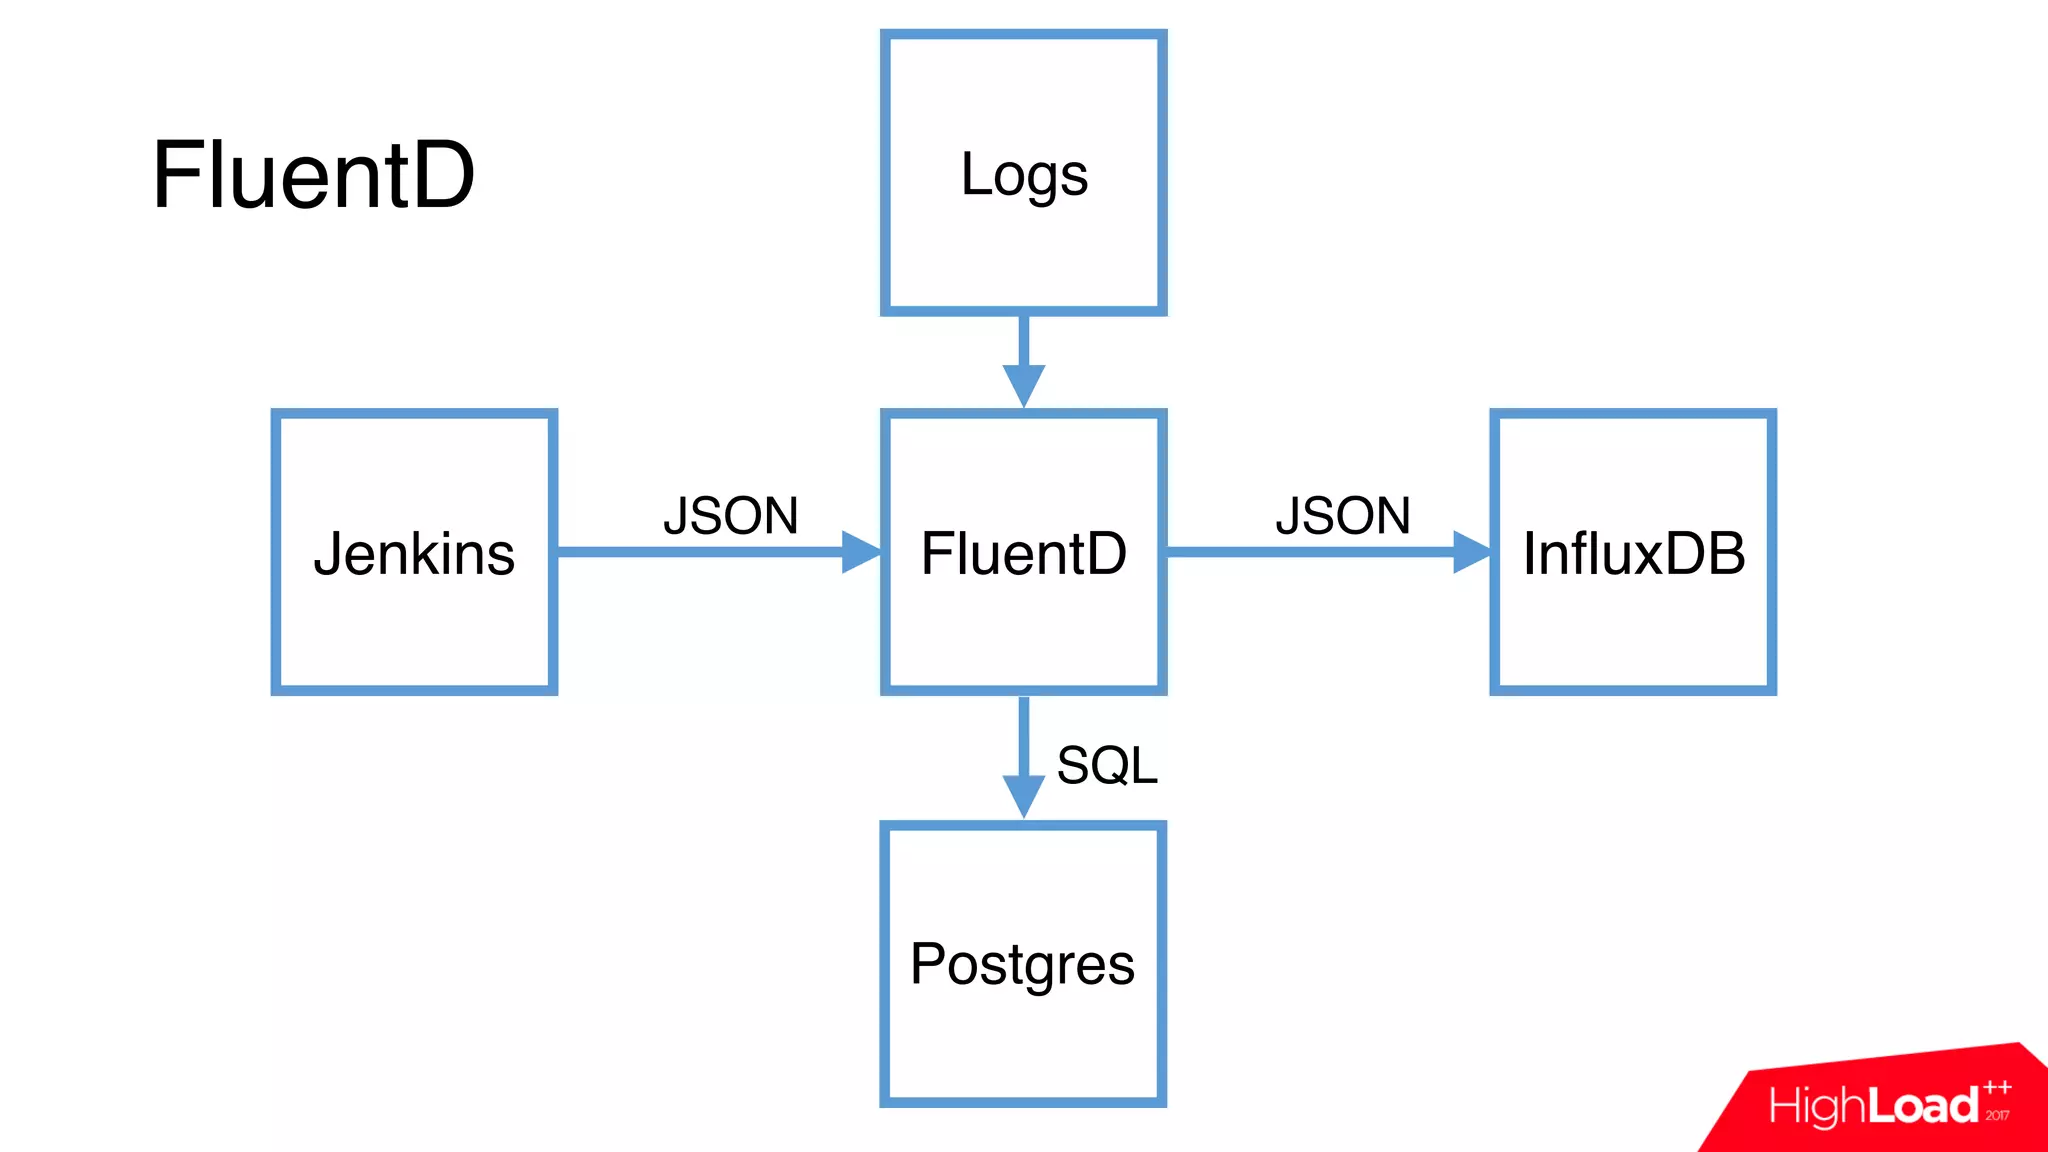


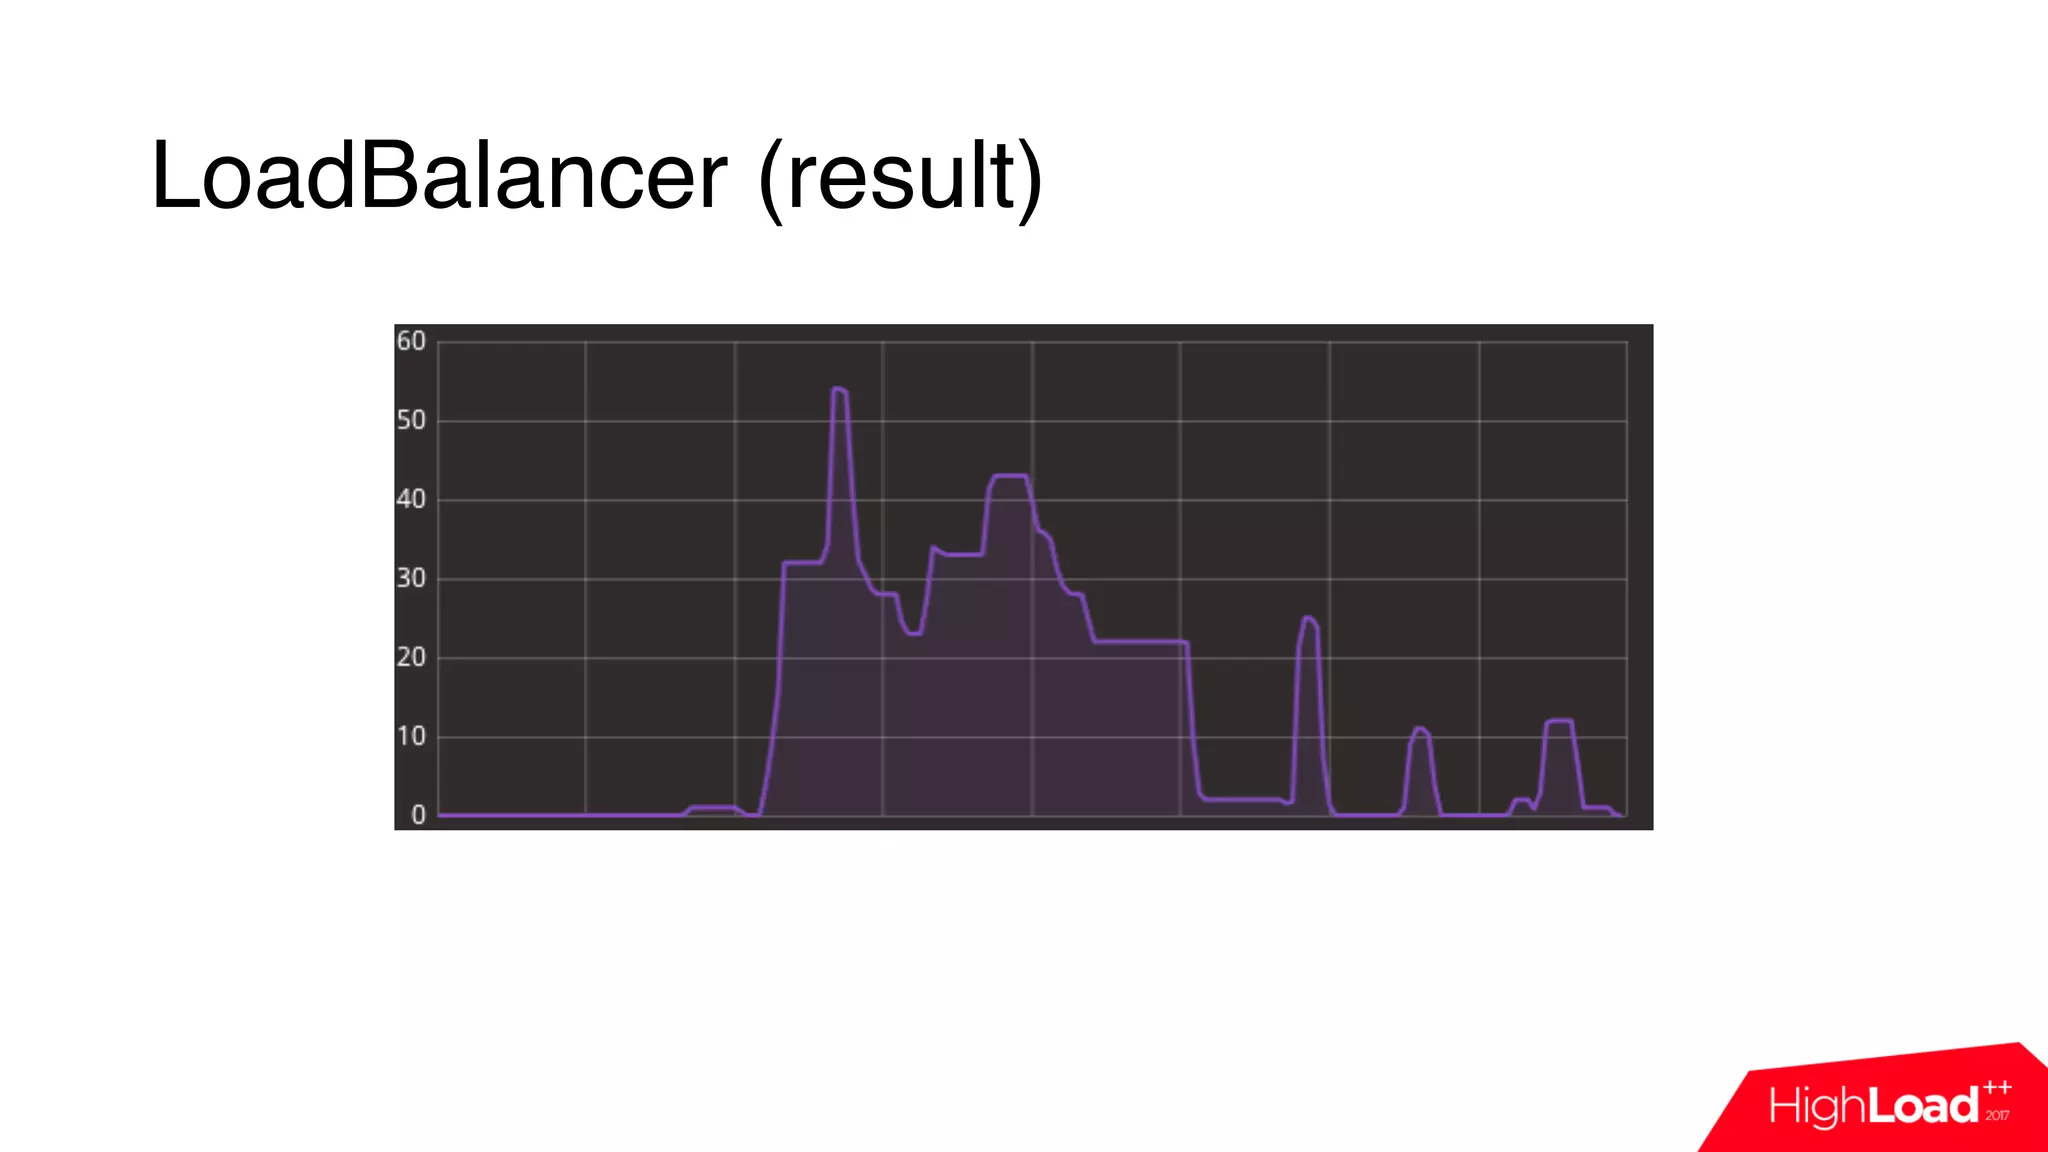

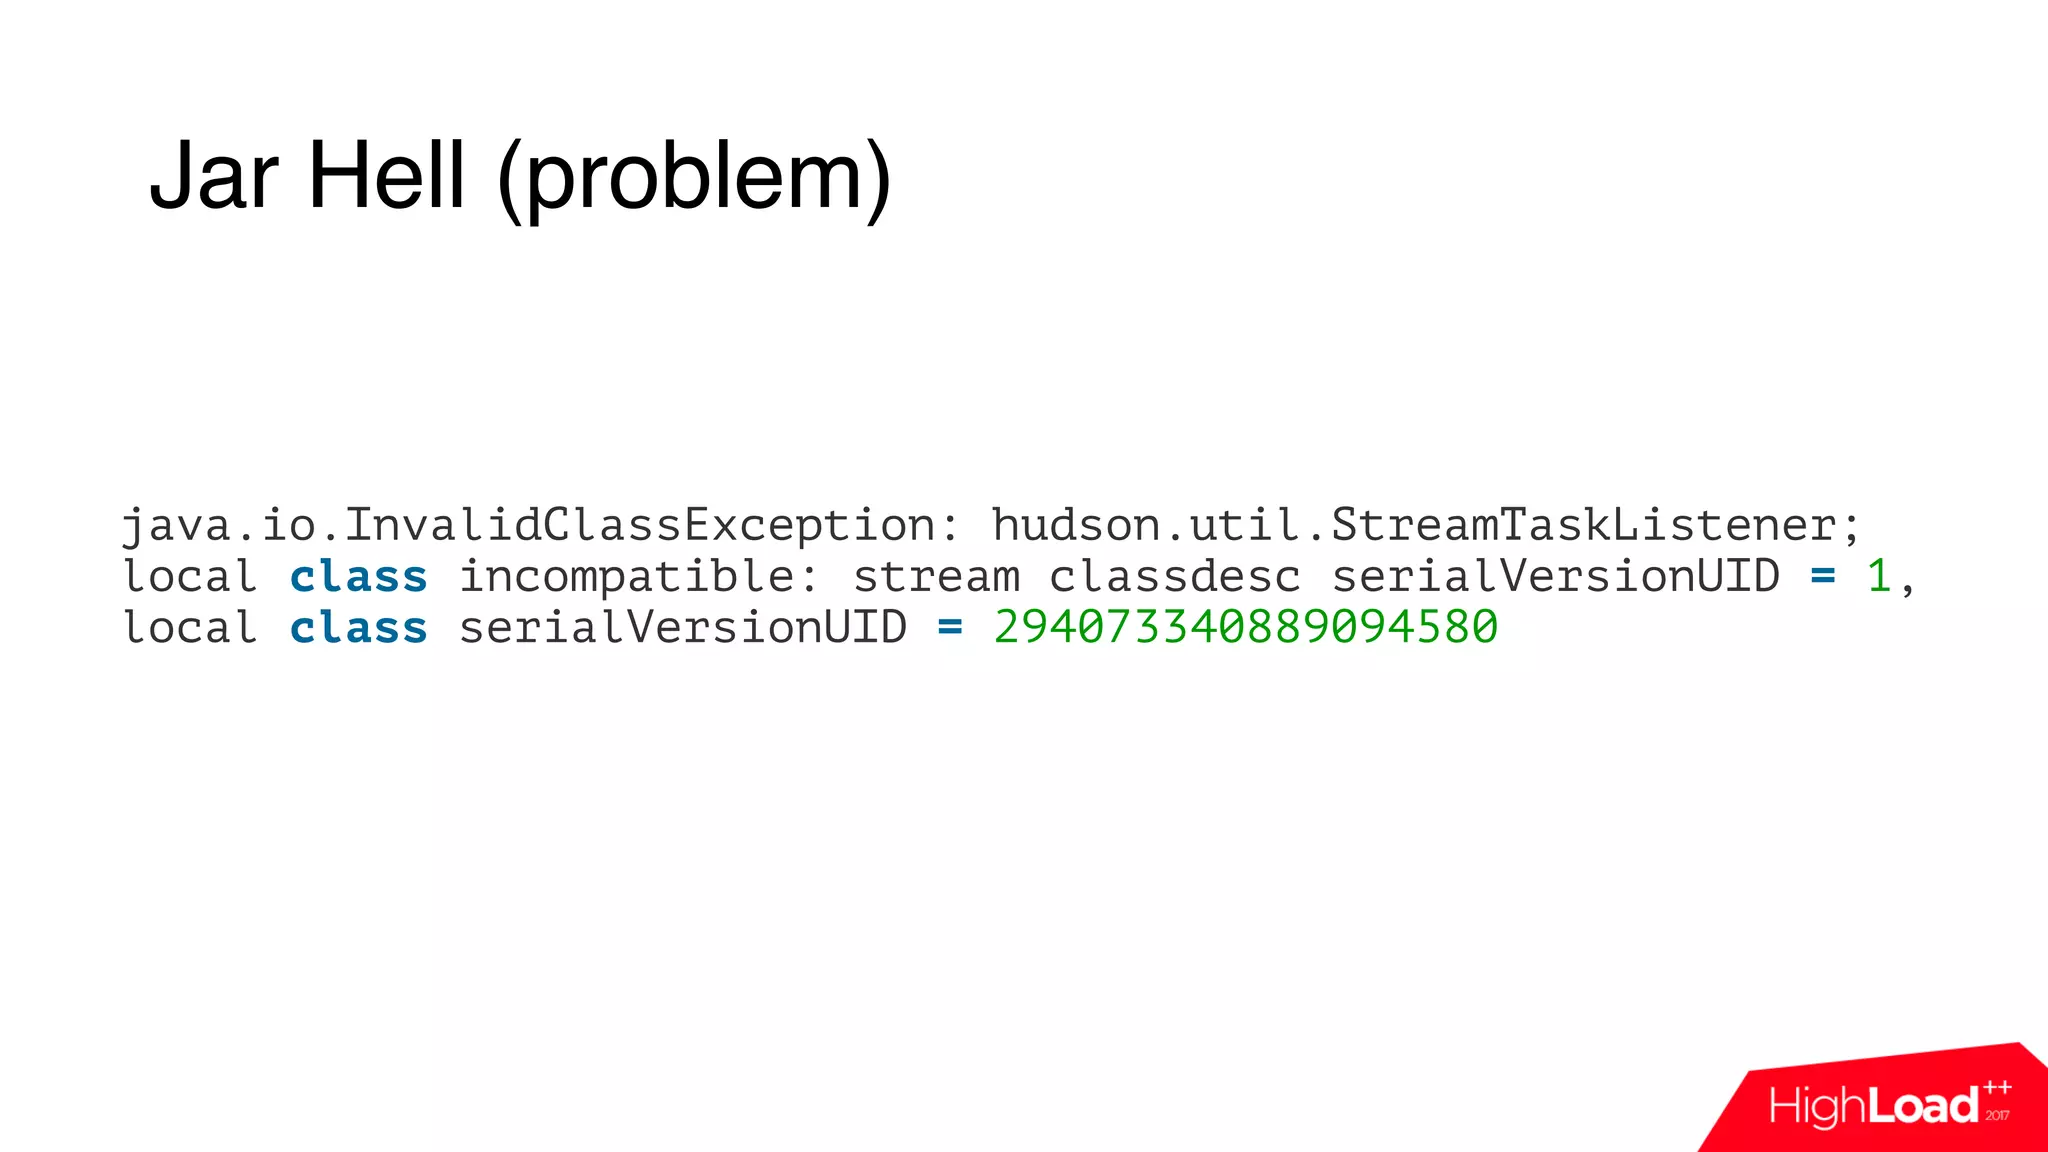

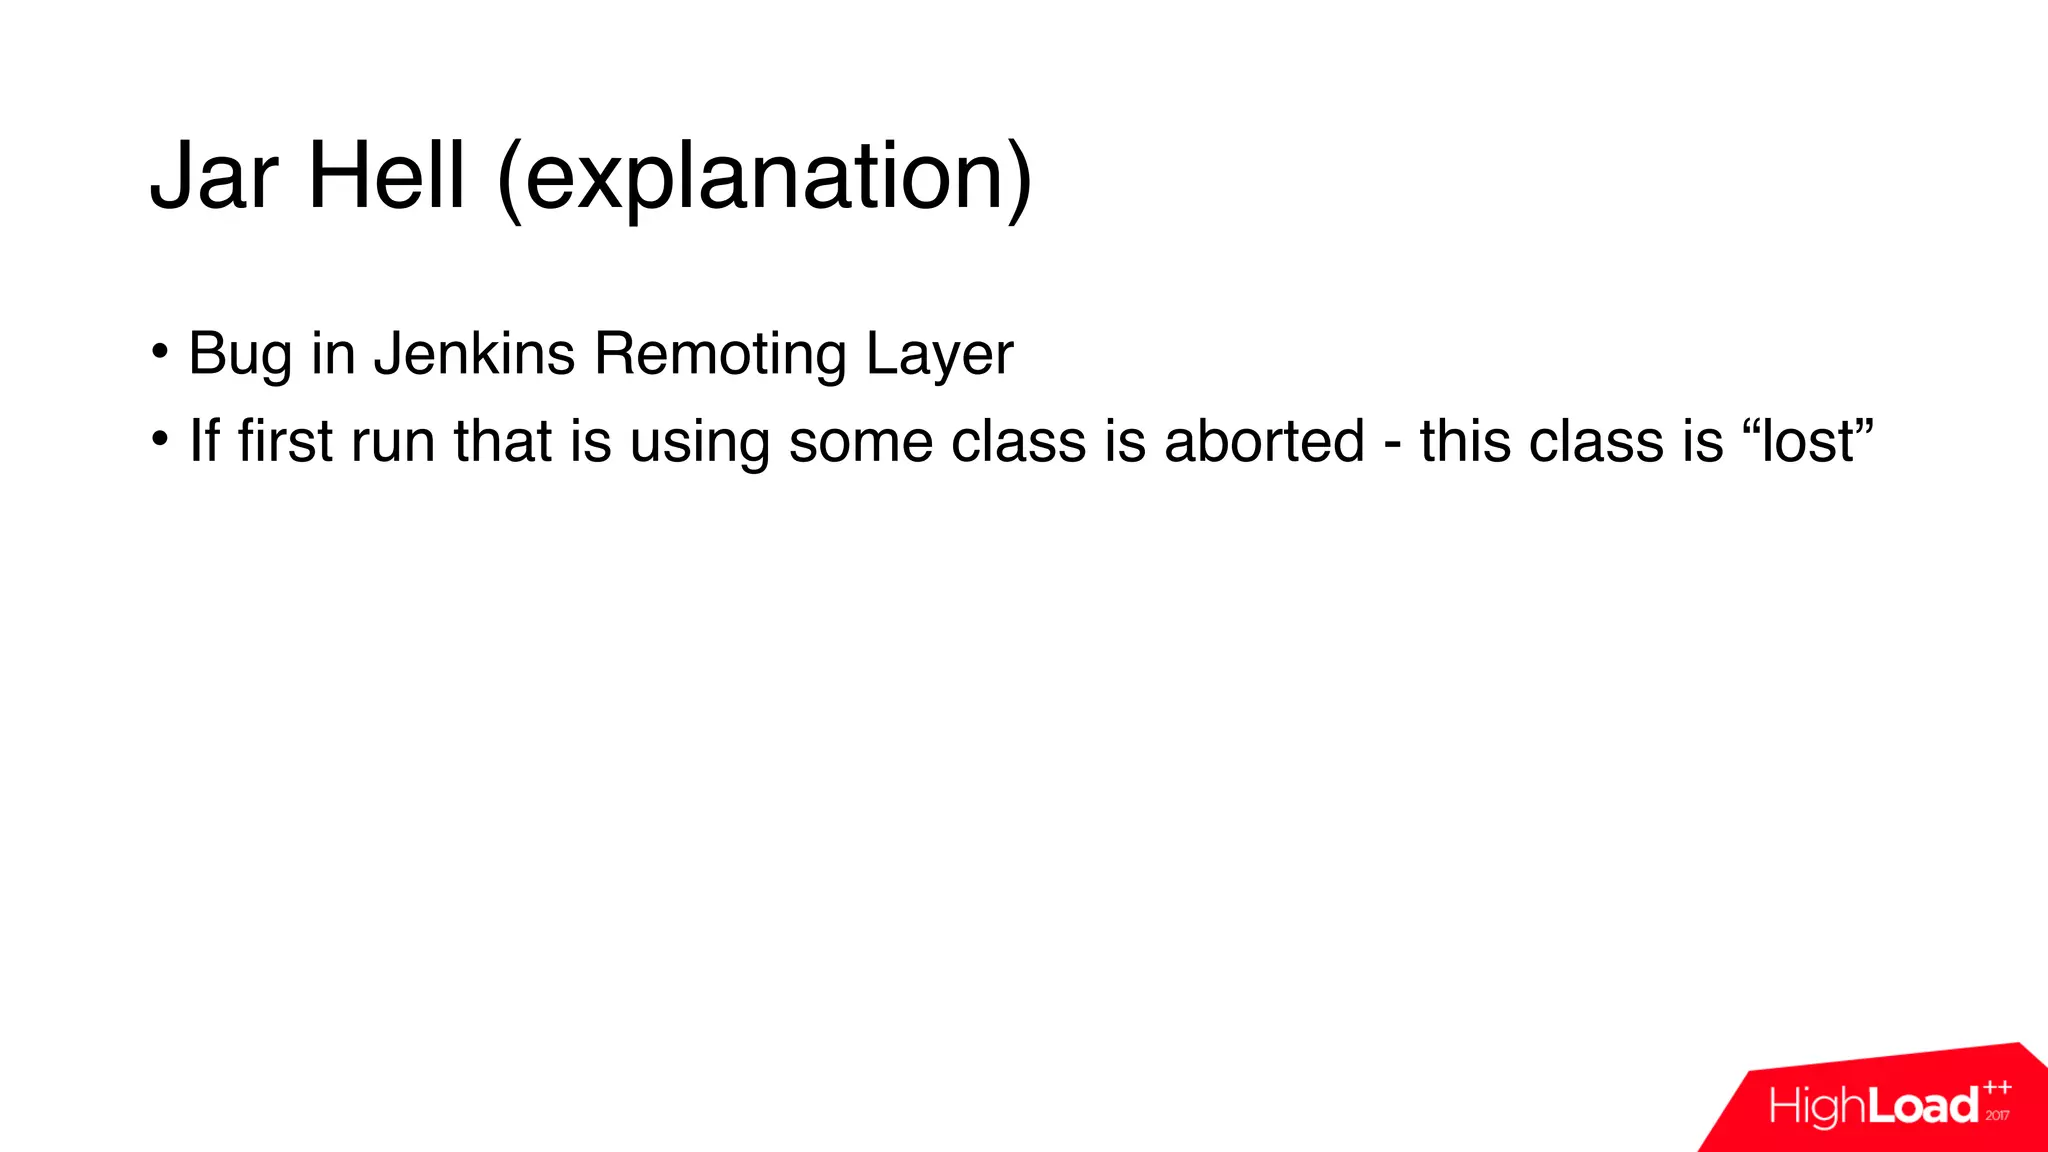
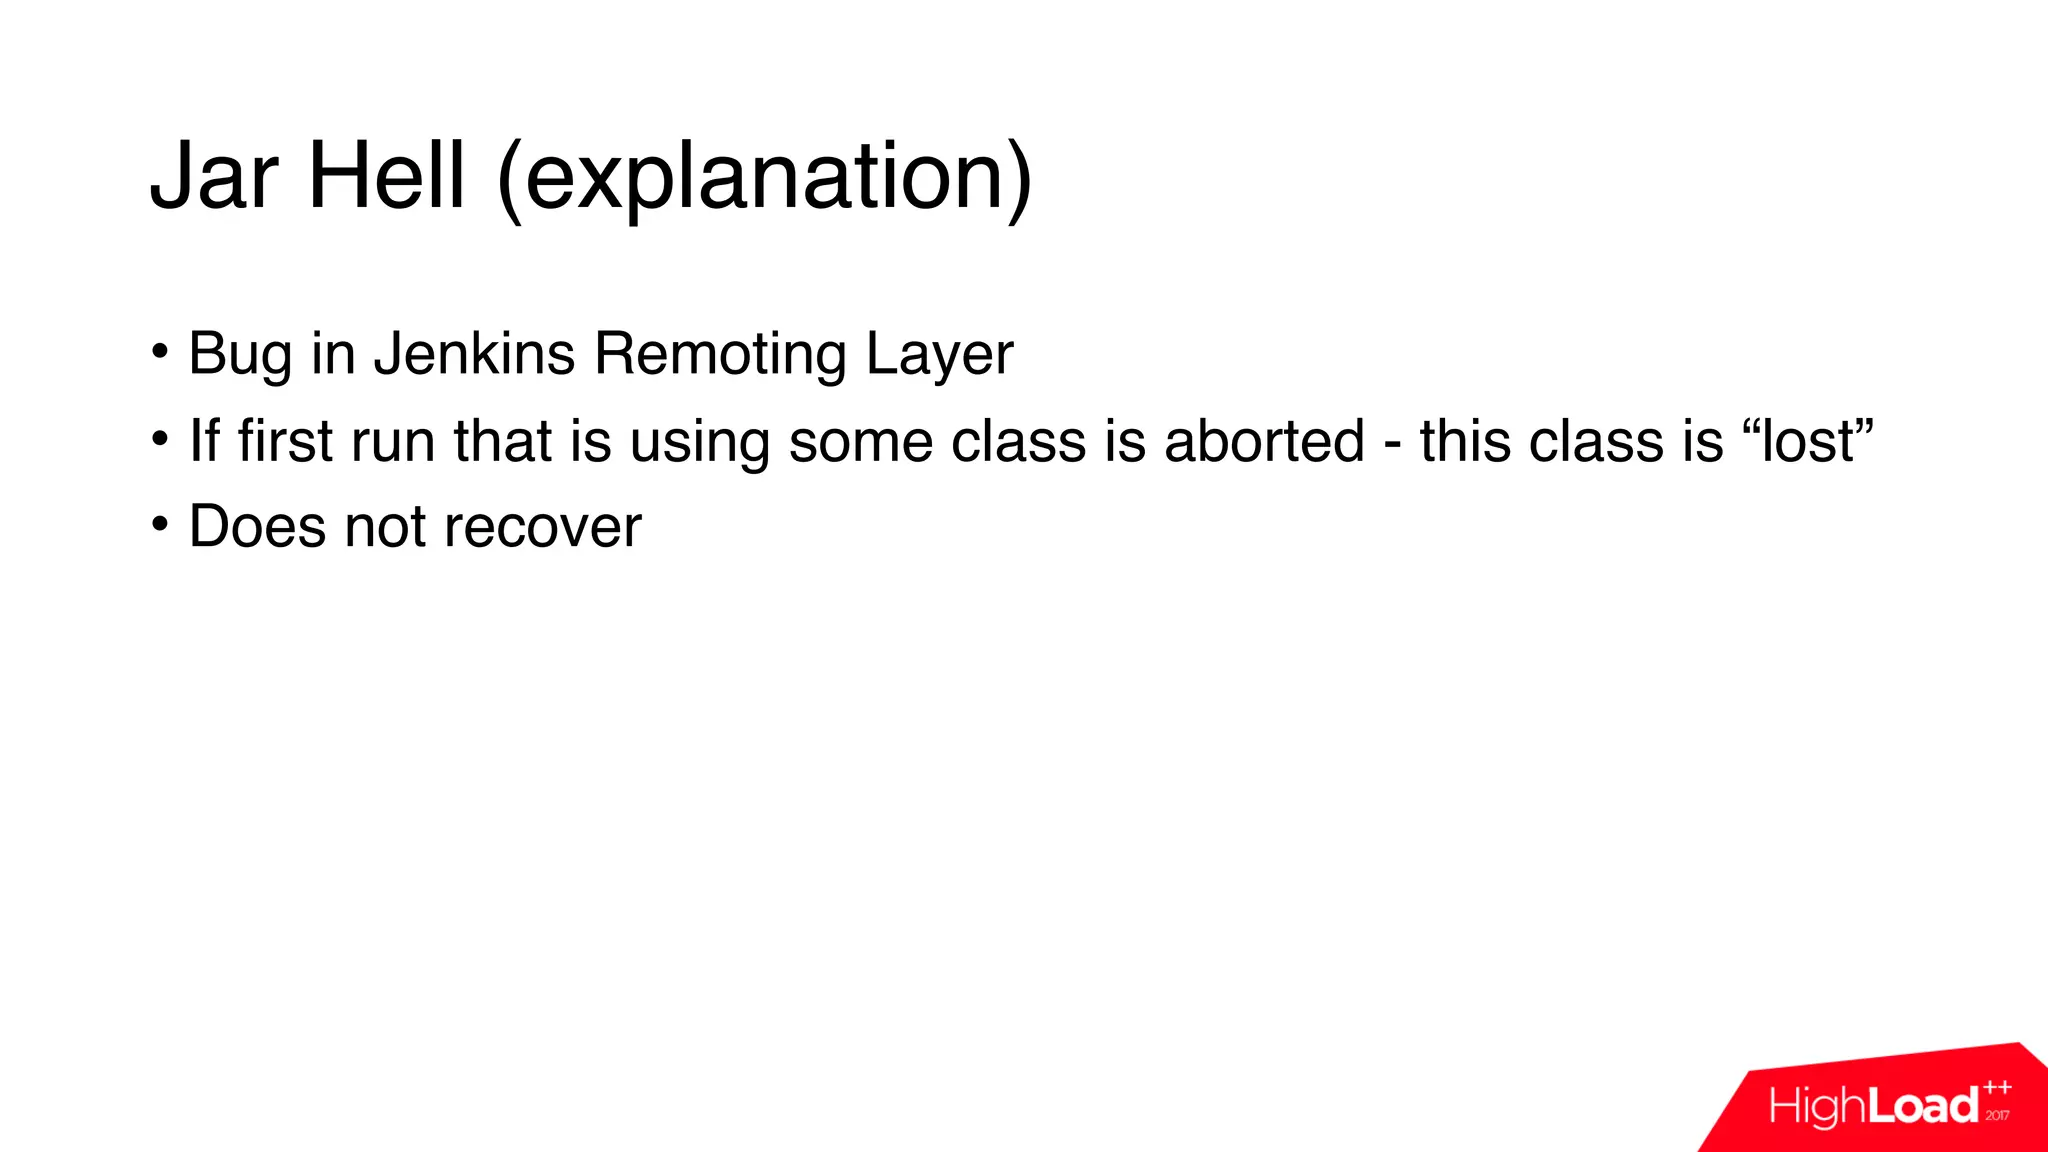


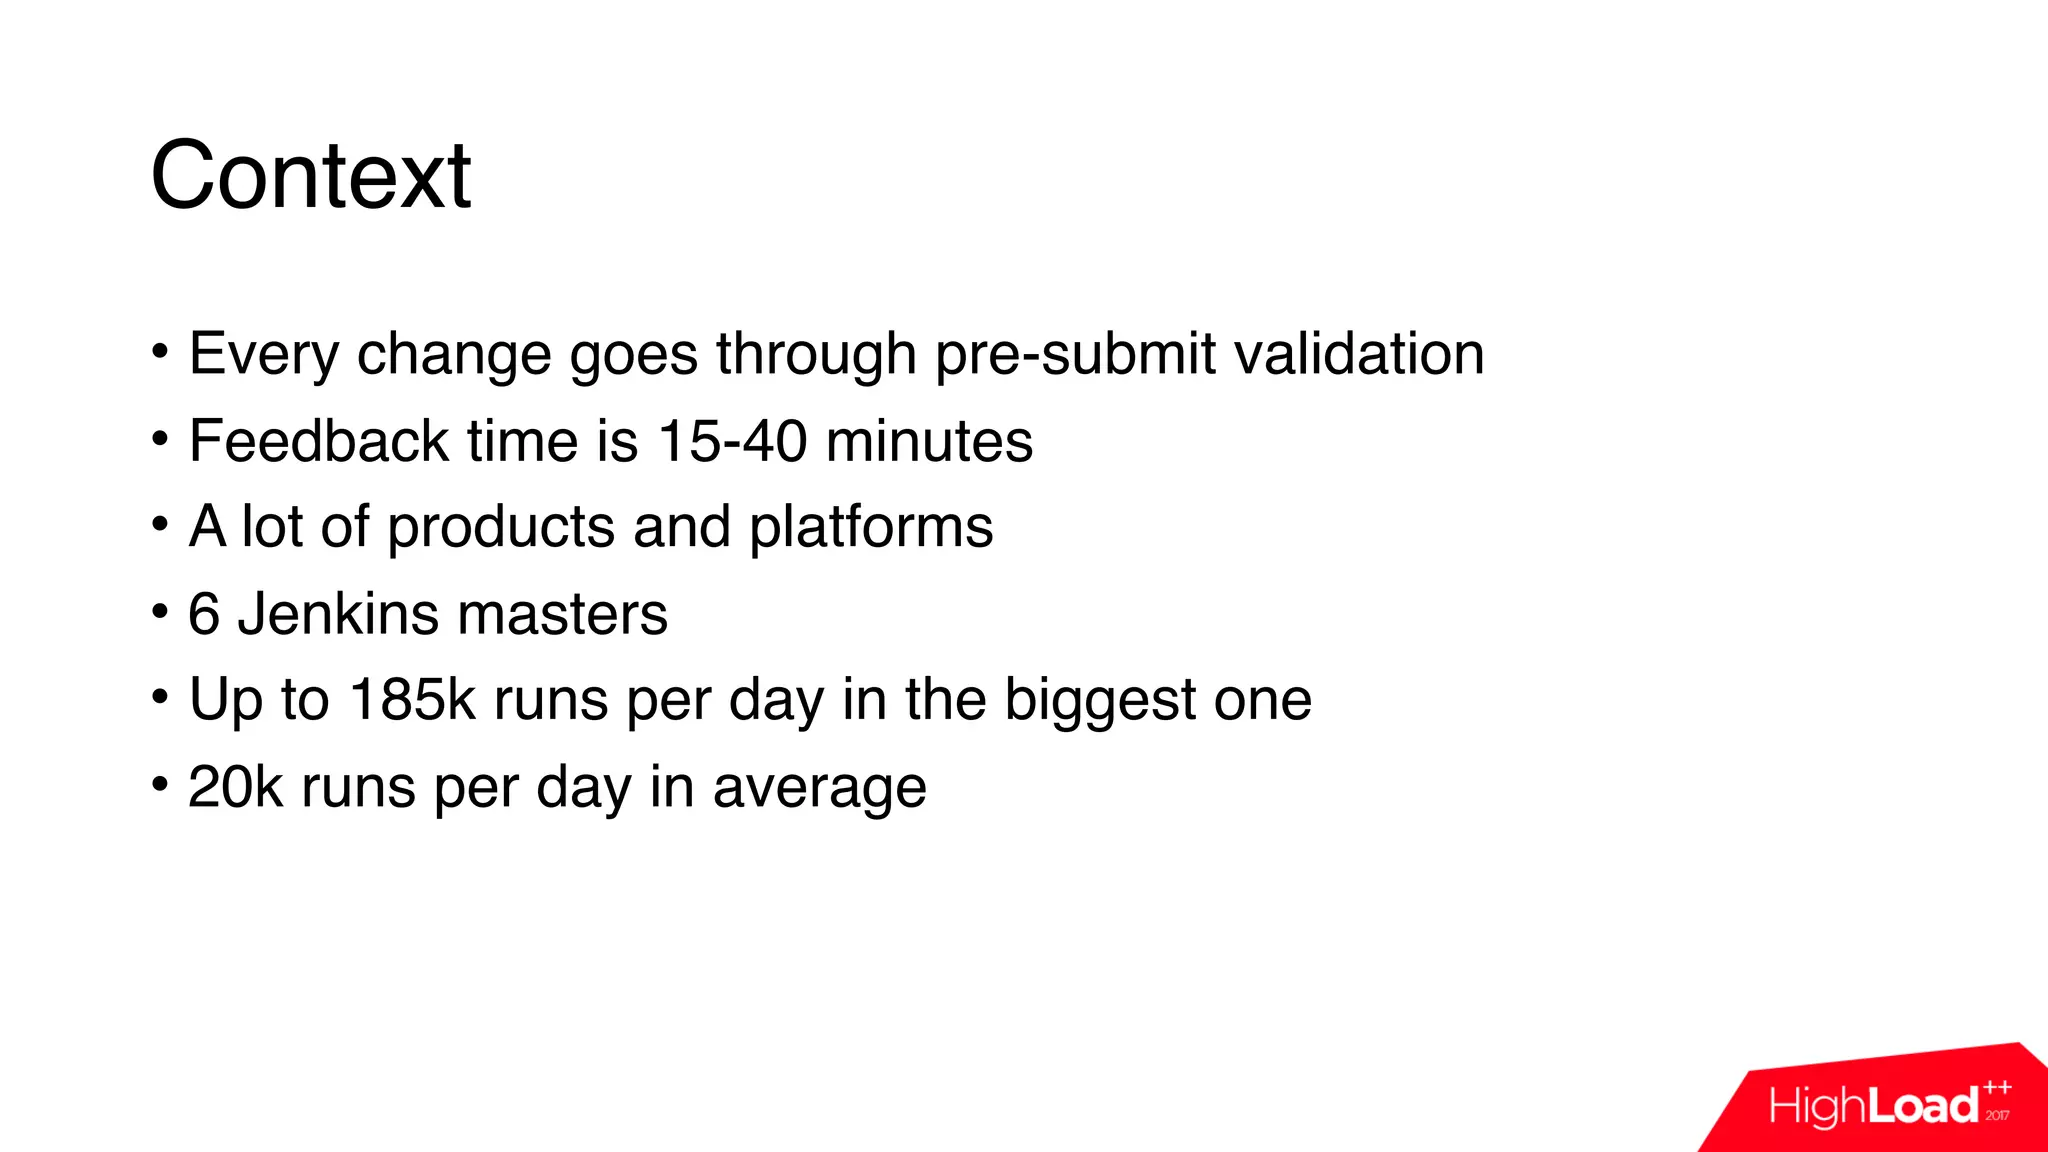
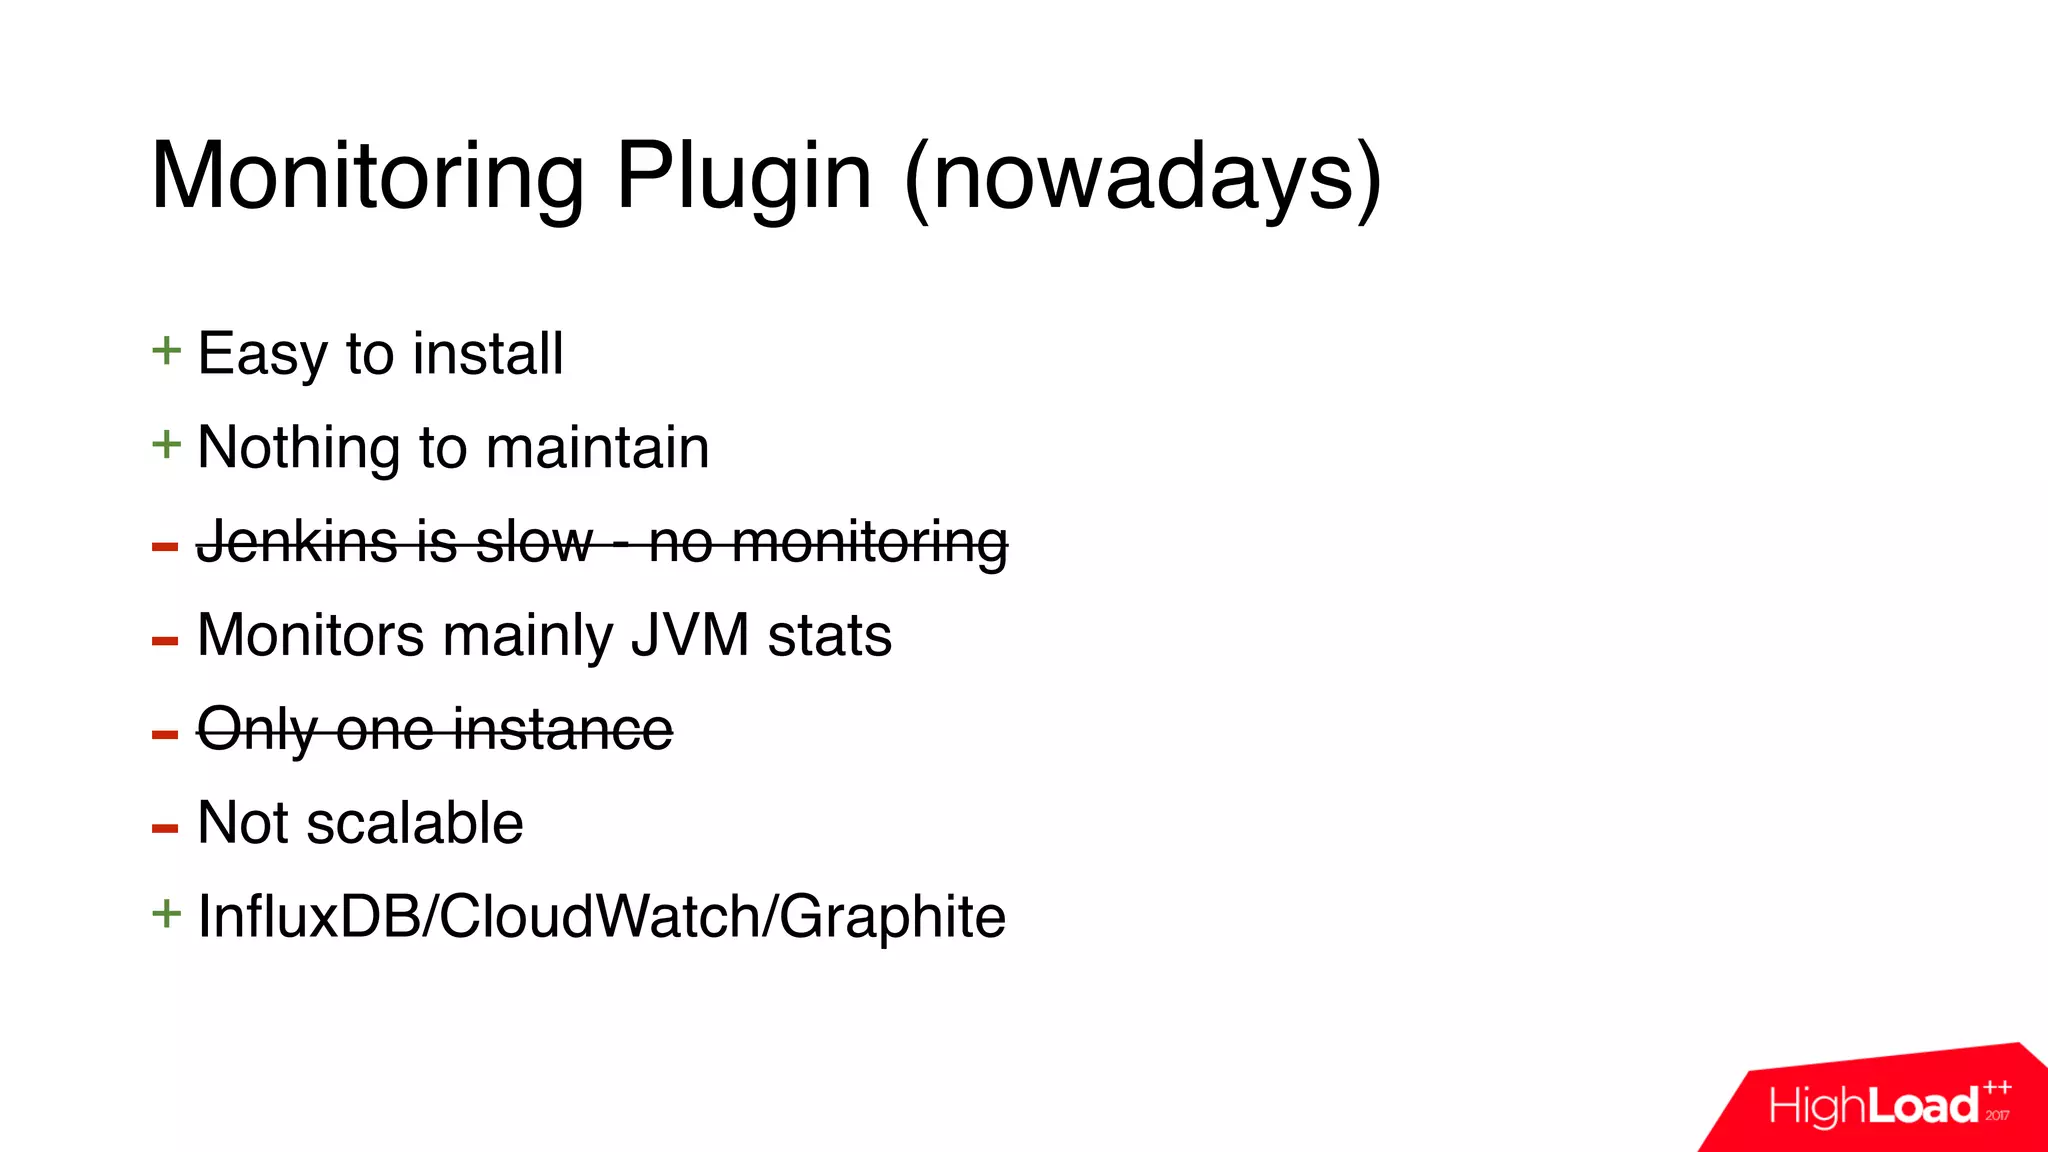
This document discusses monitoring a Jenkins continuous integration (CI) system using cloud services. It begins by outlining some common issues that can occur in Jenkins like compilation or test failures. It then evaluates the default Jenkins monitoring capabilities and proposes designing a custom monitoring system using events, FluentD for processing, and InfluxDB for storage. Examples are provided of plugins developed to analyze build failures and improve node utilization. The presentation concludes with a discussion of dashboards used for daily monitoring of the Jenkins CI system.


![[Webinar] The Frog And The Butler: CI Pipelines For Modern DevOps](https://cdn.slidesharecdn.com/ss_thumbnails/jenkinsartifactory-170830053058-thumbnail.jpg?width=640&height=640&fit=bounds)