The document provides a comprehensive guide on using the Elastic Stack (Elasticsearch, Logstash, Beats, and Kibana) for log management, alongside implementing Continuous Integration and Continuous Delivery (CI/CD) with Jenkins. It covers installation, configuration, and best practices for both systems, highlighting how to collect and visualize log data, automate testing and deployment processes, and monitor logs for anomalies and performance metrics. Additionally, it includes detailed explanations of log formats, integration with CI/CD pipelines, and recommendations for effective log management and alerting.

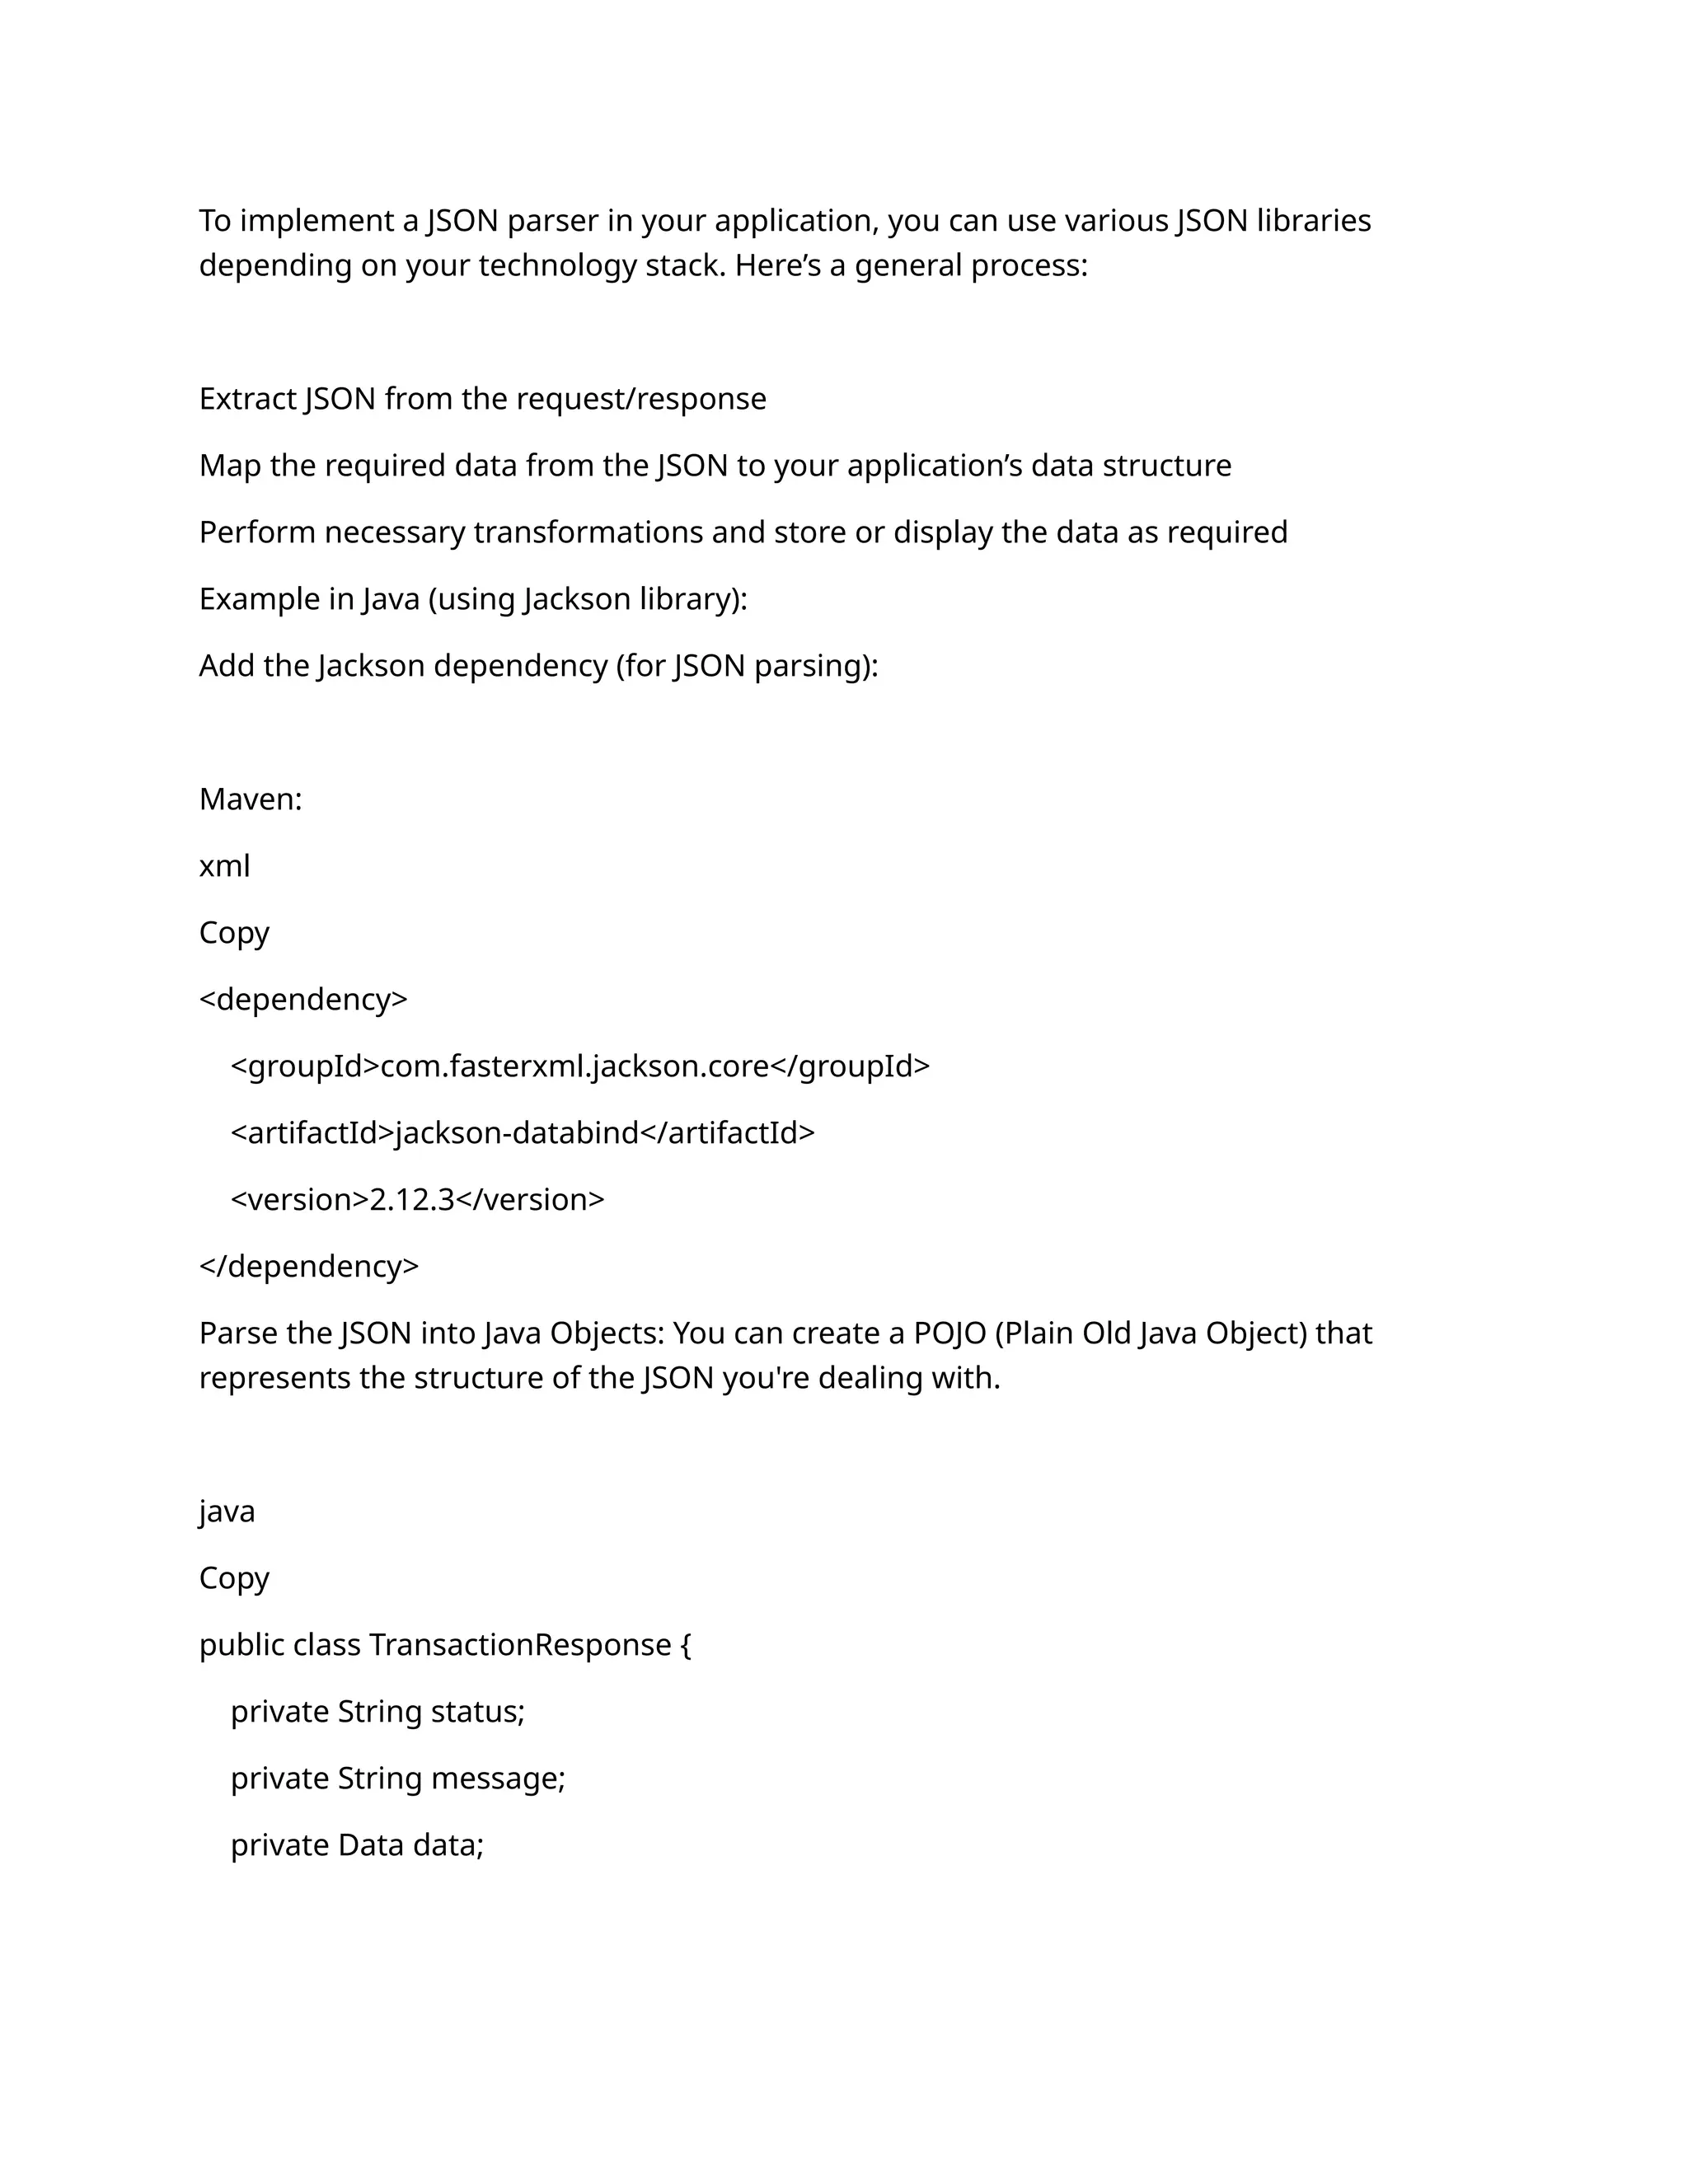
![Copy
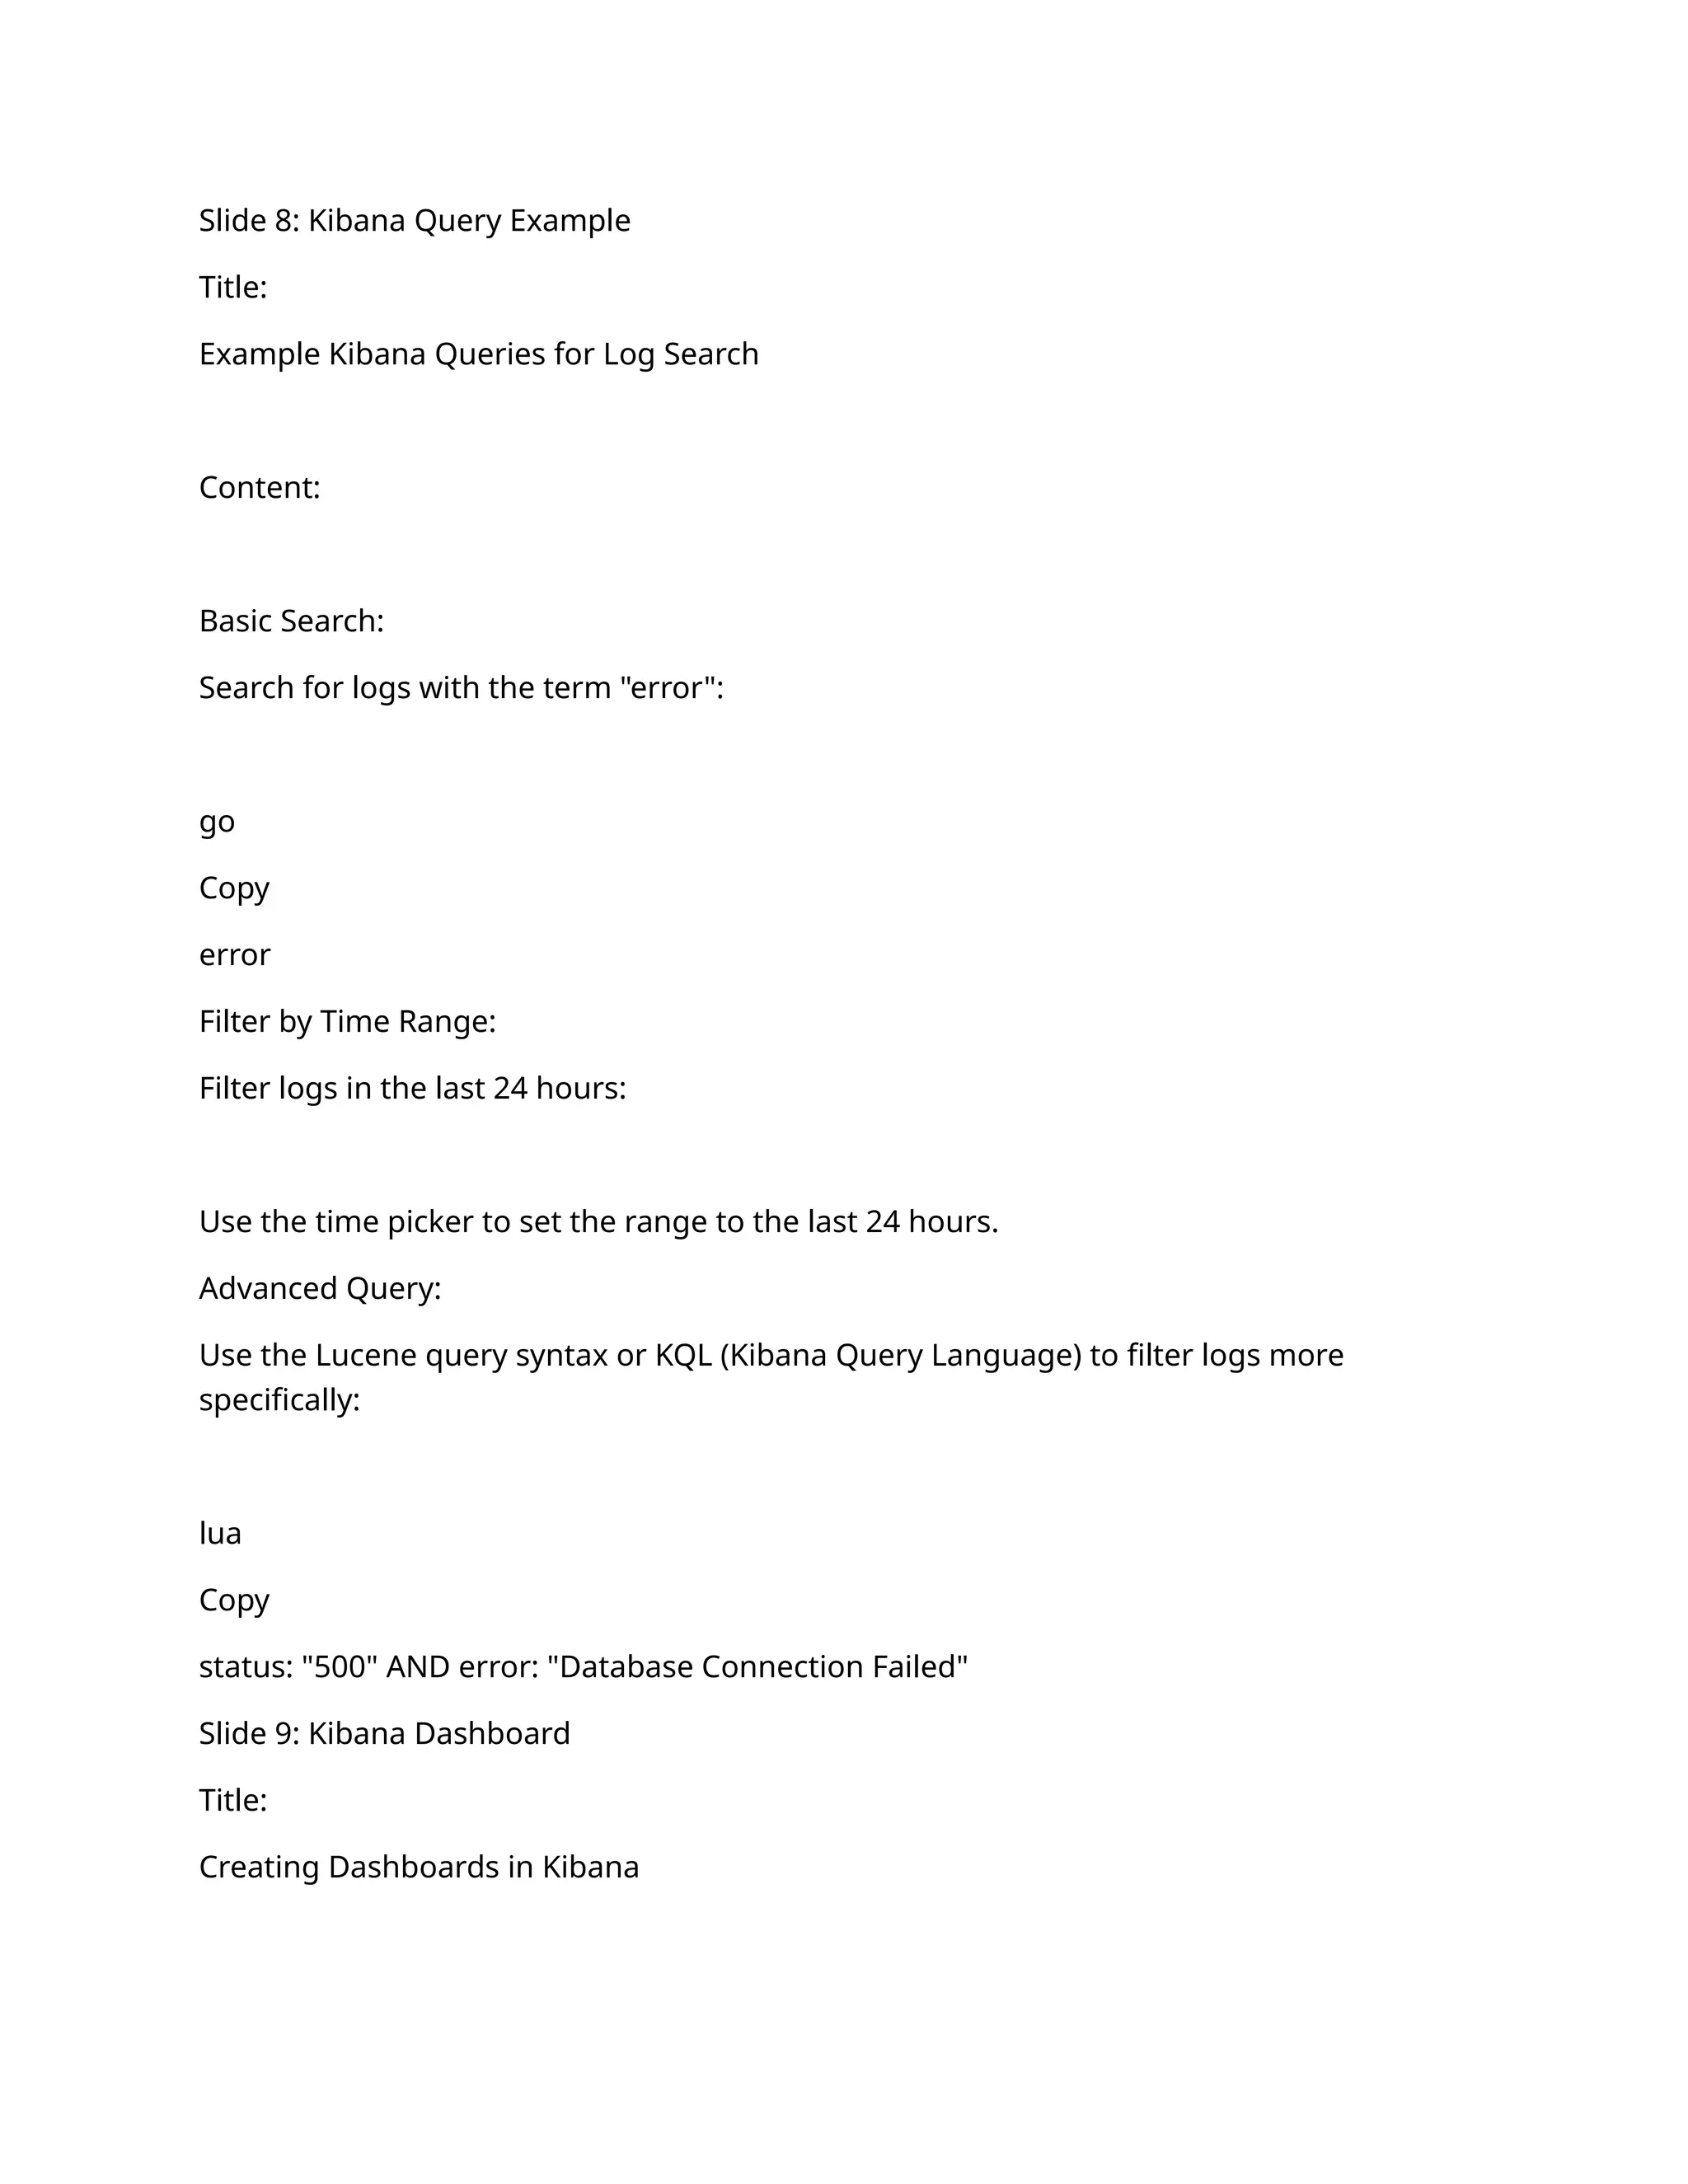
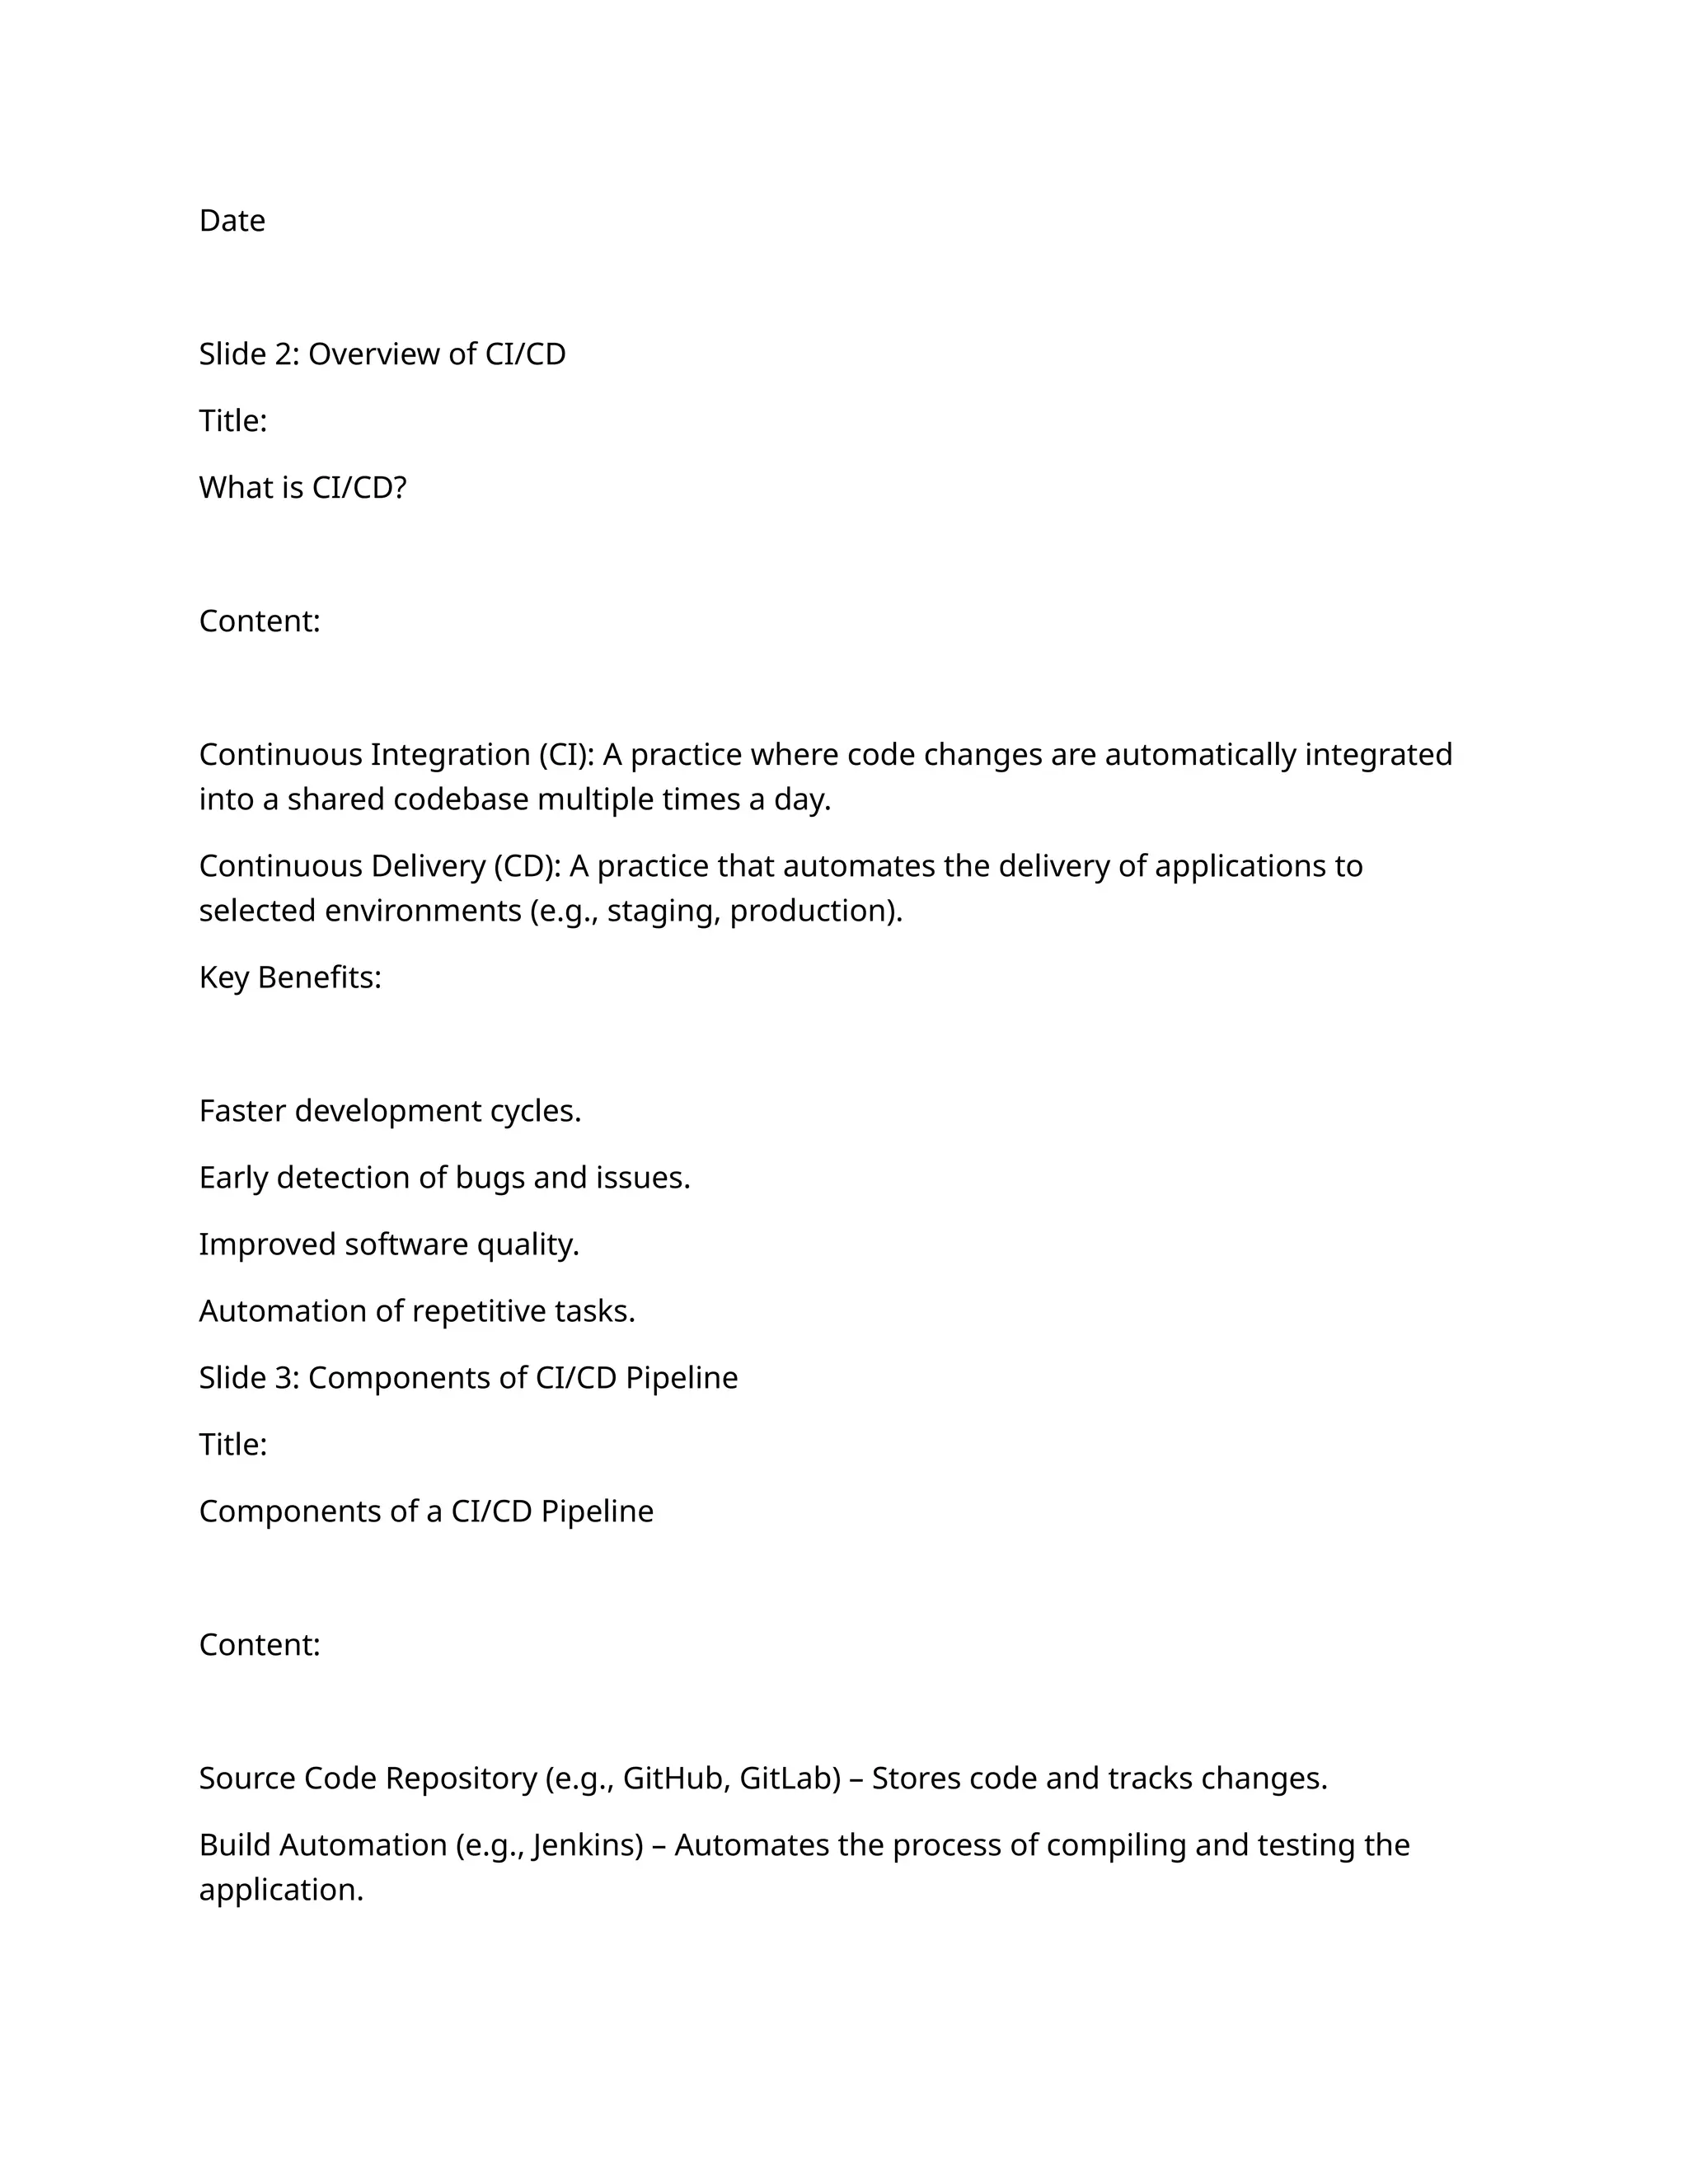
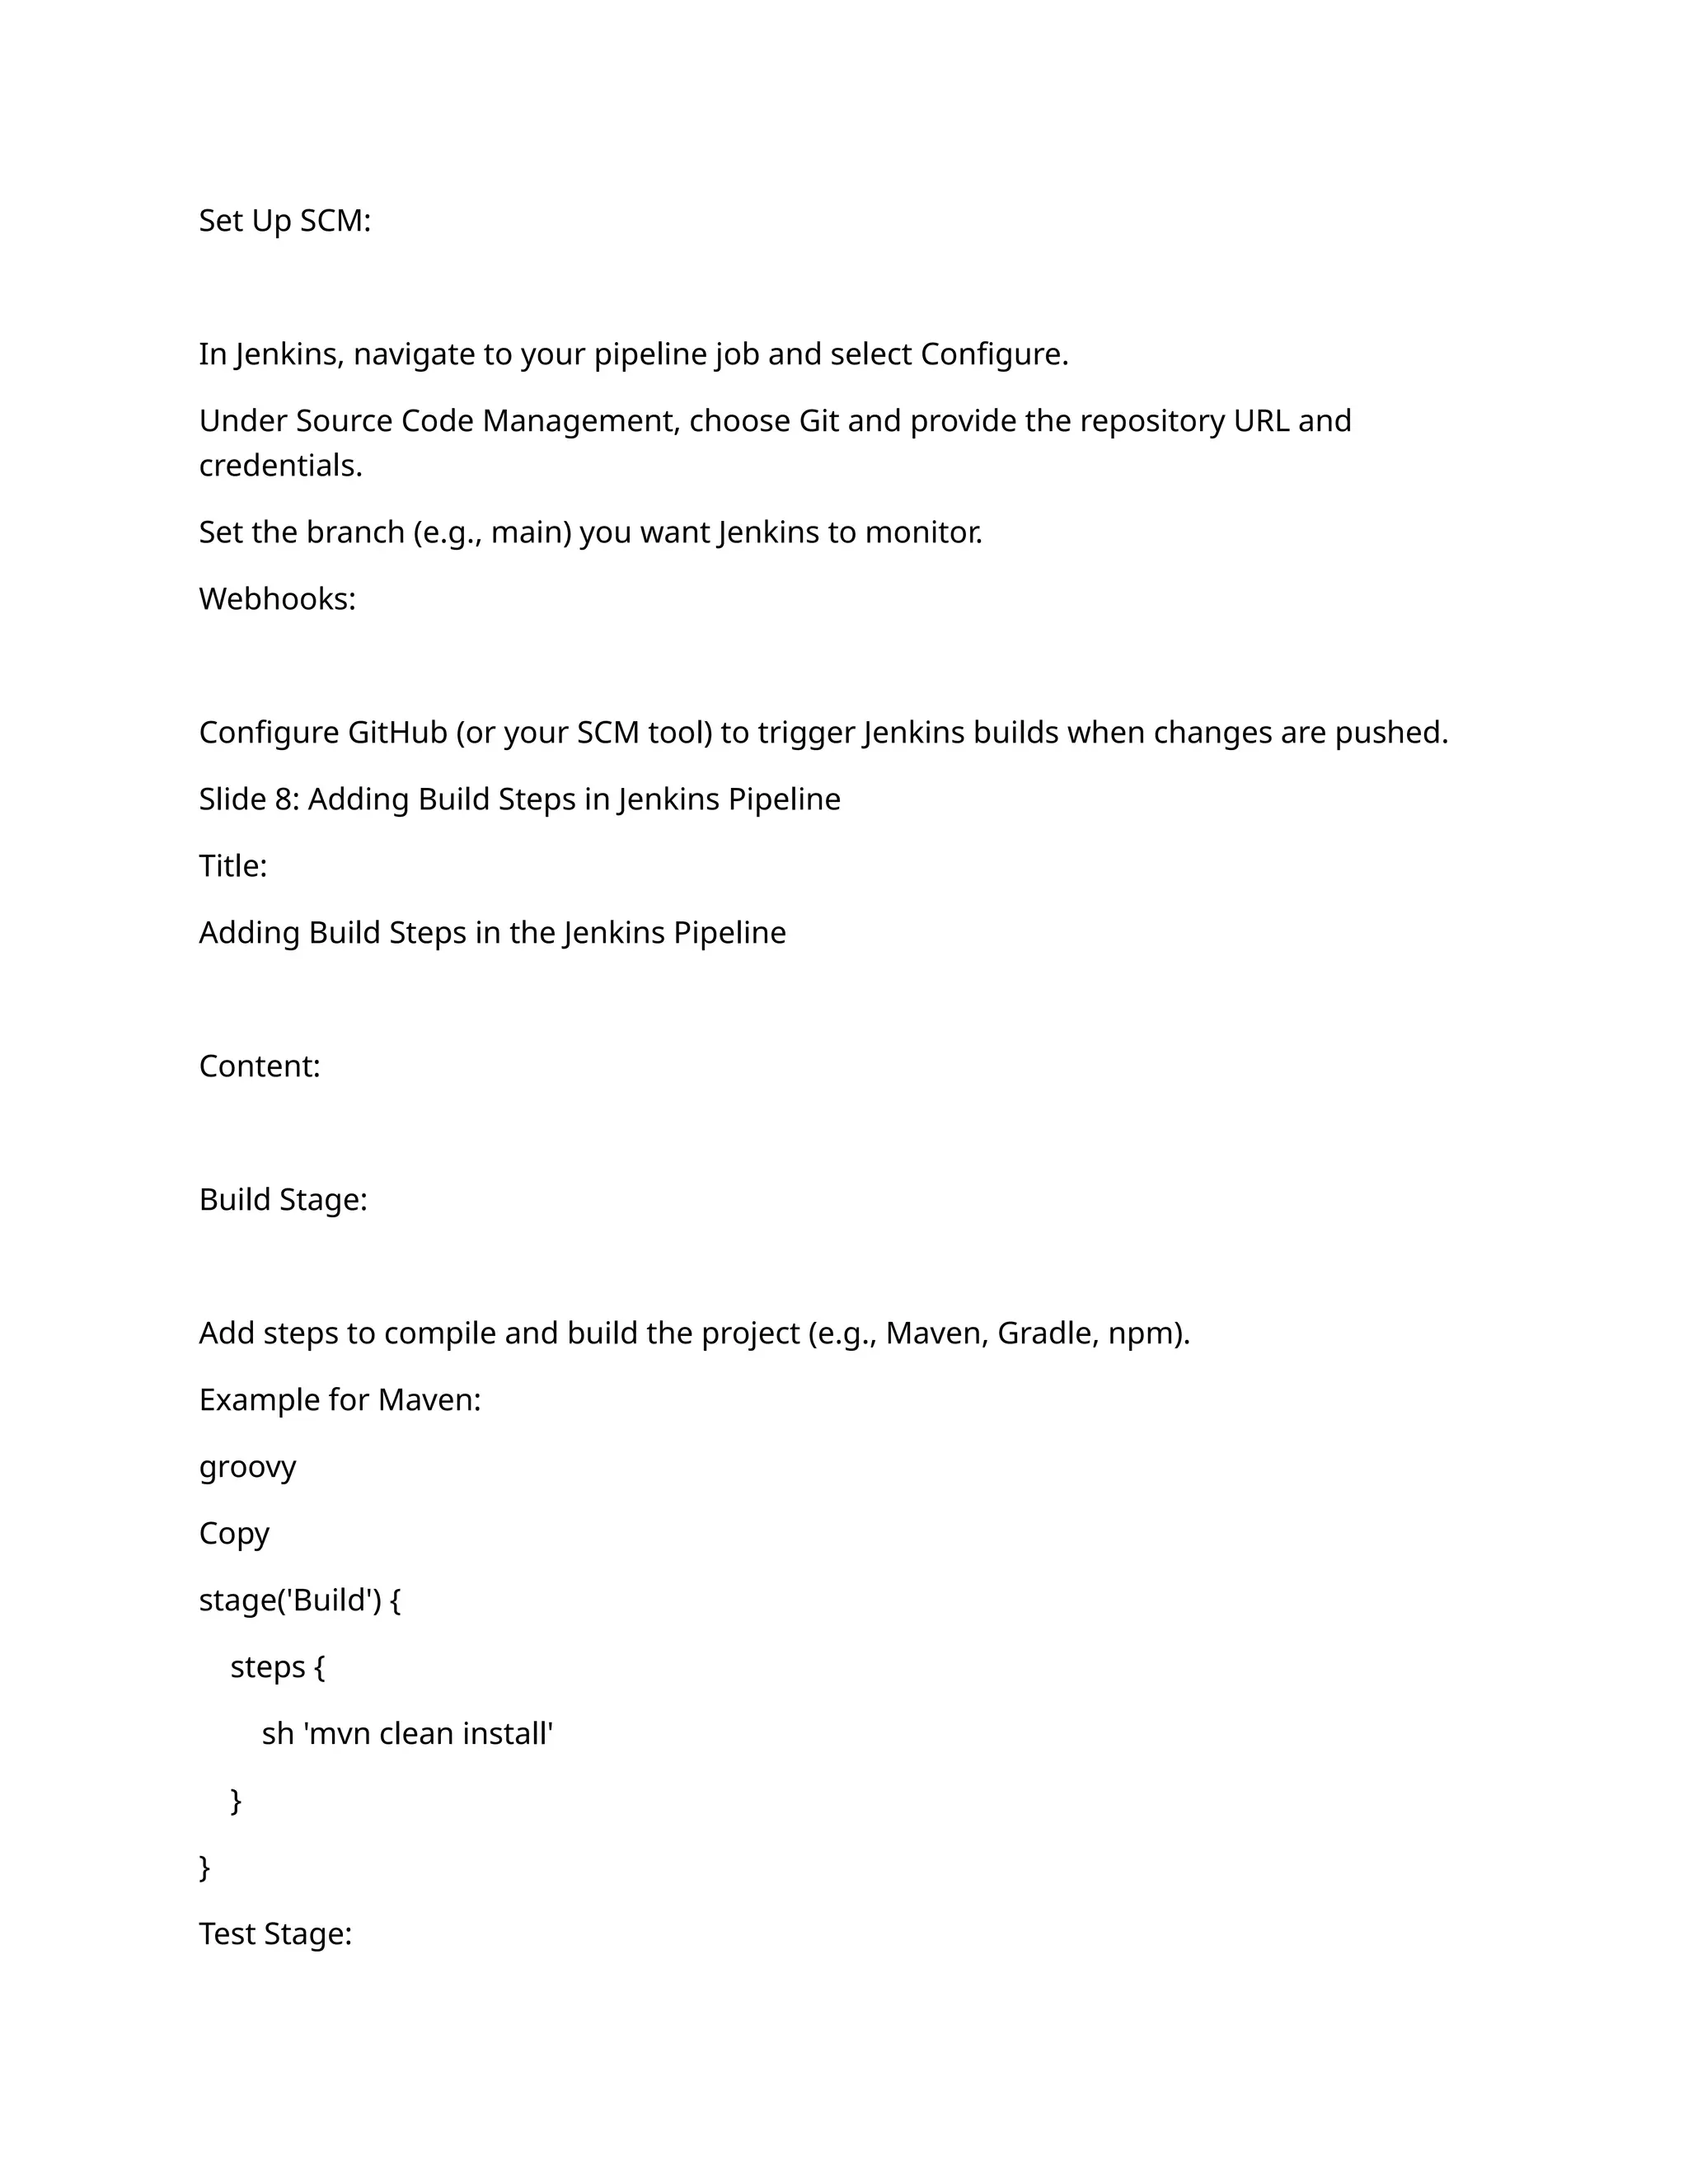
filebeat.inputs:
- type: log
enabled: true
paths:
- /var/log/*.log
output.elasticsearch:
hosts: ["http://localhost:9200"]
Start Filebeat:
bash
Copy
sudo service filebeat start
Slide 5: Sending Logs to Elasticsearch
Title:
Sending Logs to Elasticsearch with Filebeat
Content:
Filebeat reads logs from the configured paths, and forwards them to Elasticsearch for
storage and indexing.
Filebeat modules: Pre-built configurations for popular applications (e.g., Nginx, Apache,
MySQL) to automatically parse and structure log data.
Data flow:
Filebeat reads log files.
Filebeat forwards logs to Elasticsearch.](https://image.slidesharecdn.com/esbapplicationimprovementpdf-250202181658-d510e3e4/75/ESB-APPLICTAION-IMPROVEMENT-2024-this-4-2048.jpg)
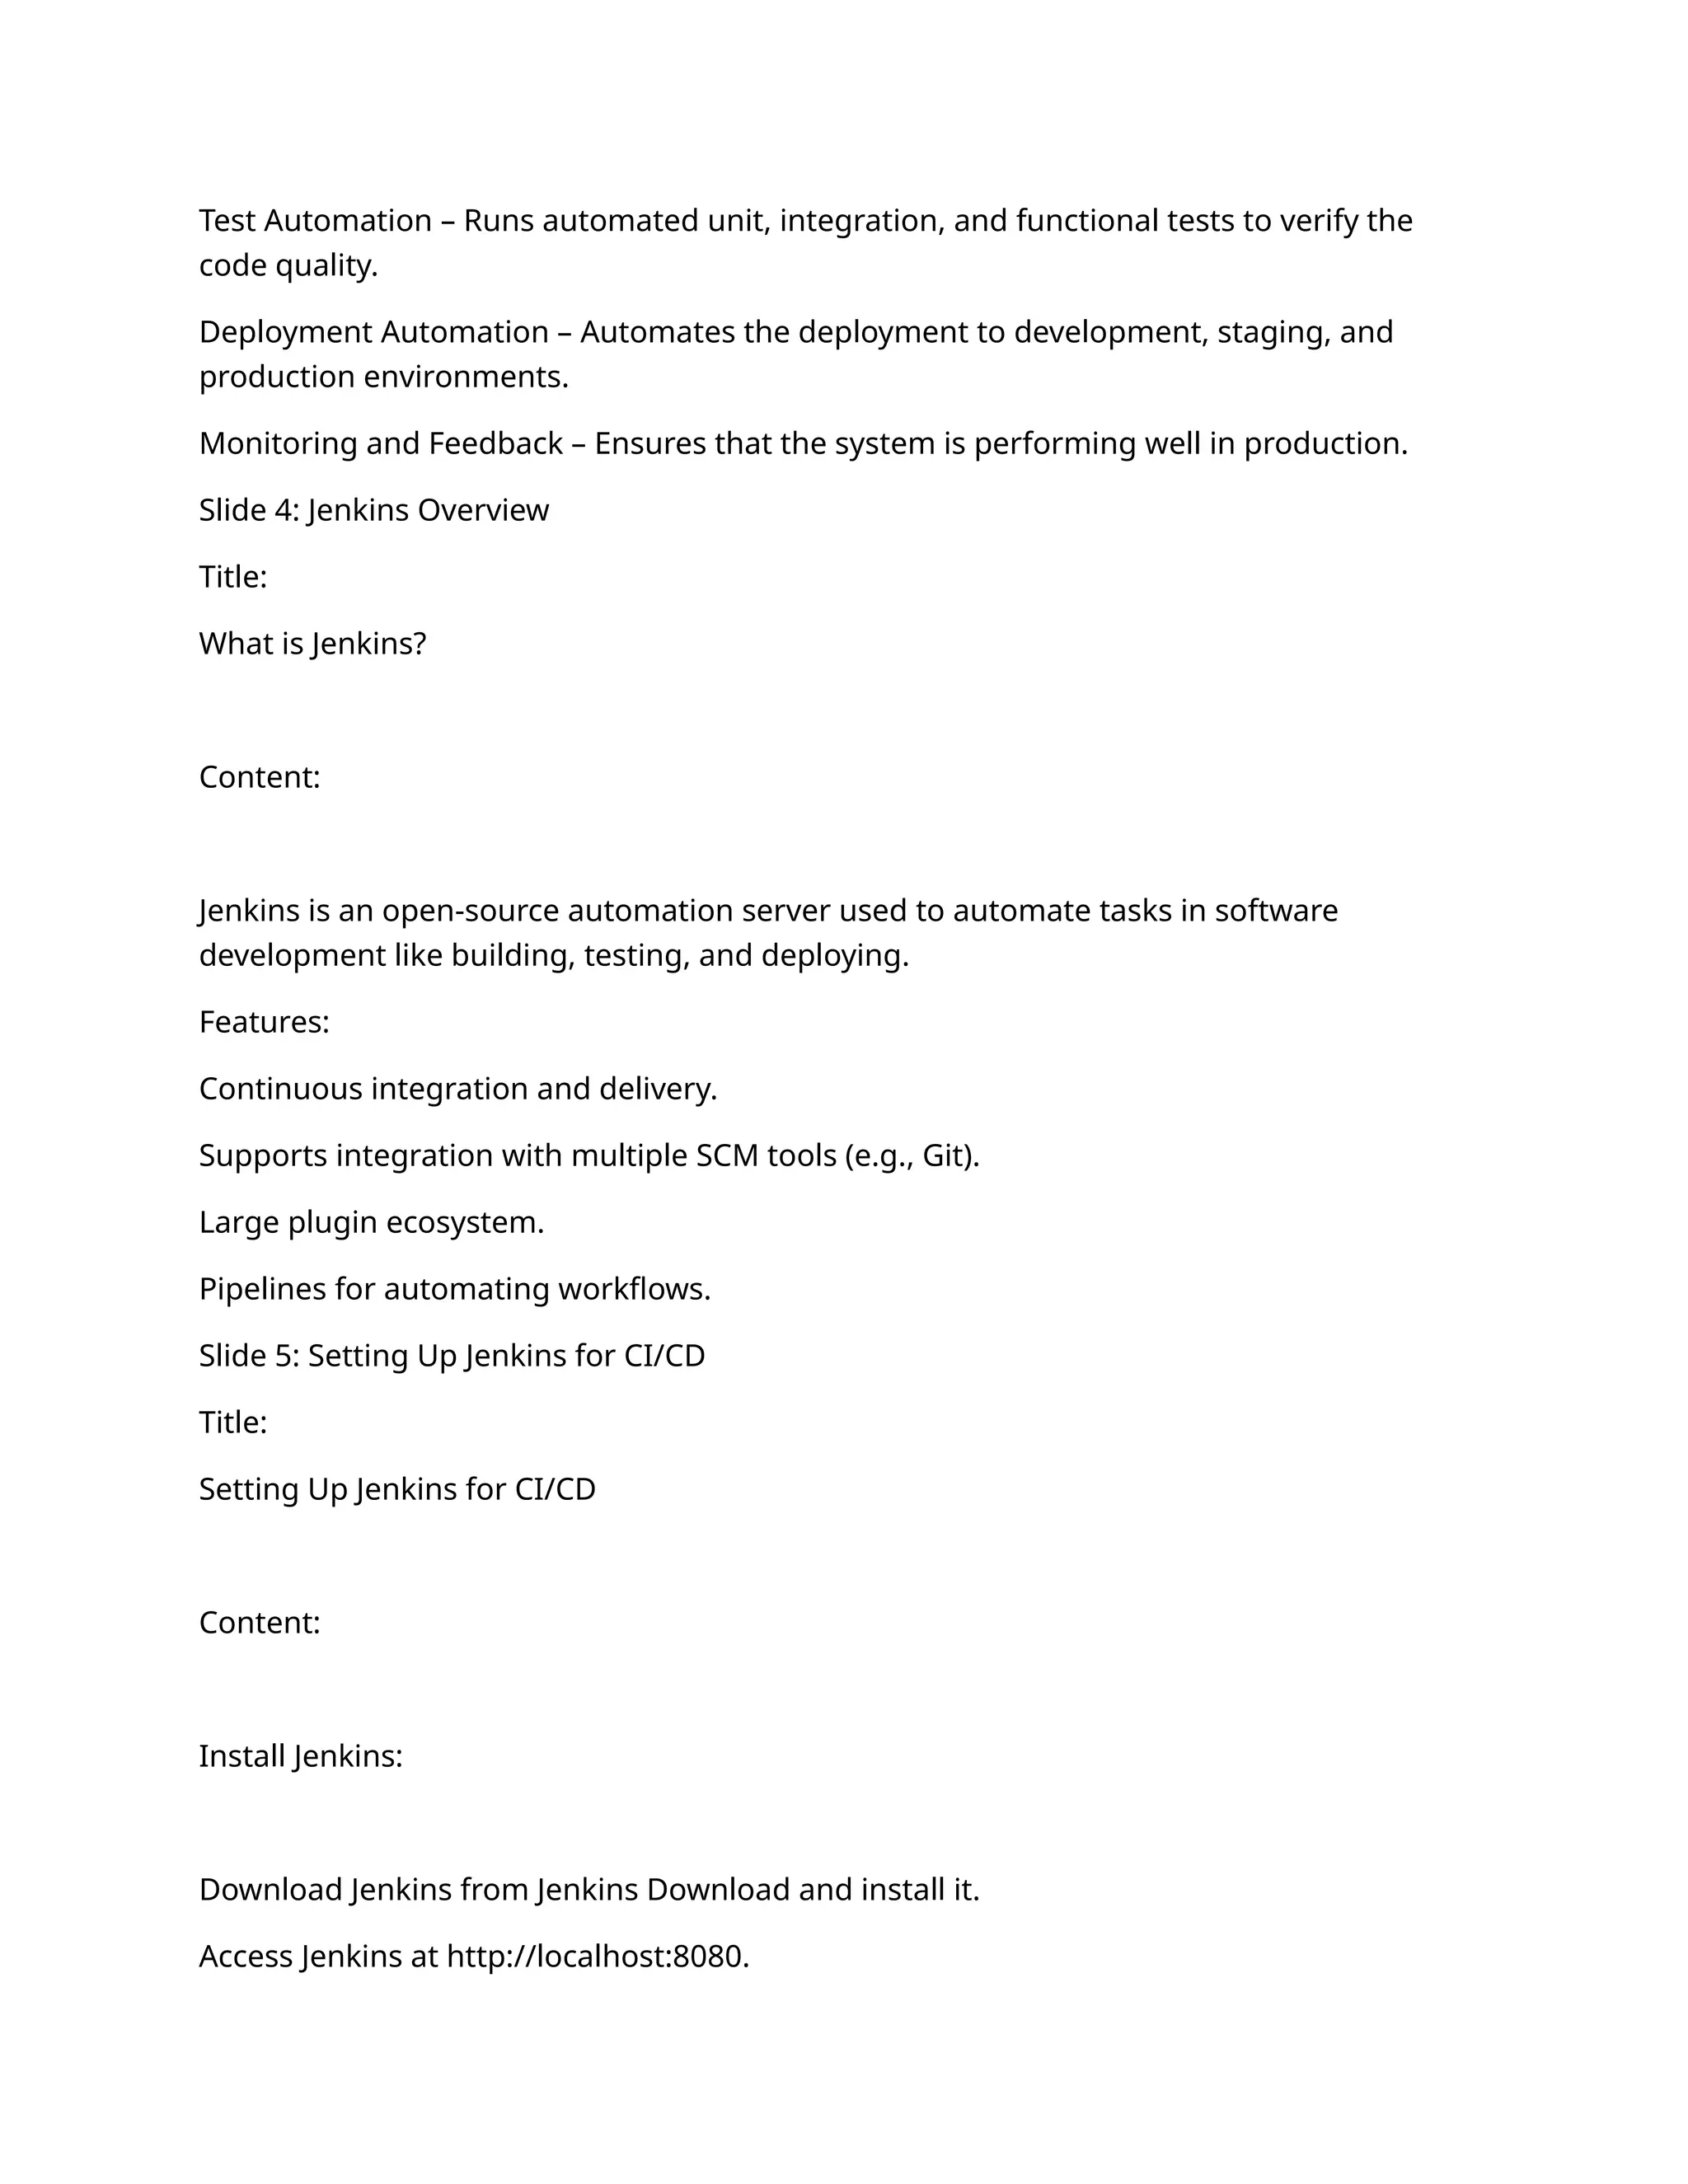
![This outline should give you a comprehensive and well-structured presentation on CI/CD
using Jenkins. Feel free to customize the content and add specific details relevant to your
use case. Let me know if you need further details on any of these points!
To integrate your log format into documentation, such as for monitoring, logging, or
CI/CD workflows, it's essential to break down the key elements of the log and explain how
to capture and use this information effectively. Here’s how you can structure it:
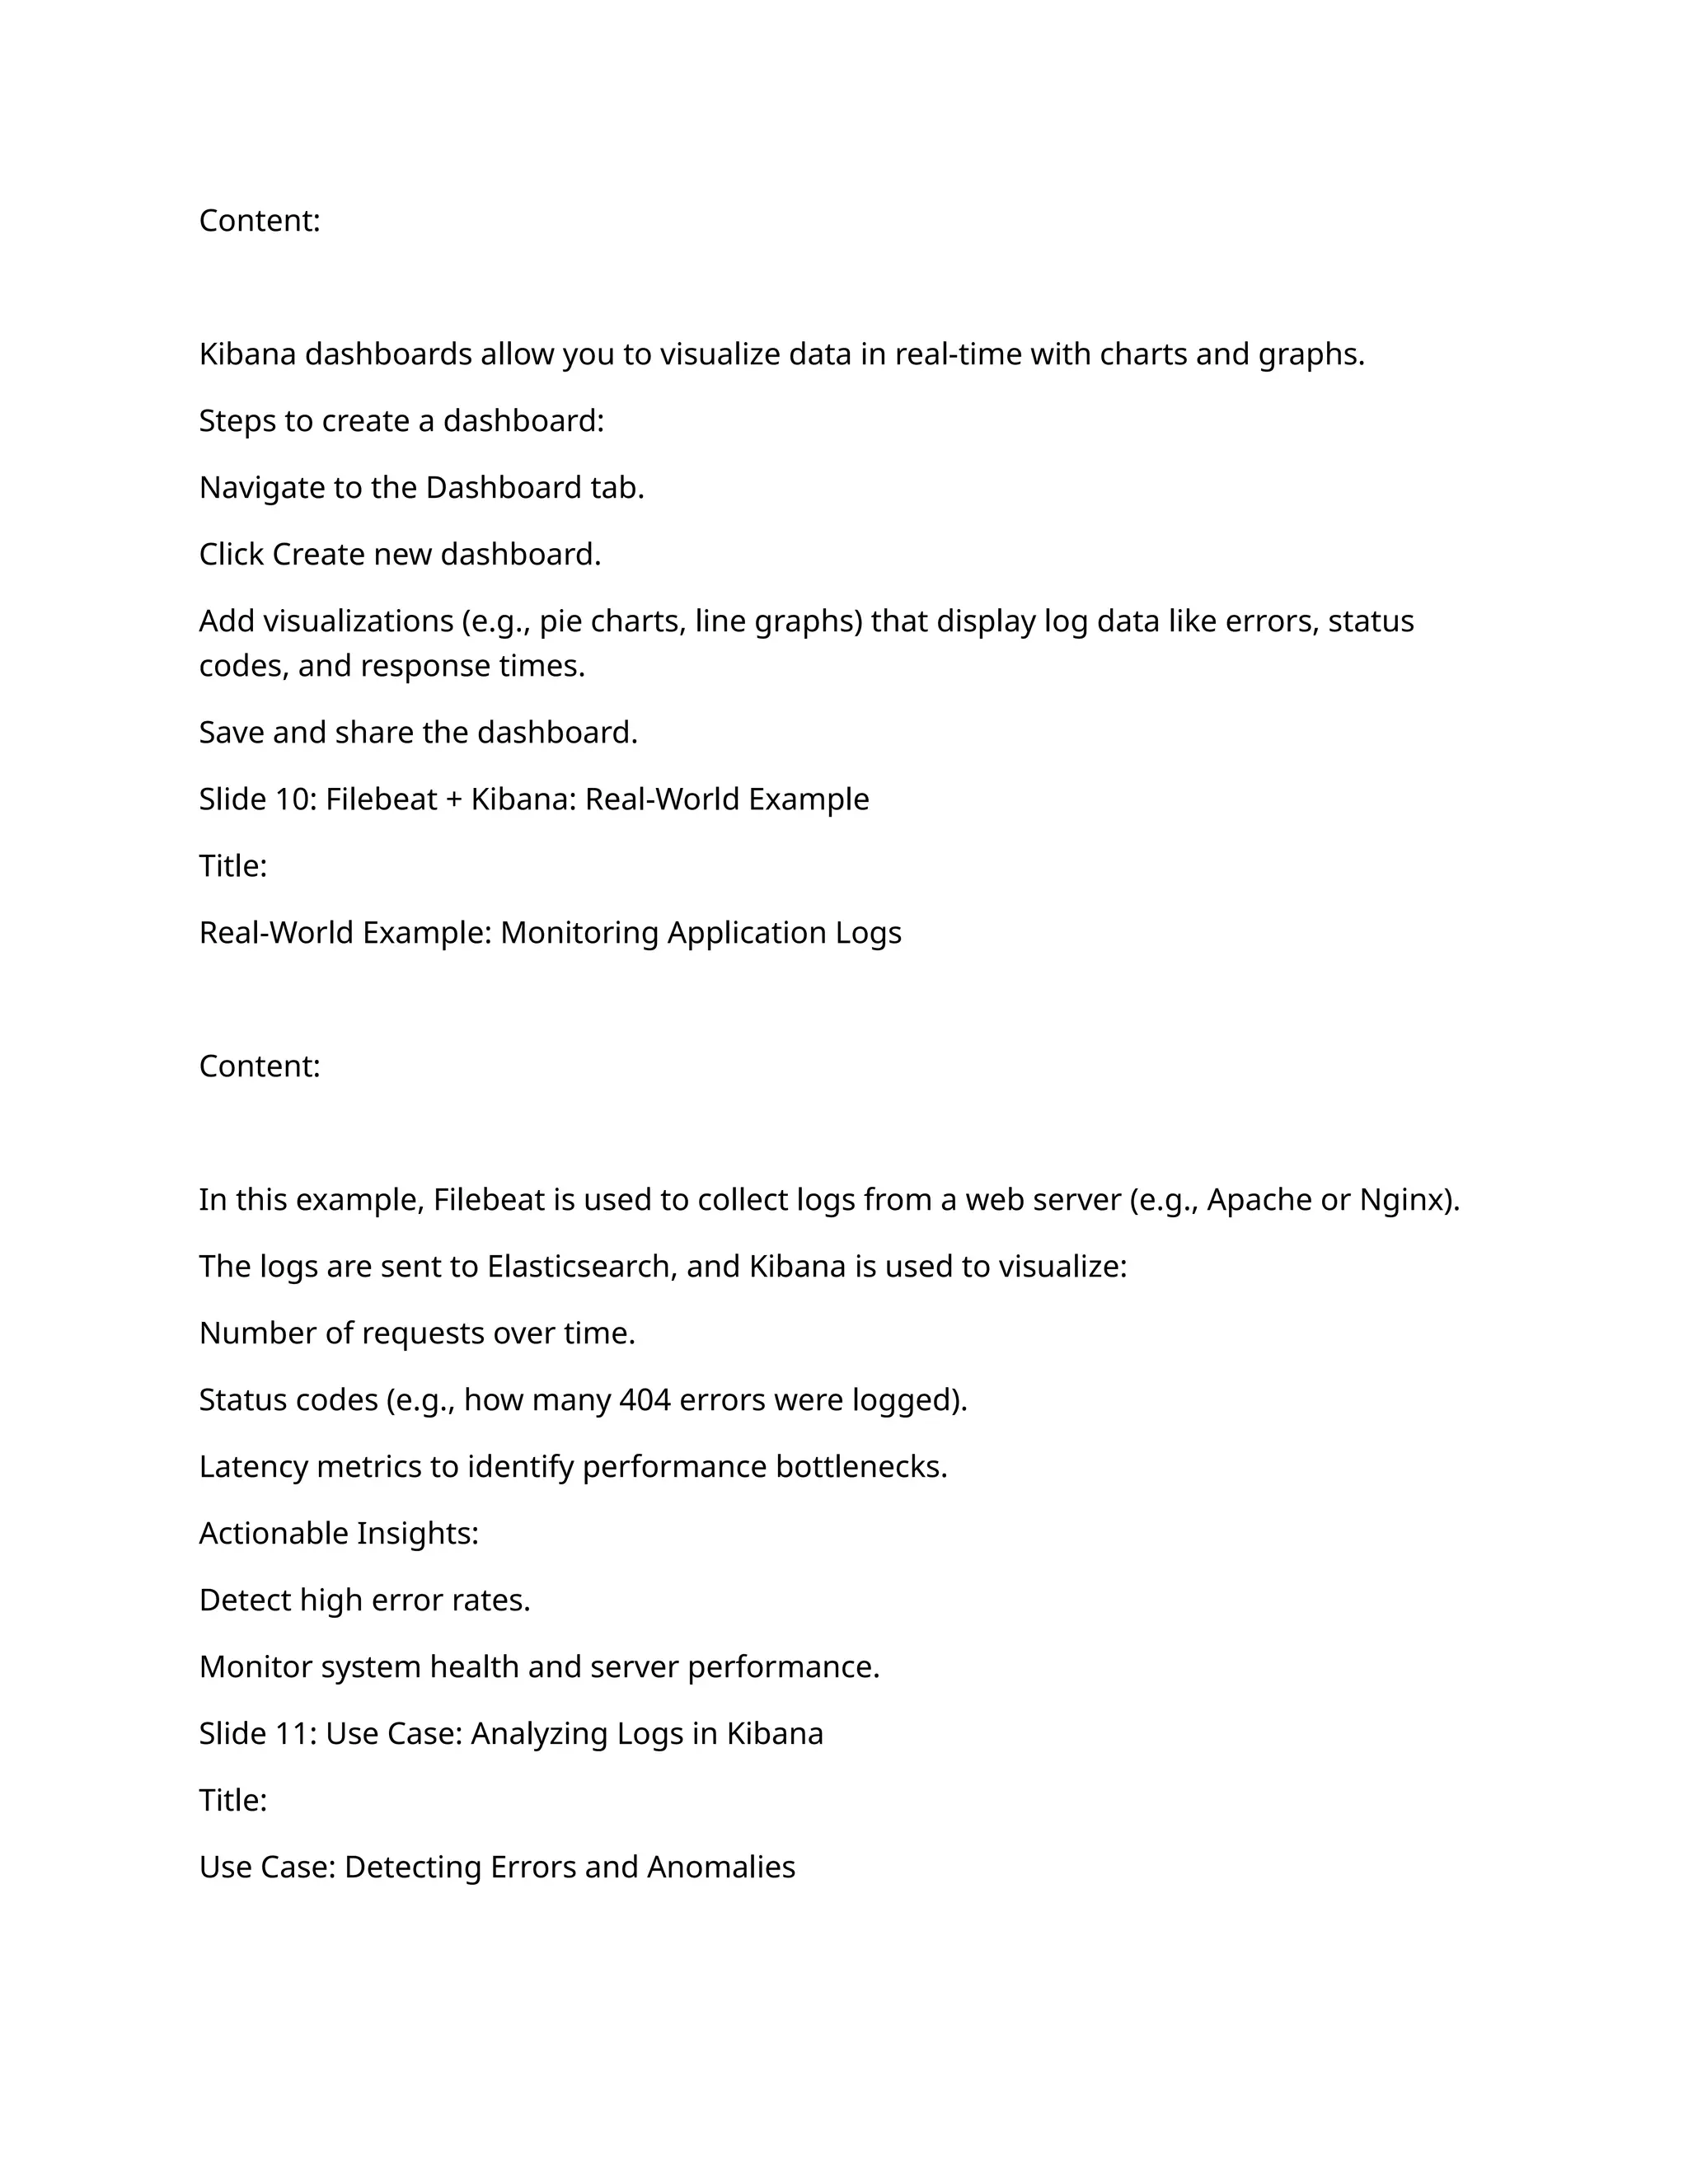
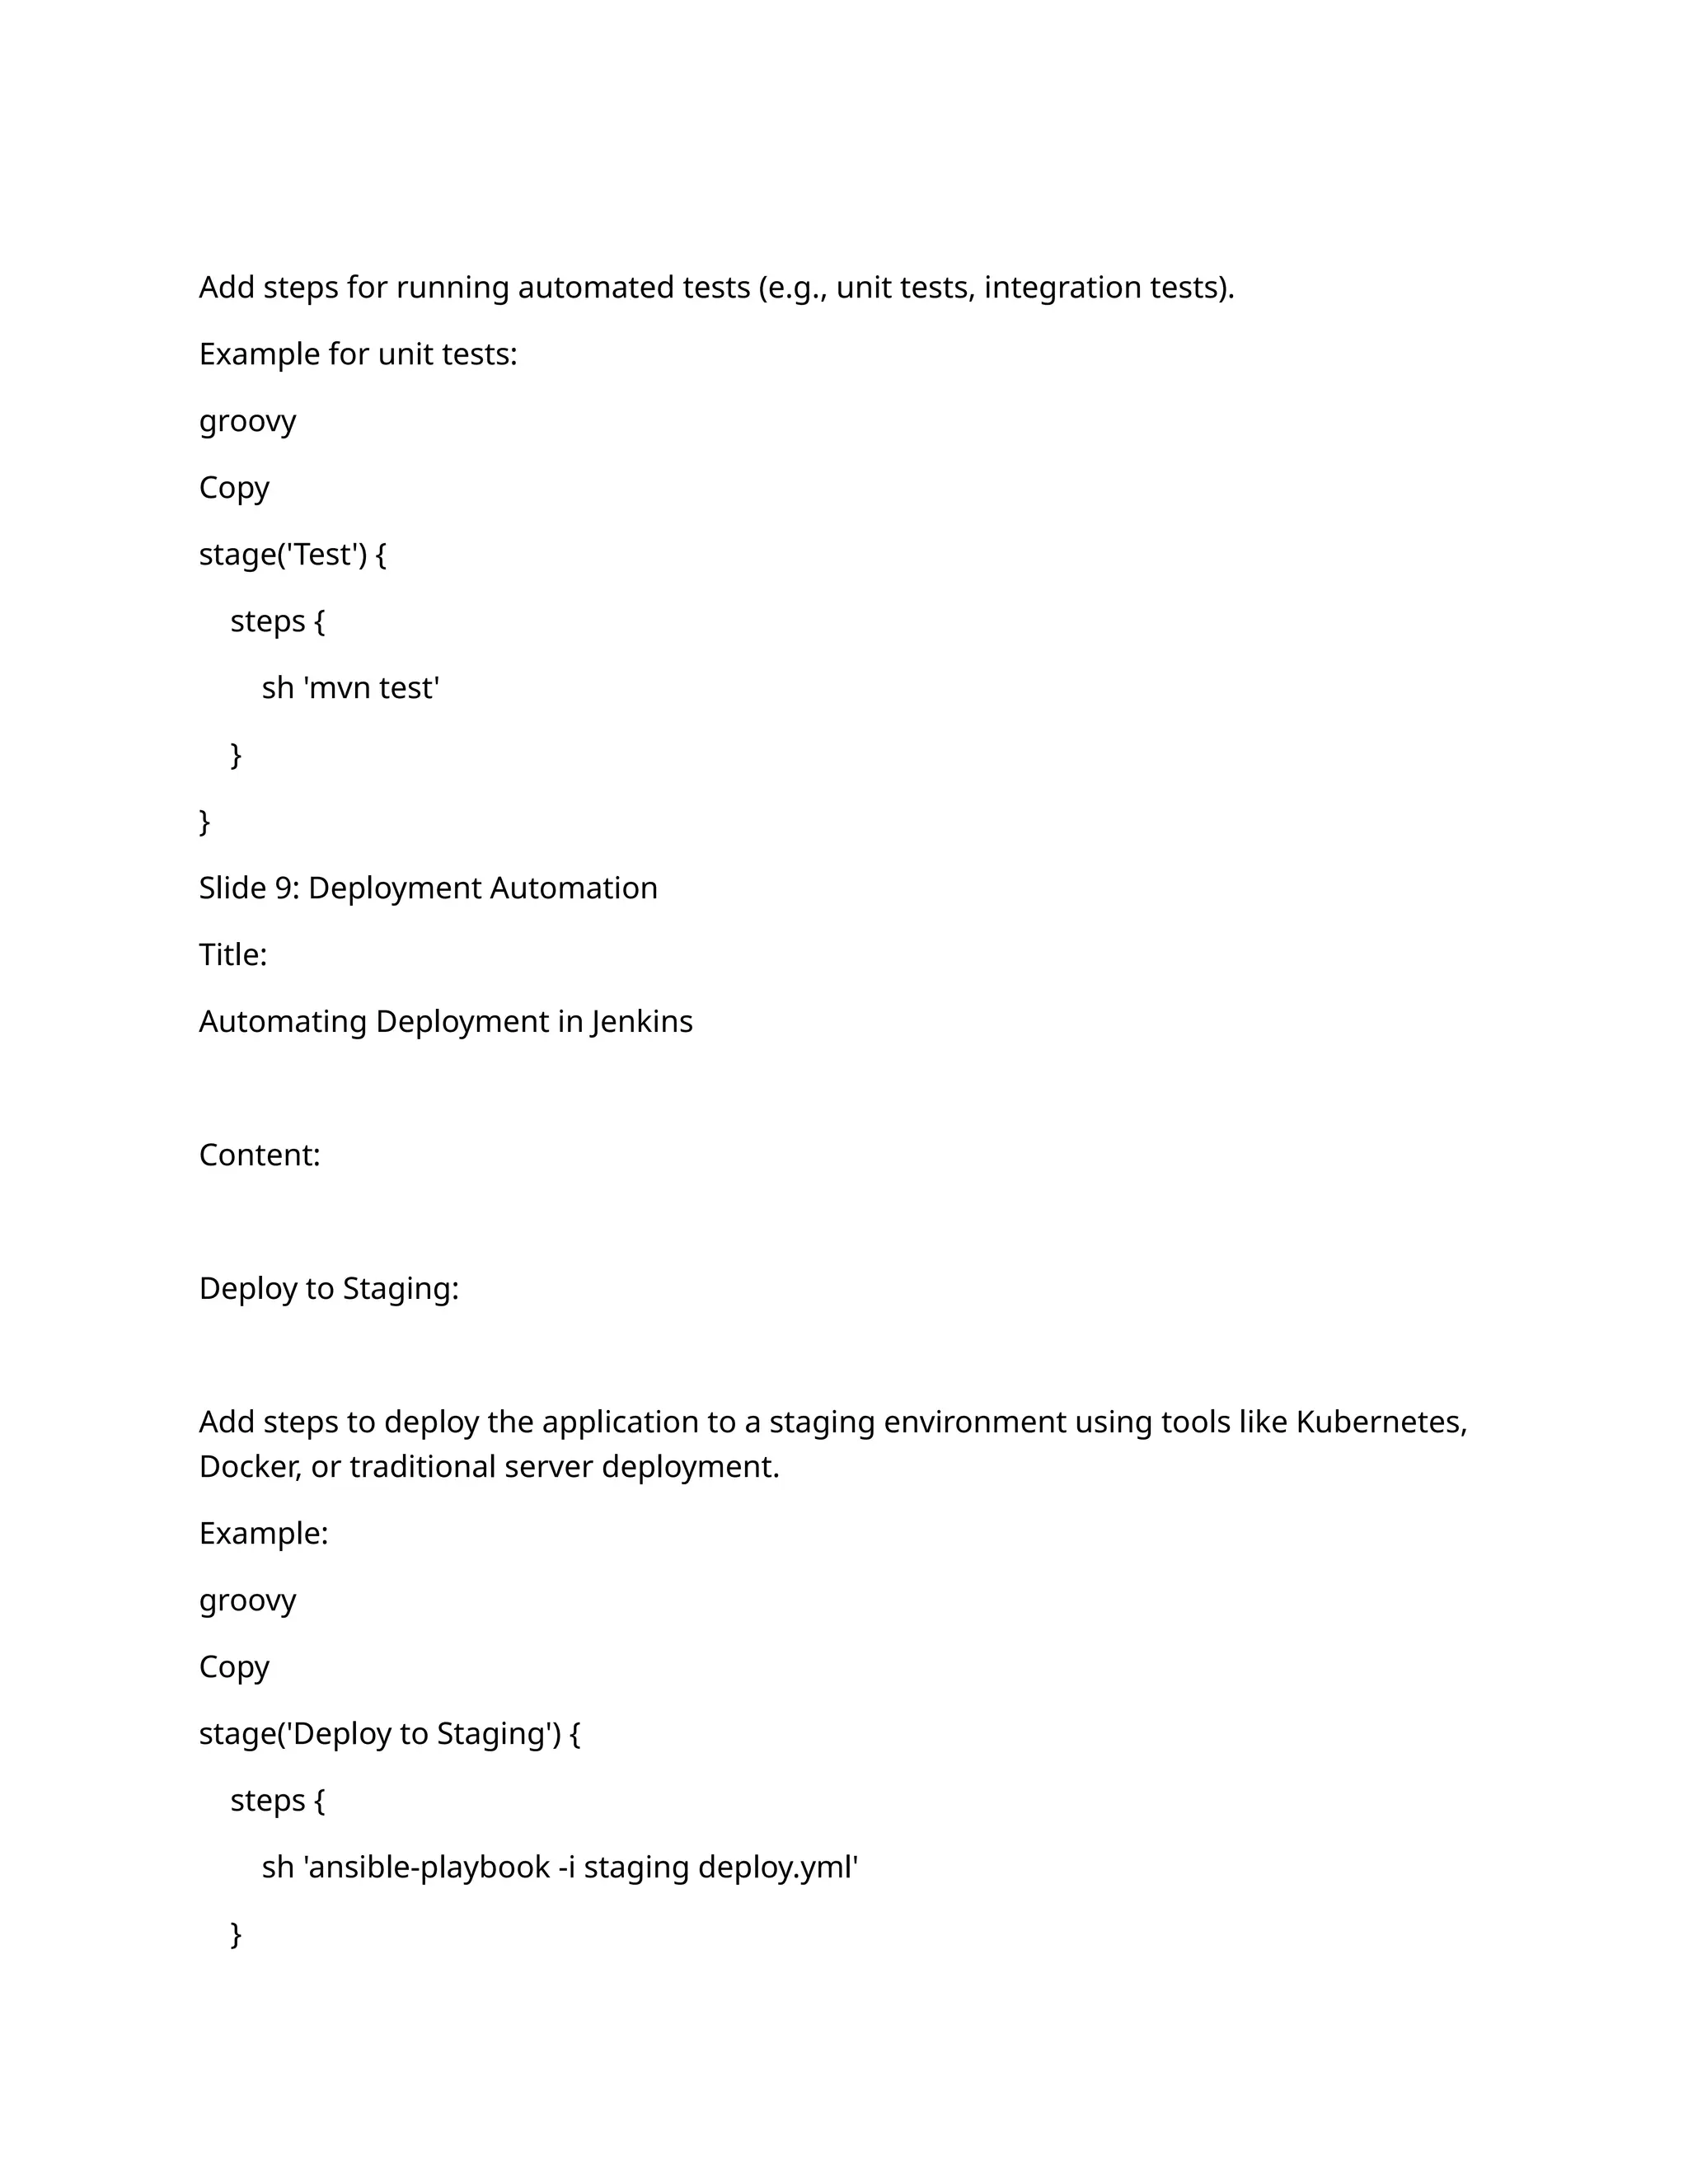
Log Format Integration Documentation
1. Log Format Overview
This log format is used for monitoring transactions and API requests across various stages
in the workflow. It provides comprehensive information on each API request and
response, the application, server details, and transaction-specific data.
2. Log Format Breakdown
The logs are structured in a standardized format to facilitate easy parsing and real-time
monitoring. Here's an explanation of the different log elements:
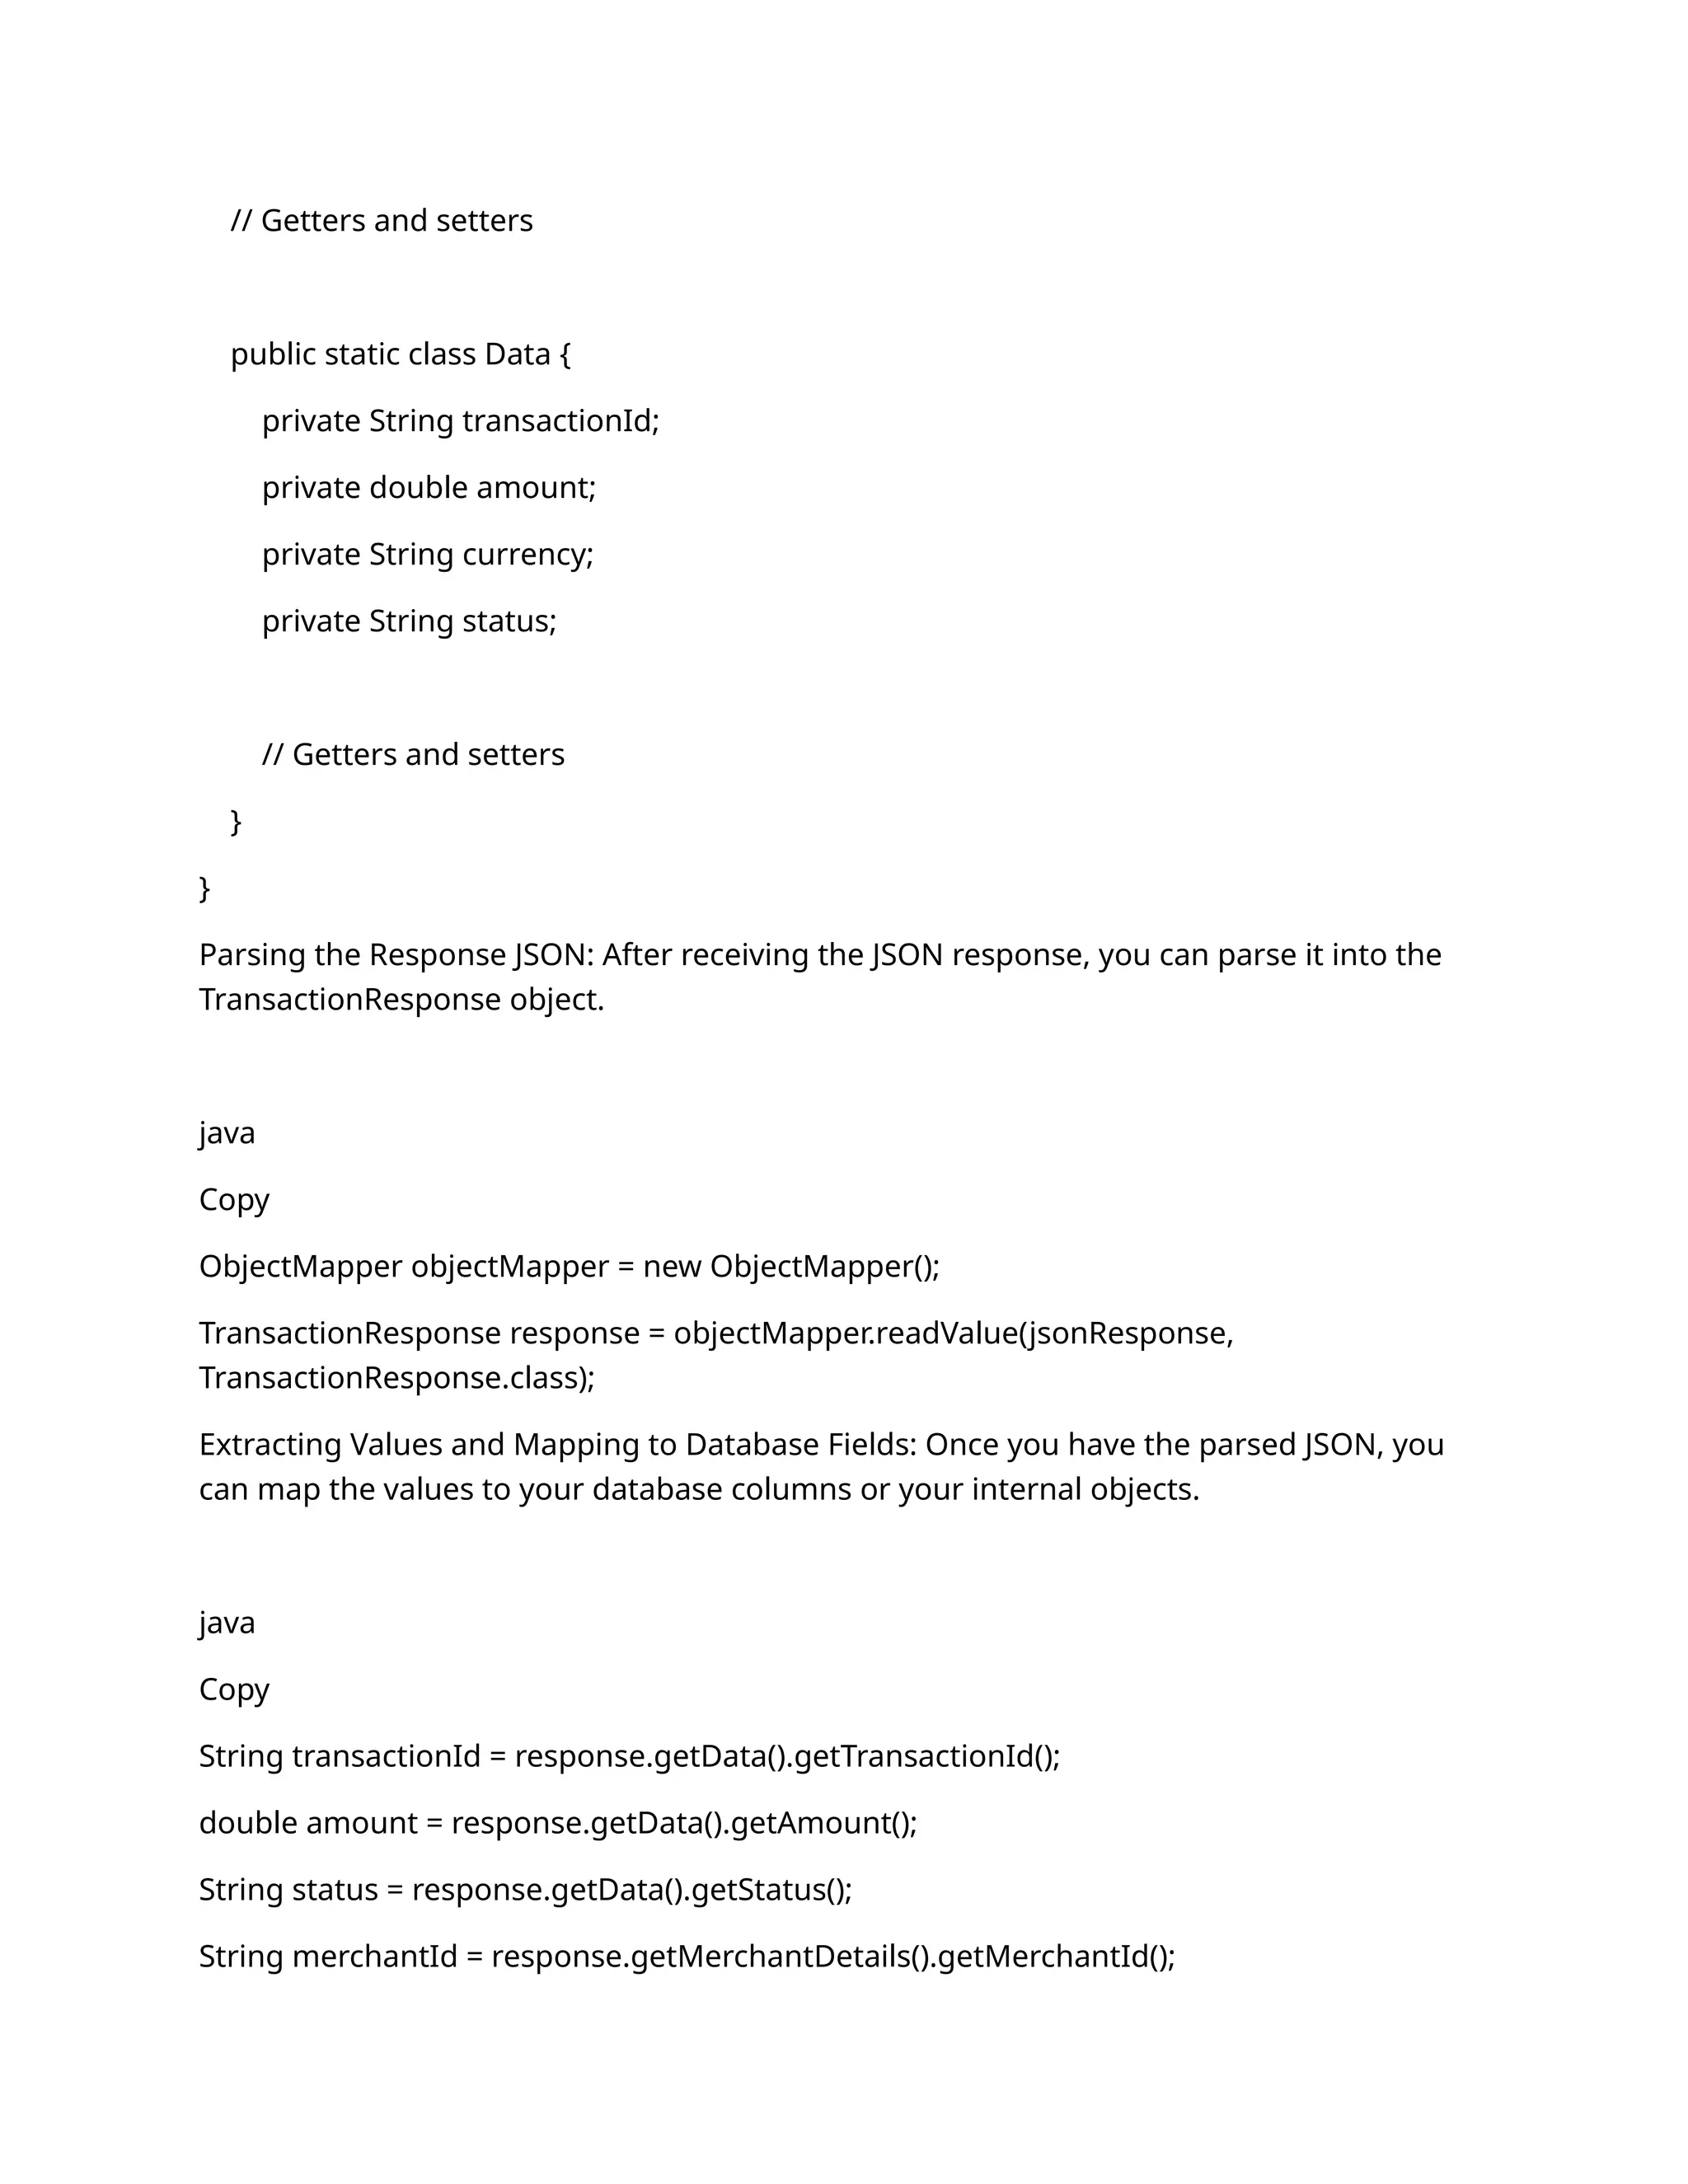
Log Example (Formatted for Clarity):
csharp
Copy
2025-01-27 17:53:49,235 INFO stni_txns_sync_log
[default task-15]
[APPLICATION: WLESB_WEB_PROFILES_UAT]
[SERVER_IP: 172.16.26.68]
[SERVER_NAME: wl-esbtest02-rhel8.ventureinfotek.com]
[REFERENCE_URL: https://default-host:8443/wlesb_txn/stni]](https://image.slidesharecdn.com/esbapplicationimprovementpdf-250202181658-d510e3e4/75/ESB-APPLICTAION-IMPROVEMENT-2024-this-19-2048.jpg)
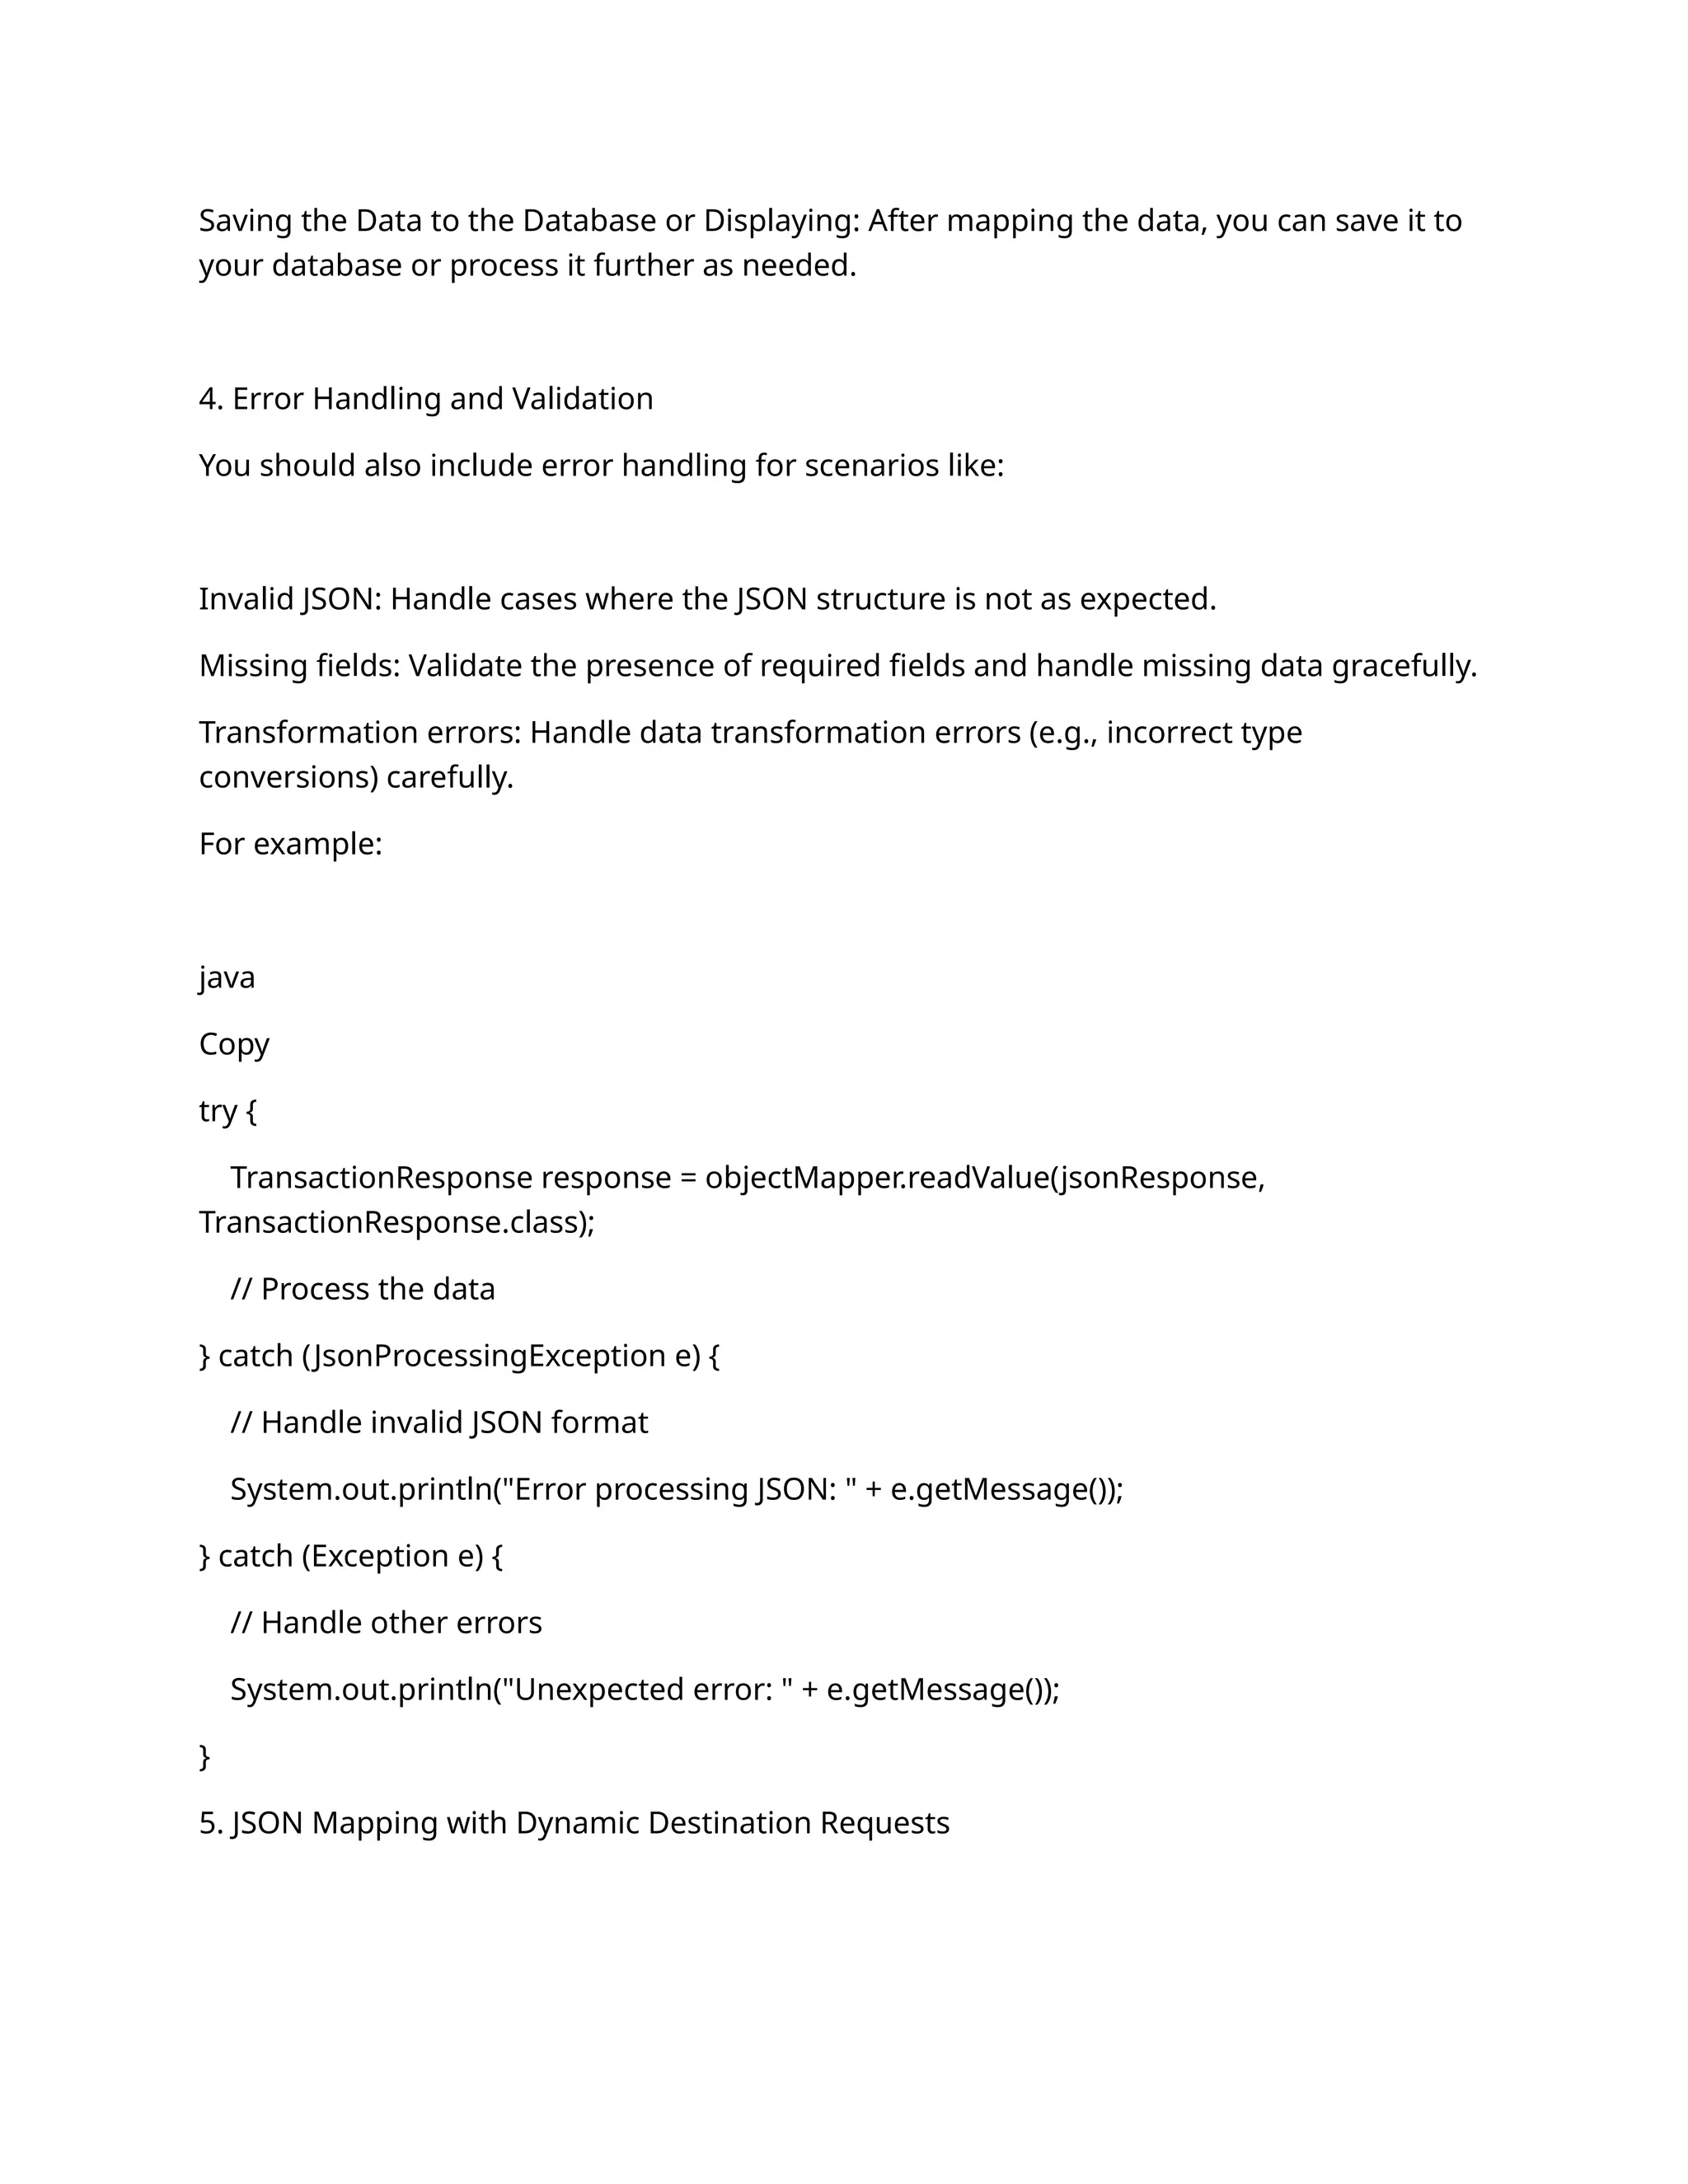
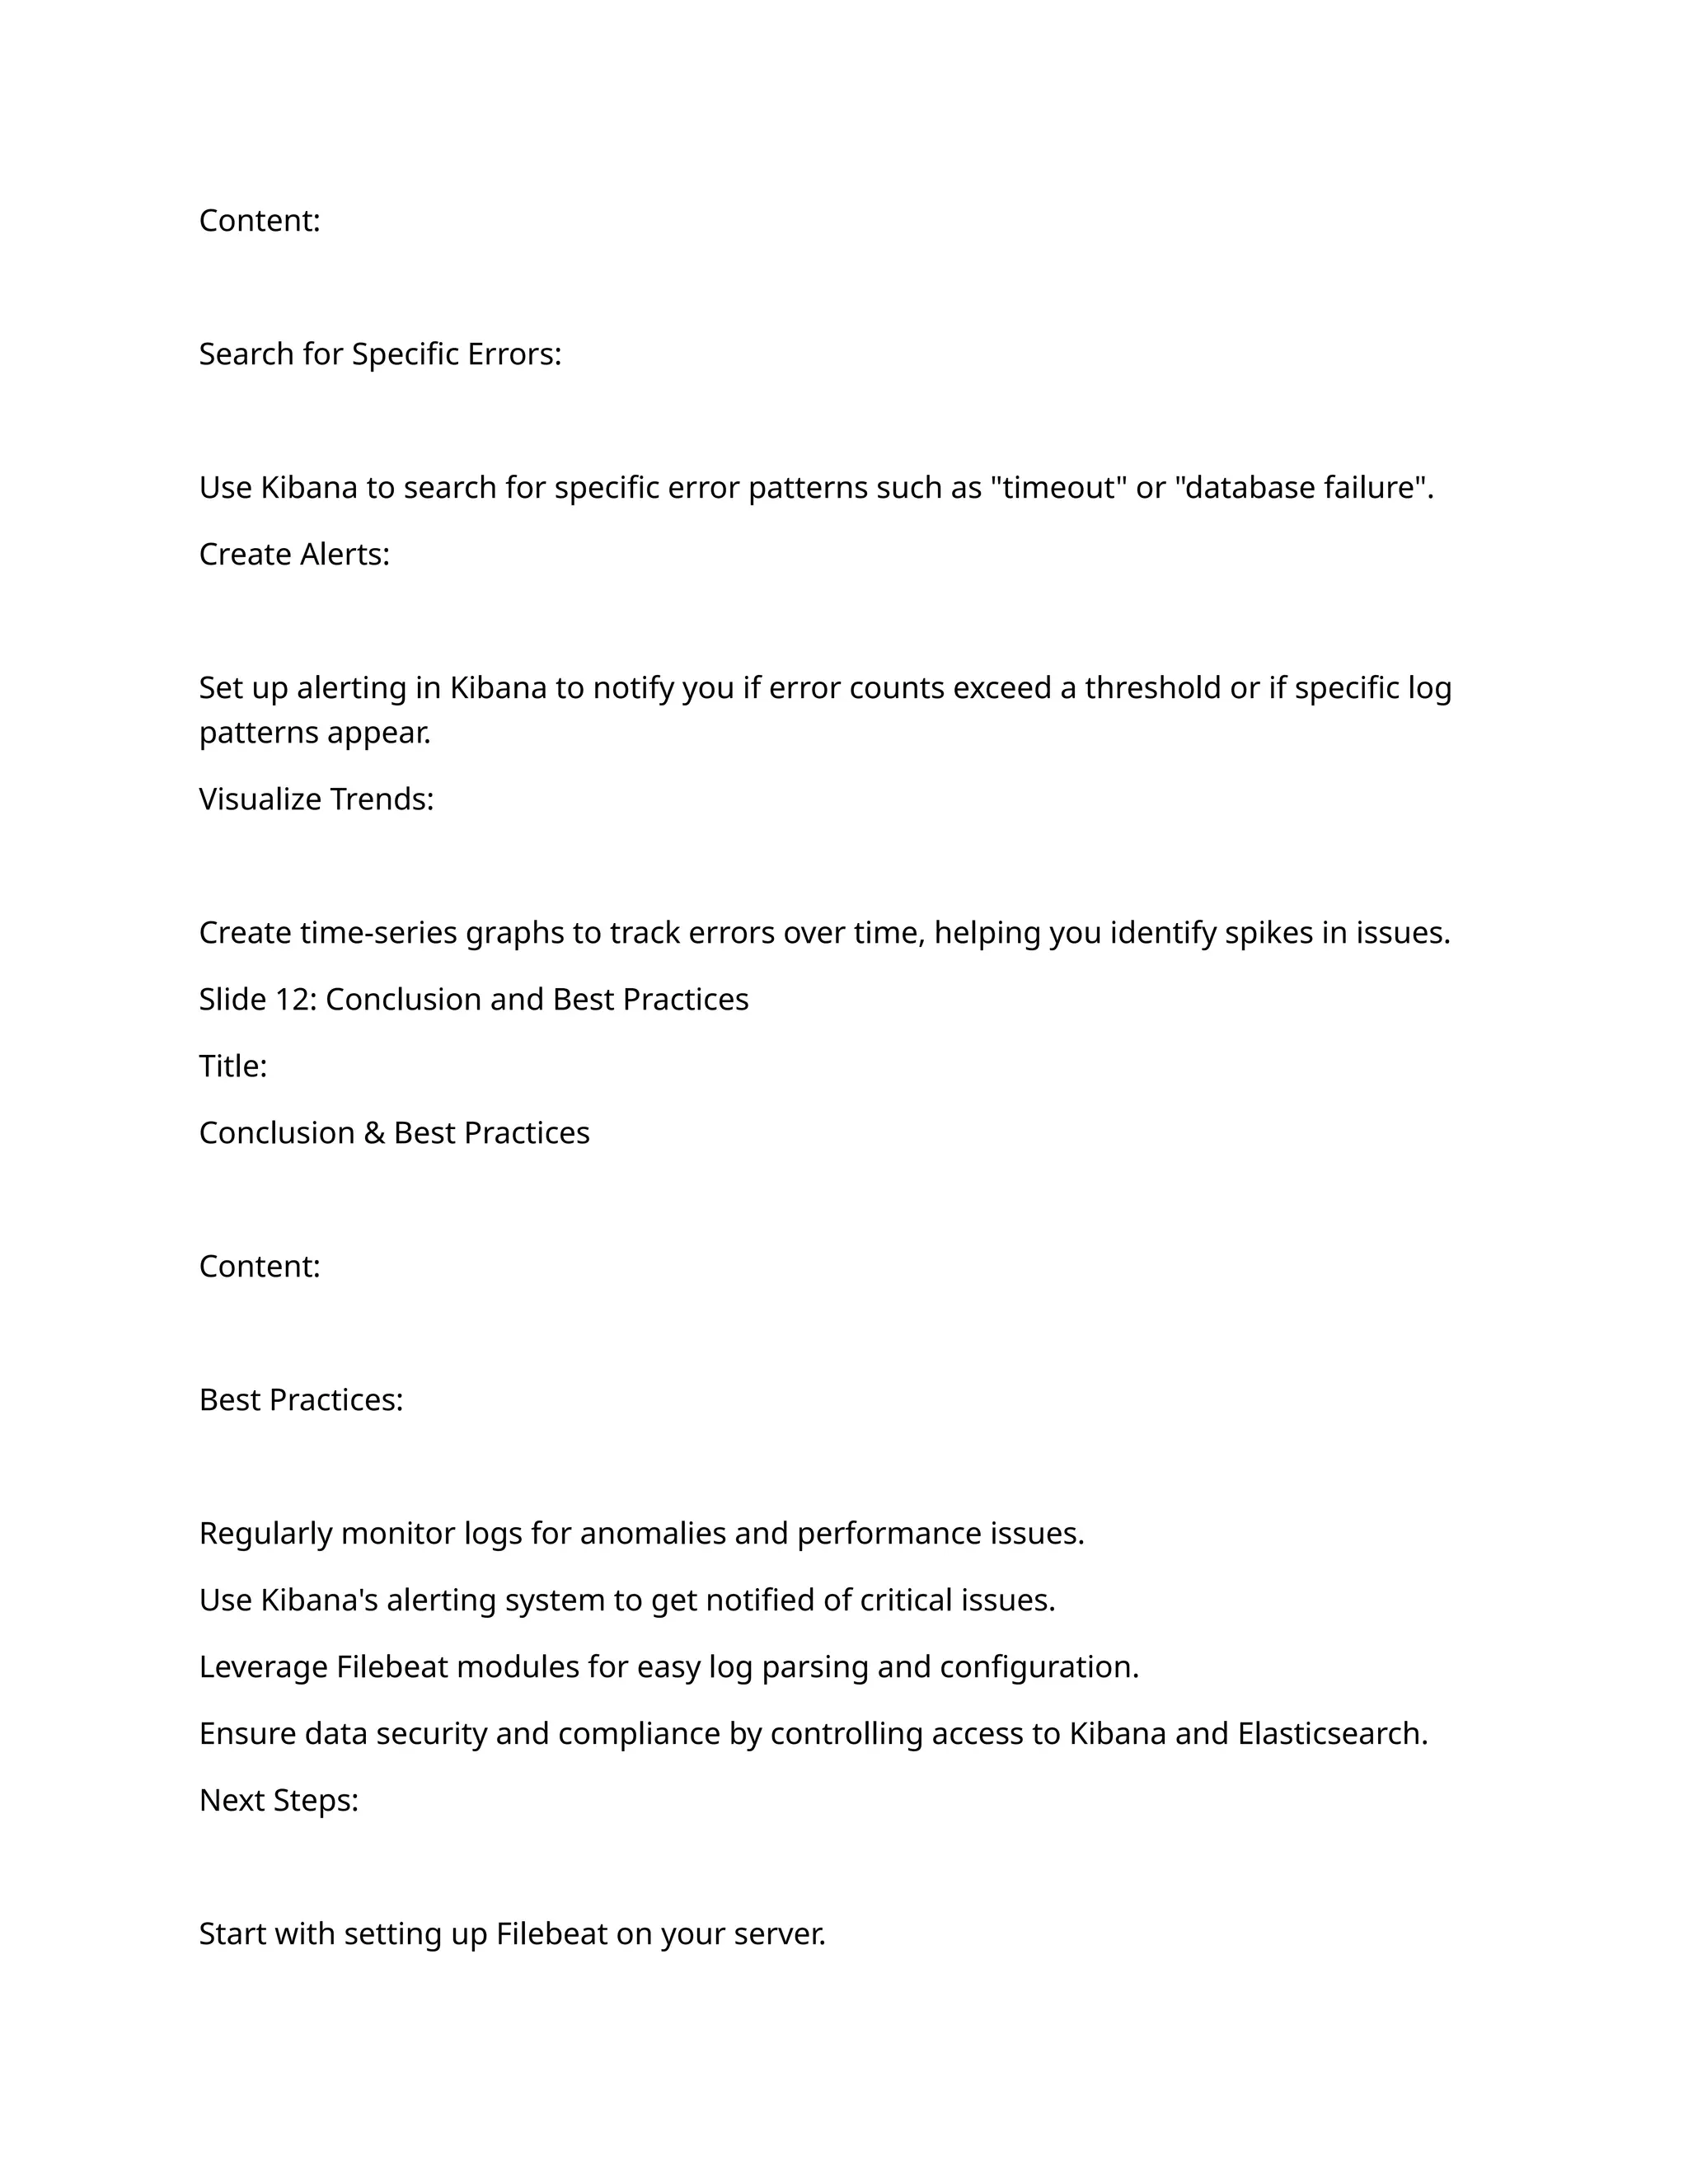
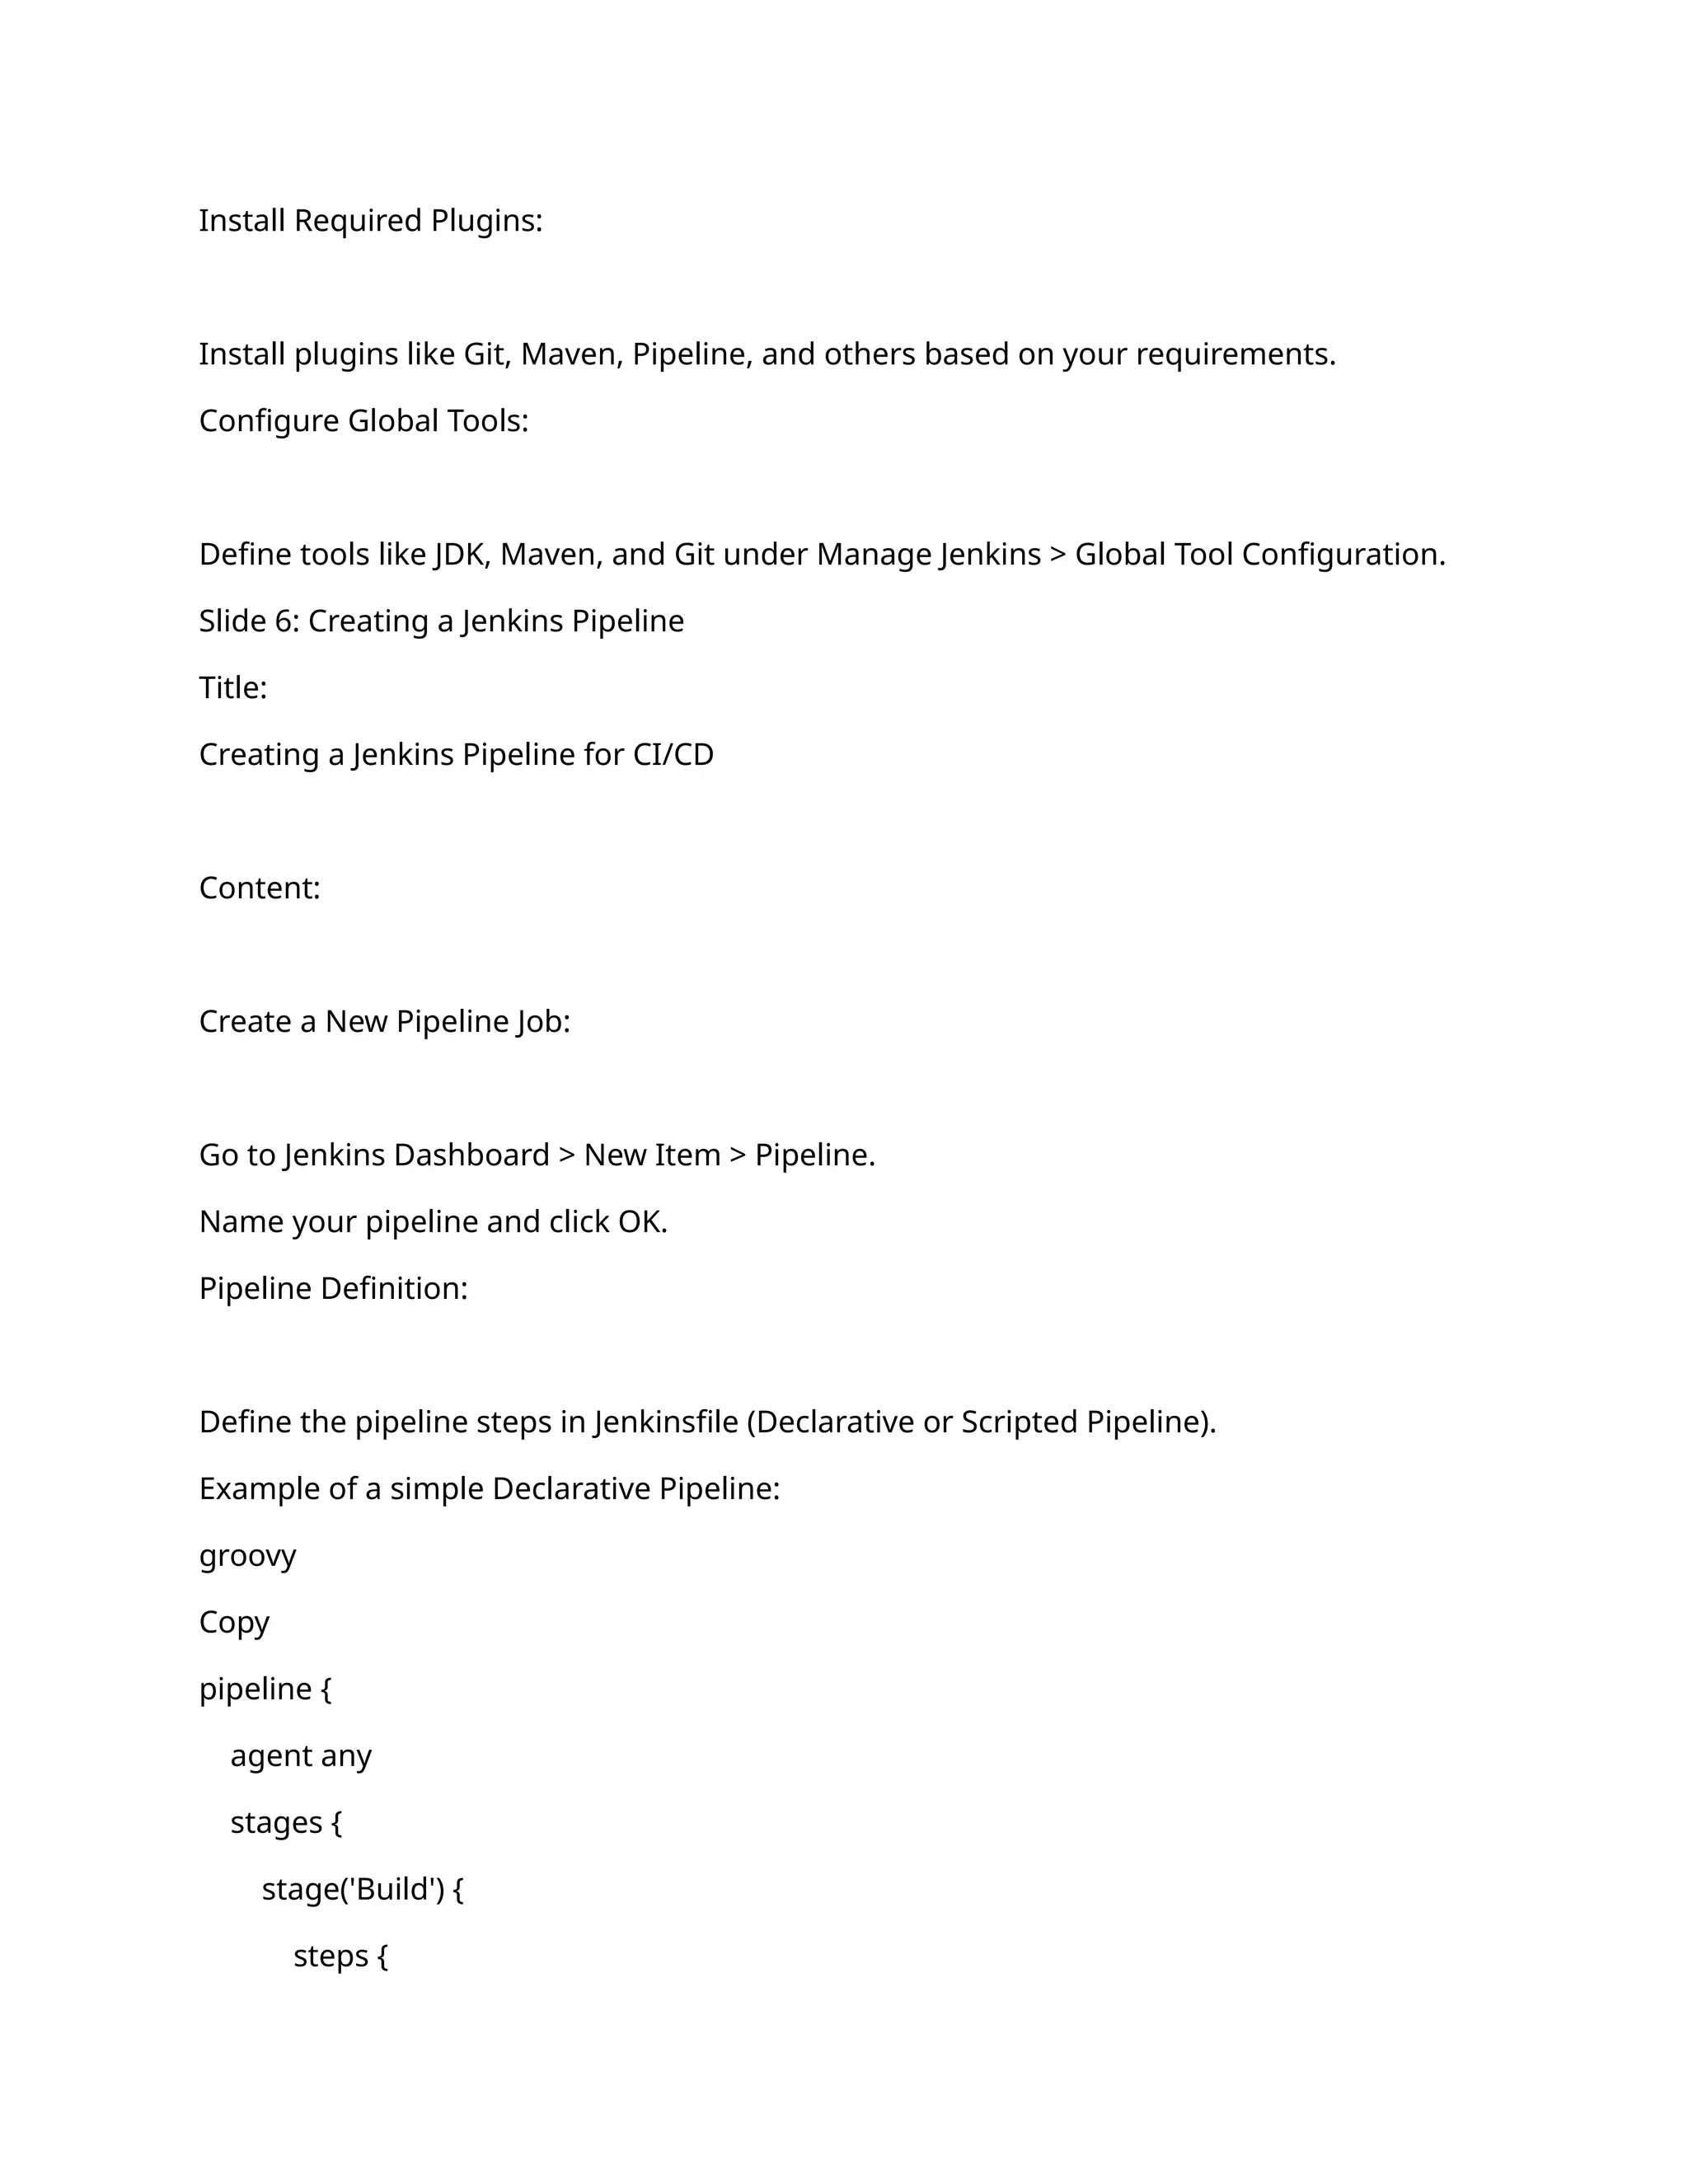
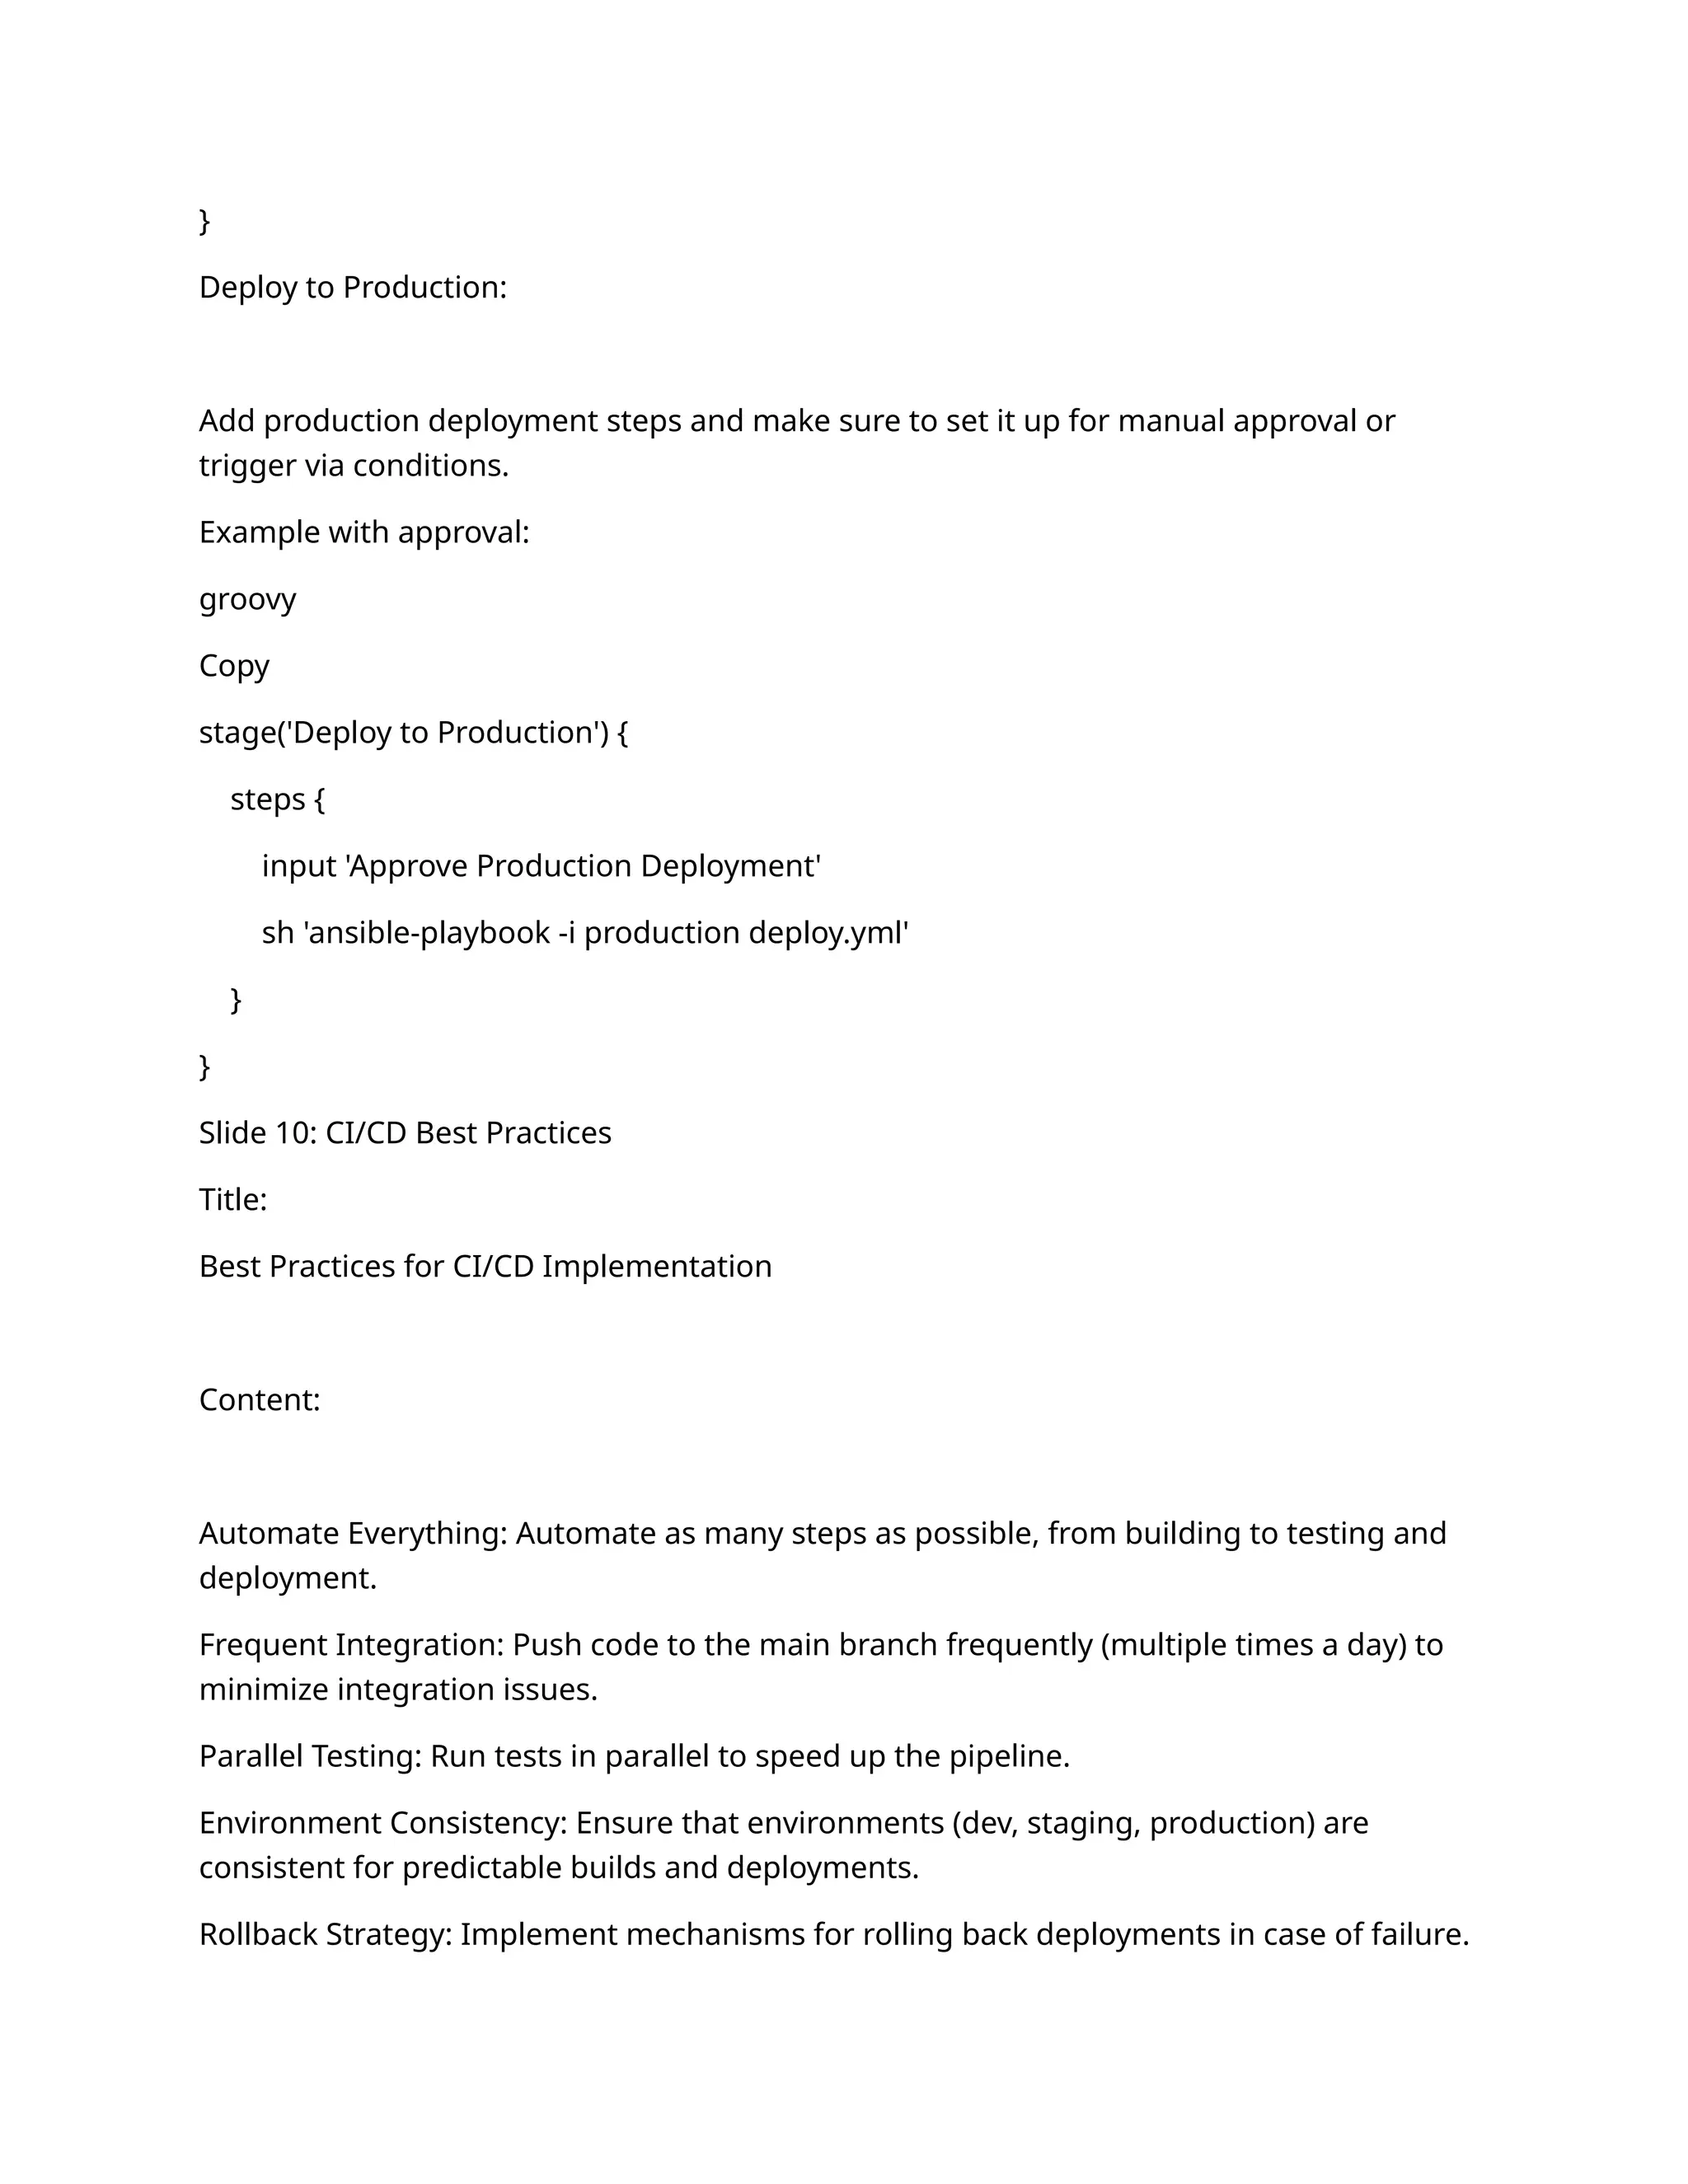
![[REMOTE_ADDR: 10.10.11.230]
[REMOTE_HOST: 10.10.11.230]
[USER_AGENT: WLP FO/1.0]
[EVENT: RECEIVED_DATA_FROM_SOURCE]
[CORRELATION_ID: 20df308f-46db-4a3d-905a-c58995e060f0-037149000330034-44770627-
00031-502712005336]
[RRN: 502712005336]
[MID: 037149000330034]
[TID: 44770627]
[BANK_CODE: 00031]
[API_REQUEST: {...}]
[TIME_TAKEN_MS: 0]
3. Key Fields and Their Purpose
Timestamp (2025-01-27 17:53:49,235):
Indicates the date and time of the log entry, including milliseconds for accurate time
tracking.
Log Level (INFO):
Specifies the severity or importance of the log entry (e.g., INFO, ERROR, WARN).
Logger Name (stni_txns_sync_log):
The name of the logger or the specific log category. This can help differentiate between
different modules or parts of the application.
Thread ([default task-15]):
Identifies the thread that generated the log entry. Useful for debugging multithreaded or
parallel processes.](https://image.slidesharecdn.com/esbapplicationimprovementpdf-250202181658-d510e3e4/75/ESB-APPLICTAION-IMPROVEMENT-2024-this-20-2048.jpg)
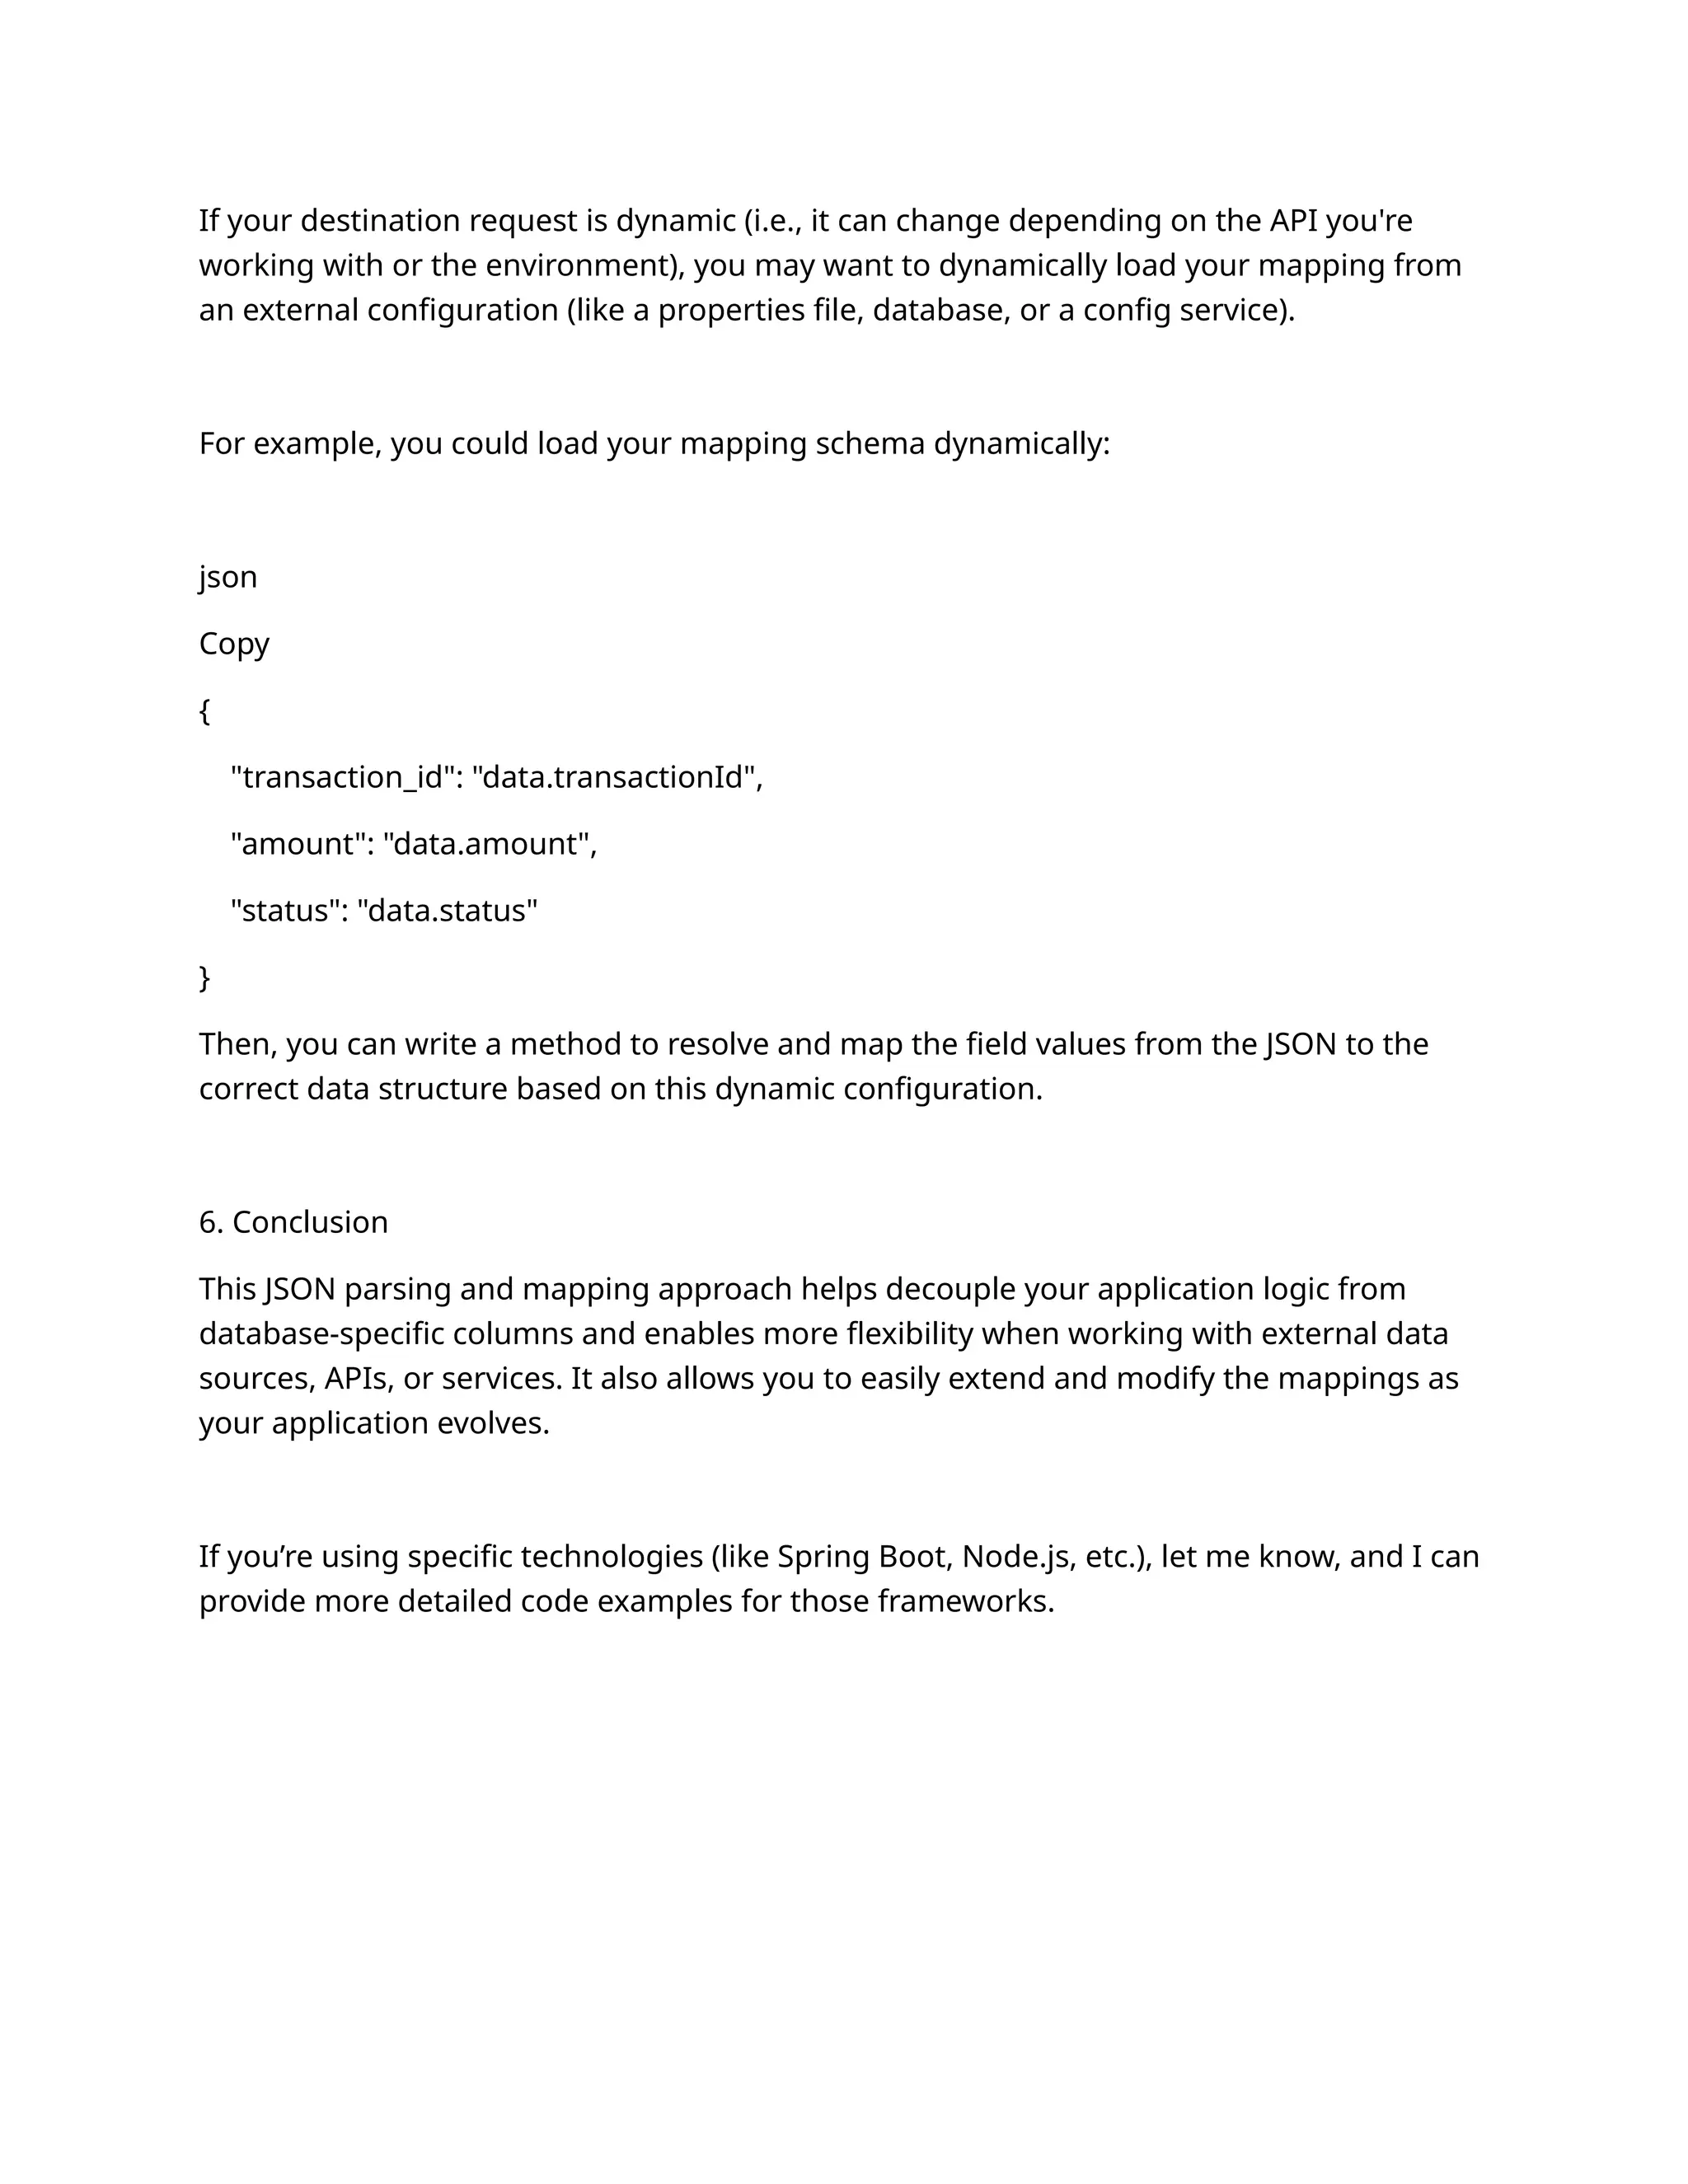
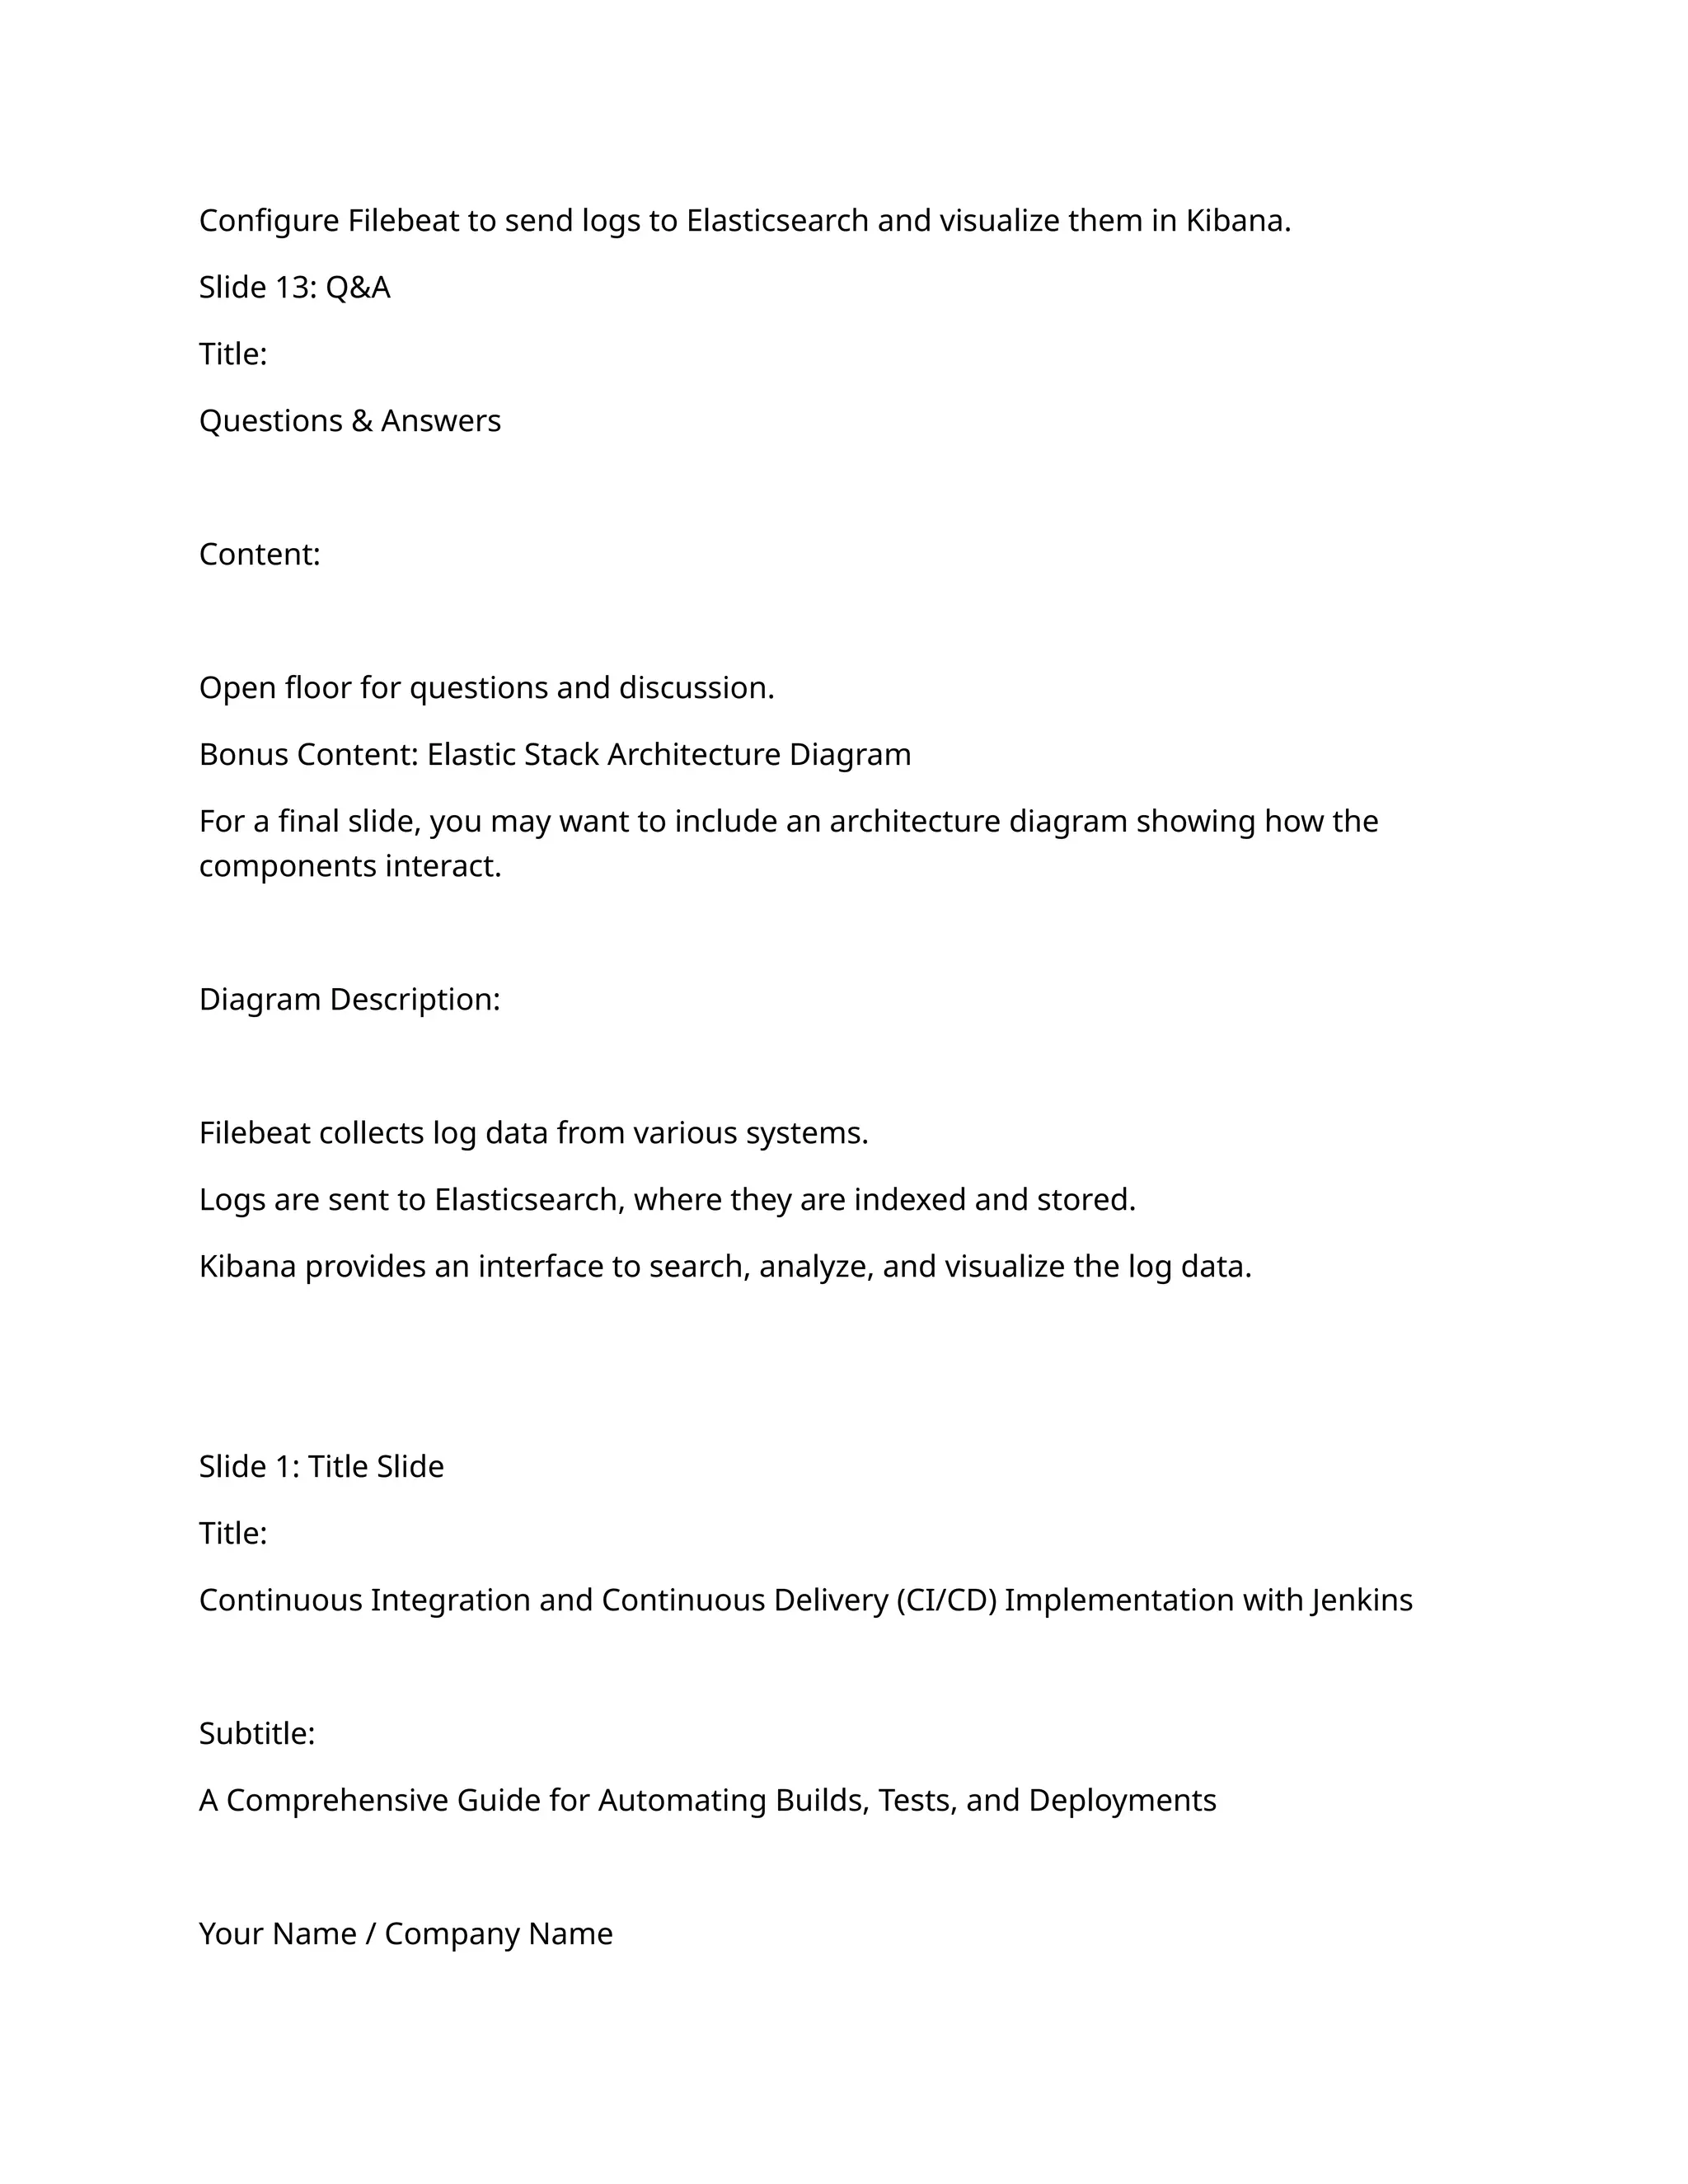
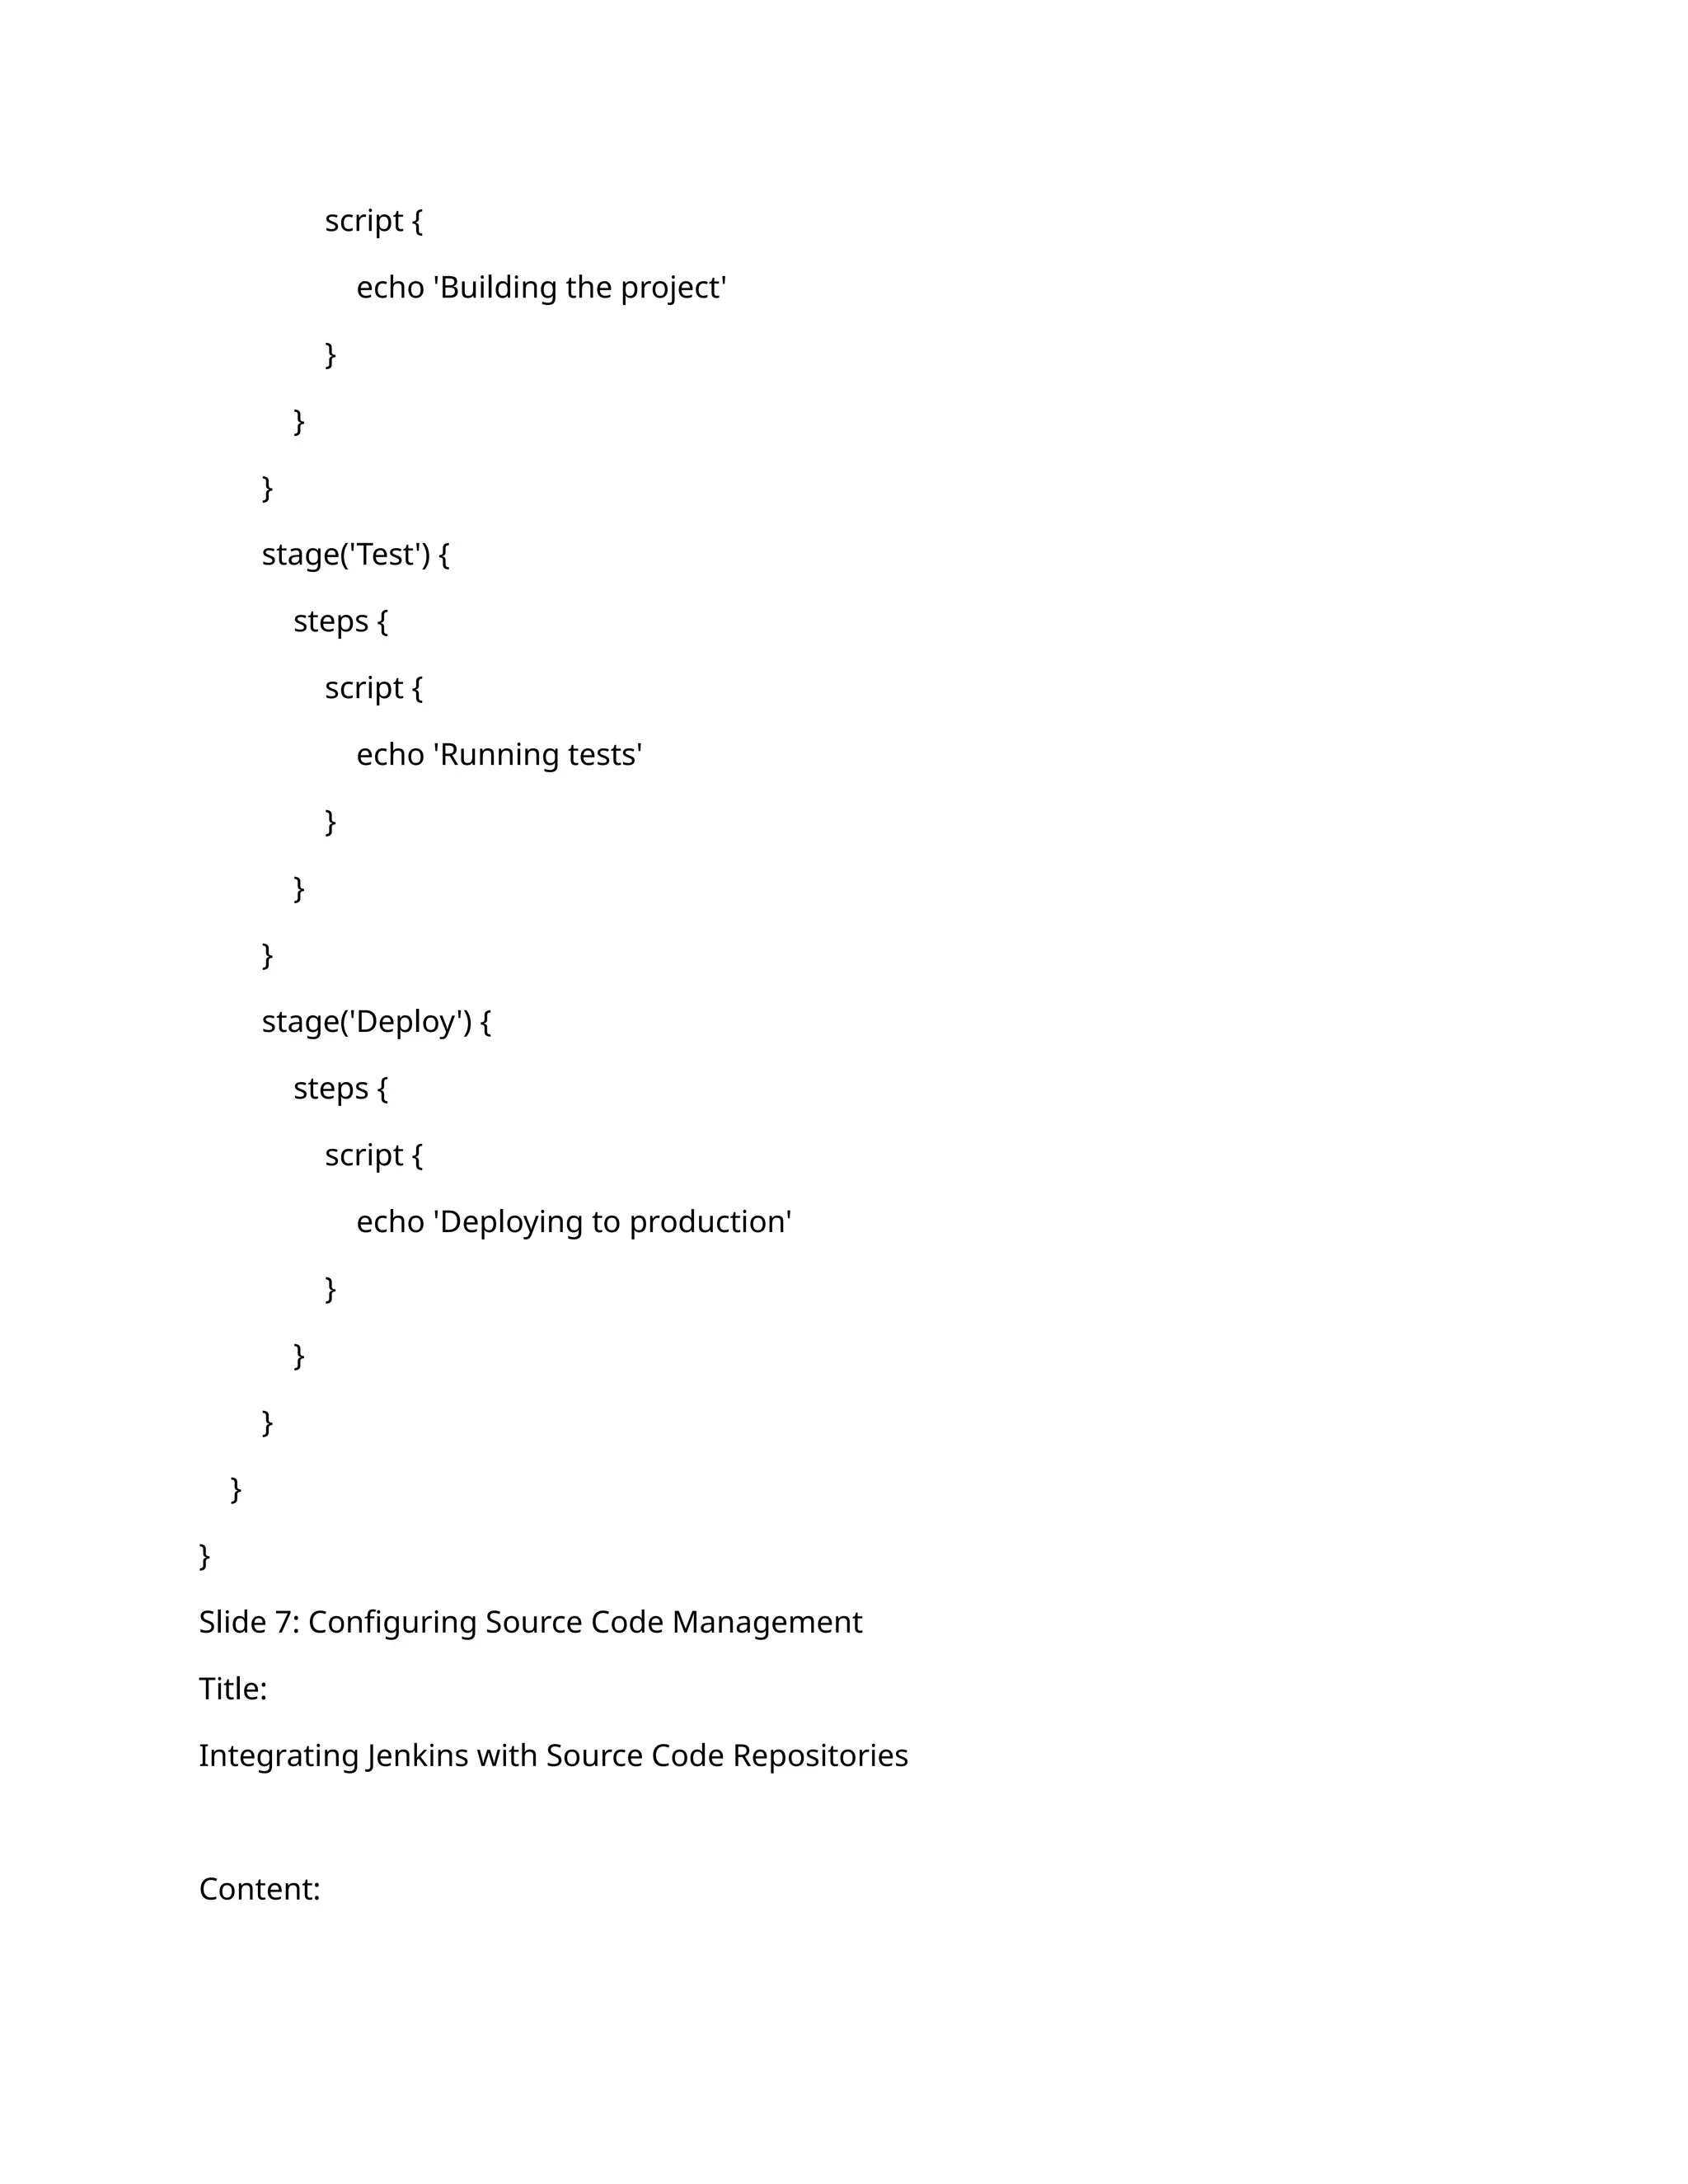
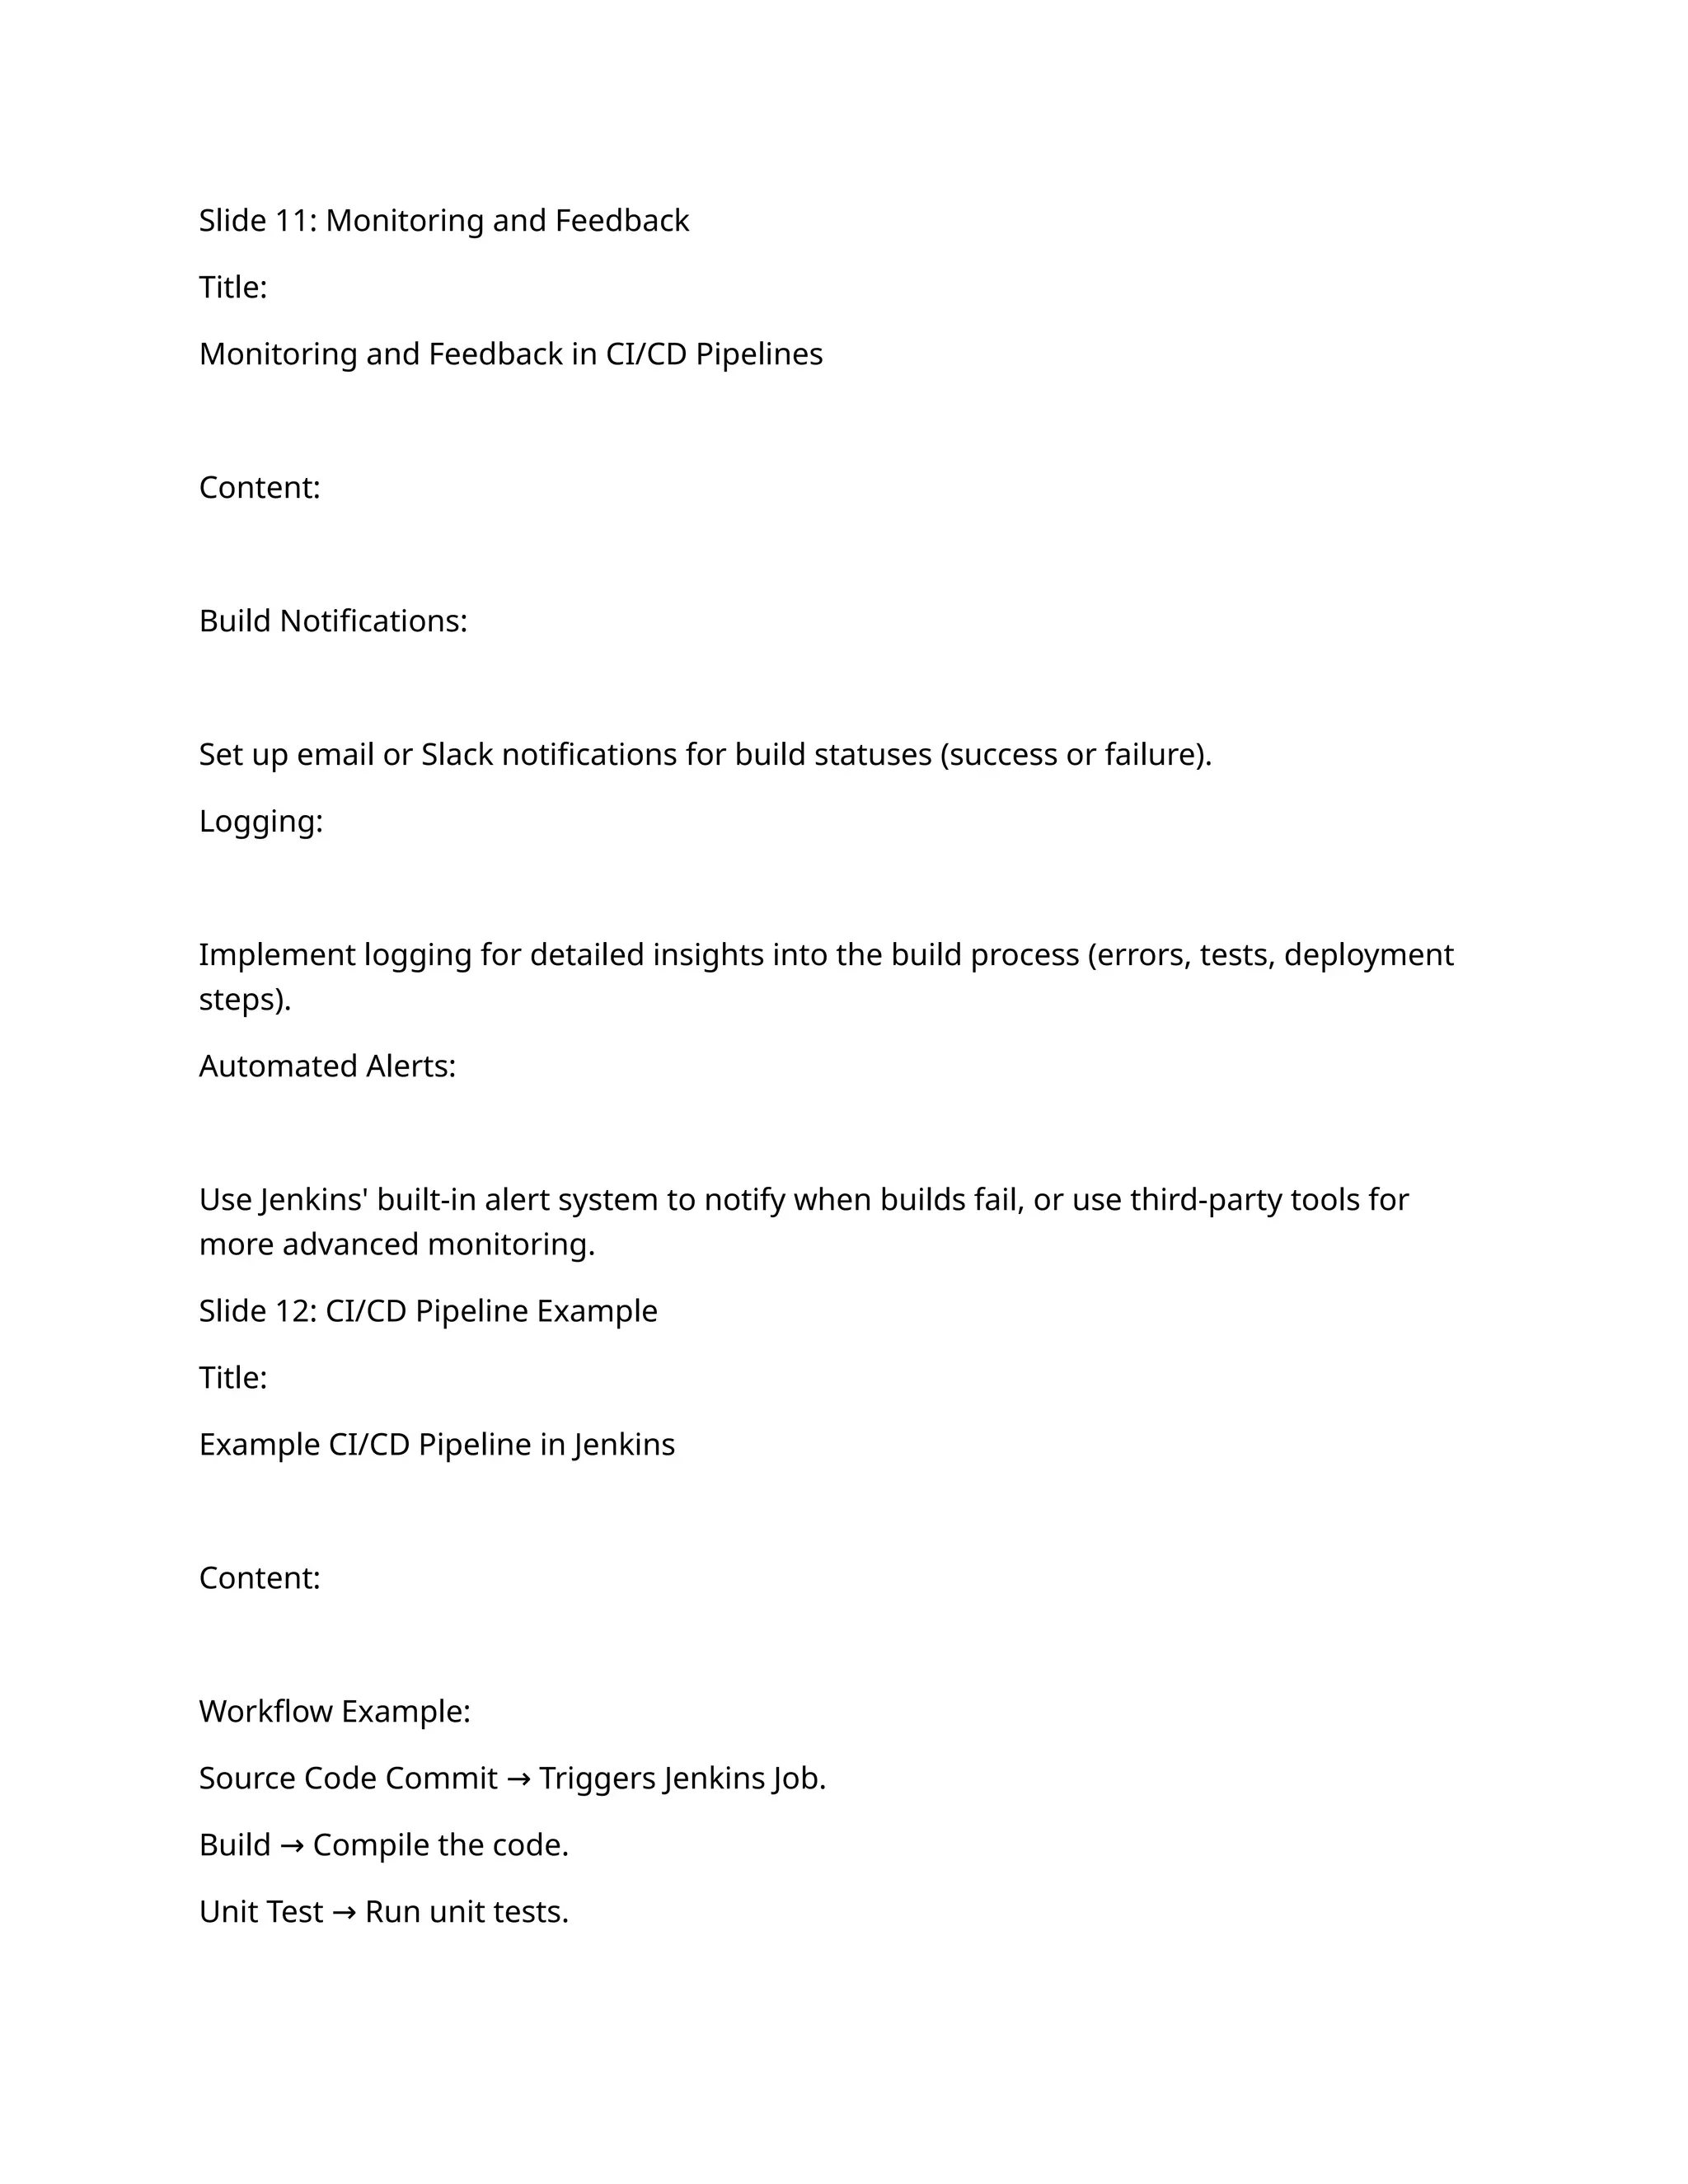
![Application ([APPLICATION: WLESB_WEB_PROFILES_UAT]):
Identifies the application context generating the log. This can be critical for distinguishing
between different environments (e.g., UAT, PROD).
Server Information:
SERVER_IP: The IP address of the server generating the log.
SERVER_NAME: The server name or hostname for traceability in production or
development environments.
URL and IP Information:
REFERENCE_URL: The URL being accessed or processed (e.g., endpoint or API path).
REMOTE_ADDR: The source IP address (can be the client or external service).
REMOTE_HOST: The host for the source of the request.
User Agent ([USER_AGENT: WLP FO/1.0]):
Describes the client or tool making the request (useful for API or service identification).
Event Type ([EVENT: RECEIVED_DATA_FROM_SOURCE]):
Describes the action or event taking place, such as data receipt or a response from a
service.
Correlation ID ([CORRELATION_ID: 20df308f-46db-4a3d-905a-c58995e060f0-
037149000330034-44770627-00031-502712005336]):
A unique identifier for tracing the request flow across various systems or microservices.
Transaction Identifiers:
RRN: Unique reference number for the transaction.](https://image.slidesharecdn.com/esbapplicationimprovementpdf-250202181658-d510e3e4/75/ESB-APPLICTAION-IMPROVEMENT-2024-this-21-2048.jpg)
![MID: Merchant ID associated with the transaction.
TID: Terminal ID identifying the point-of-sale or system.
BANK_CODE: Bank or financial institution's code associated with the transaction.
API Request/Response:
API_REQUEST: JSON string representing the request data sent to the API.
API_RESPONSE: JSON string representing the API response data.
Performance Metrics ([TIME_TAKEN_MS: 0]):
Time in milliseconds taken to process the request. It helps in performance monitoring and
identifying bottlenecks.
4. Integrating the Log Format in a CI/CD Pipeline
To fully integrate this log format into your CI/CD process, follow these steps:
Set Up Log Collection:
Use centralized logging tools like ELK Stack (Elasticsearch, Logstash, Kibana) or Splunk to
aggregate logs from various services.
Configure the logging system to collect logs from your Jenkins pipeline or your application
directly to a central log repository.
Define Log Parsing Rules:
Create custom log parsers for the specific structure you have. For instance:
Timestamp: Extract and parse the timestamp to sort logs by date/time.
Log Level: Filter logs based on severity to control alerting.
Event Types: Set alerts for specific events like RECEIVED_DATA_FROM_SOURCE or
DATA_INSERTED_TO_DB.](https://image.slidesharecdn.com/esbapplicationimprovementpdf-250202181658-d510e3e4/75/ESB-APPLICTAION-IMPROVEMENT-2024-this-22-2048.jpg)