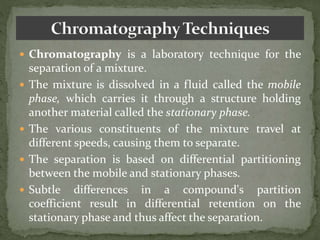
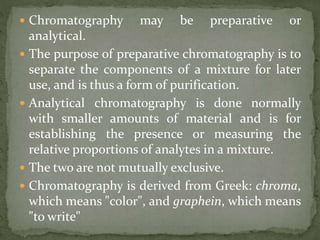
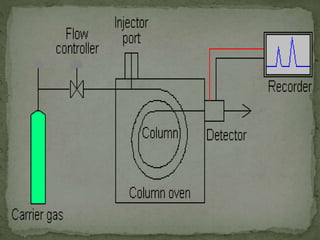
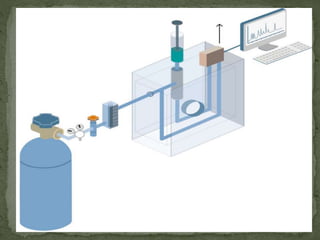
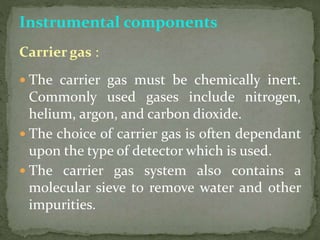
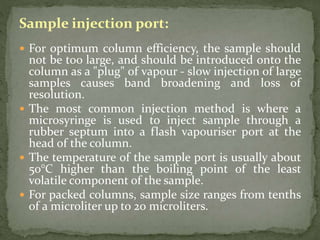
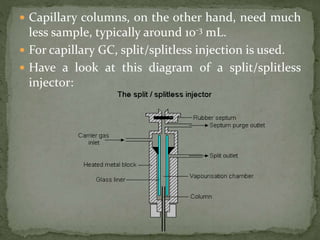
Mr. Abhirup Ganguli
Assistant Professor
Dept. of Biotechnology
Swami Vivekananda Institute of
Modern Science
 Chromatography is a laboratory technique for the
separation of a mixture.
 The mixture is dissolved in a fluid called the mobile
phase, which carries it through a structure holding
another material called the stationary phase.
 The various constituents of the mixture travel at
different speeds, causing them to separate.
 The separation is based on differential partitioning
between the mobile and stationary phases.
 Subtle differences in a compound's partition
coefficient result in differential retention on the
stationary phase and thus affect the separation.
 Chromatography may be preparative or
analytical.
 The purpose of preparative chromatography is to
separate the components of a mixture for later
use, and is thus a form of purification.
 Analytical chromatography is done normally
with smaller amounts of material and is for
establishing the presence or measuring the
relative proportions of analytes in a mixture.
 The two are not mutually exclusive.
 Chromatography is derived from Greek: chroma,
which means "color", and graphein, which means
"to write"
 It is an analytical technique for separating and
identifying mixtures that are or can be coloured,
especially pigments.
 This can also be used in secondary or primary
schools in ink experiments.
 This method has been largely replaced by thin layer
chromatography; however it is still a powerful
teaching tool.
 Two-way paper chromatography, also called two-
dimensional chromatography, involves using two
solvents and rotating the paper 90° in between.
 This is useful for separating complex mixtures of
similar compounds, for example, amino acids.
 A small, ideally concentrated spot of solution that
contains the sample is applied to a strip of
chromatography paper about 1 cm from the base,
usually using a capillary tube for maximum precision.
 This sample is absorbed onto the paper and may form
interactions with it.
 Any substance that reacts or bonds with the paper
cannot be measured using -Solvent front technique.
 The paper is then dipped into a suitable solvent, such
as ethanol or water, taking care that the spot is above
the surface of the solvent, and placed in a sealed
container.
 The solvent moves up the paper by capillary action,
which occurs as a result of the attraction of the solvent
molecules to the paper and to one another.
 As the solvent rises through the paper it meets and
dissolves the sample mixture, which will then
travel up the paper with the solvent.
 Different compounds in the sample mixture travel
at different rates due to differences in solubility in
the solvent, and due to differences in their
attraction to the fibers in the paper.
 Paper chromatography takes anywhere from
several minutes to several hours.
 In some cases, paper chromatography does not
separate pigments completely; this occurs when
two substances appear to have the same values in a
particular solvent.
 In these cases, two-way chromatography is used to
separate the multiple-pigment spots.
 The chromatogram is turned by ninety degrees, and
placed in a different solvent in the same way as before;
some spots separate in the presence of more than one
pigment.
 As before, the value is calculated, and the two
pigments are identified.
 The Rf value (retention factor) is the distance travelled
by a particular component from the origin (where the
sample was originally spotted) as a ratio to the distance
travelled by the solvent front from the origin.
 Rf values for each substance will be unique, and can be
used to identify components.
 A particular component will have the same Rf value if
it is separated under identical conditions.
 After development, the spots corresponding to different
compounds may be located by their colour, ultraviolet
light, ninhydrin (Triketohydrindane hydrate) or by
treatment with iodine vapours.
 The final chromatogram can be compared with other
known mixture chromatograms to identify sample mixture
using the Rn value.
 As in most other forms of chromatography, paper
chromatography uses Rn values to help identify
compounds.
 Rf values are calculated by dividing the distance the
pigment travels up the paper by the distance the solvent
travels (the solvent front).
 Because Rf values are standard for a given compound,
known Rn values can be used to aid in the identification of
an unknown substance in an experiment.
 Displacement chromatography is a chromatography
technique in which a sample is placed onto the head of
the column and is then displaced by a solute that is
more strongly sorbed than the components of the
original mixture.
 The result is that the components are resolved into
consecutive “rectangular” zones of highly
concentrated pure substances rather than solvent-
separated “peaks”.
 It is primarily a preparative technique; higher product
concentration, higher purity, and increased
throughput may be obtained compared to other
modes of chromatography.
Discovery:
 The advent of displacement chromatography can be
attributed to Arne Tiselius, who in 1943 first classified
the modes of chromatography as frontal, elution, and
displacement.
 Displacement chromatography found a variety of
applications including isolation of transuranic
elements and biochemical entities.
 The technique was redeveloped by Csaba Horváth,
who employed modern high-pressure columns and
equipment.
 It has since found many applications, particularly in
the realm of biological macromolecule purification.
Principle:
 The basic principle of displacement chromatography
is: there are only a finite number of binding sites for
solutes on the matrix (the stationary phase), and if a
site is occupied by one molecule, it is unavailable to
others.
 As in any chromatography, equilibrium is established
between molecules of a given kind bound to the
matrix and those of the same kind free in solution.
 Because the number of binding sites is finite, when the
concentration of molecules free in solution is large
relative to the dissociation constant for the sites, those
sites will mostly be filled.
 This results in a downward-curvature in the plot of
bound vs free solute, in the simplest case giving a
Langmuir isotherm.
 A molecule with a high affinity for the matrix
(the displacer) will compete more effectively
for binding sites, leaving the mobile phase
enriched in the lower-affinity solute.
 Flow of mobile phase through the column
preferentially carries off the lower-affinity
solute and thus at high concentration the
higher-affinity solute will eventually displace
all molecules with lesser affinities.
Mode of operation:
a. Loading –
 At the beginning of the run, a mixture of solutes to
be separated is applied to the column, under
conditions selected to promote high retention.
 The higher-affinity solutes are preferentially
retained near the head of the column, with the
lower-affinity solutes moving farther downstream.
 The fastest moving component begins to form a
pure zone downstream.
 The other components also begin to form zones,
but the continued supply of the mixed feed at
head of the column prevents full resolution.
Displacement -
 After the entire sample is loaded, the feed is switched to
the displacer, chosen to have higher affinity than any
sample component.
 The displacer forms a sharp-edged zone at the head of
the column, pushing the other components downstream.
 Each sample component now acts as a displacer for the
lower-affinity solutes, and the solutes sort themselves
out into a series of contiguous bands (a "displacement
train"), all moving downstream at the rate set by the
displacer.
 The size and loading of the column are chosen to let this
sorting process reach completion before the components
reach the bottom of the column.
 The solutes appear at the bottom of the column as a
series of contiguous zones, each consisting of one
purified component, with the concentration within each
individual zone effectively uniform.
Regeneration –
 After the last solute has been eluted, it is necessary to
strip the displacer from the column.
 Since the displacer was chosen for high affinity, this can
pose a challenge.
 On reverse-phase materials, a wash with a high
percentage of organic solvent may suffice.
 Large pH shifts are also often employed.
 One effective strategy is to remove the displacer by
chemical reaction; for instance if hydrogen ion was used
as displacer it can be removed by reaction with
hydroxide, or a polyvalent metal ion can be removed by
reaction with a chelating agent.
 For some matrices, reactive groups on the stationary
phase can be titrated to temporarily eliminate the
binding sites, for instance weak-acid ion exchangers or
chelating resins can be converted to the protonated form.
 For gel-type ion exchangers, selectivity
reversal at very high ionic strength can also
provide a solution.
 Sometimes the displacer is specifically
designed with a titratable functional group
to shift its affinity.
 After the displacer is washed out, the
column is washed as needed to restore it to
its initial state for the next run.
Applications –
Historically, displacement chromatography was
applied to preparative separations of amino acids
and rare earth elements and has also been
investigated for isotope separation.
Proteins
 The chromatographic purification of proteins from
complex mixtures can be quite challenging, particularly
when the mixtures contain similarly retained proteins or
when it is desired to enrich trace components in the feed.
 Further, column loading is often limited when high
resolutions are required using traditional modes of
chromatography (e.g. linear gradient, isocratic
chromatography).
 In these cases, displacement chromatography is an efficient
technique for the purification of proteins from complex
mixtures at high column loadings in a variety of
applications.
 An important advance in the state of the art of
displacement chromatography was the development of
low molecular mass displacers for protein purification in
ion exchange systems.
 This research was significant in that it represented a
major departure from the conventional wisdom that
large polyelectrolyte polymers are required to displace
proteins in ion exchange systems.
 Low molecular mass displacers have significant
operational advantages as compared to large
polyelectrolyte displacers.
 For example, if there is any overlap between the displacer
and the protein of interest, these low molecular mass
materials can be readily separated from the purified
protein during post-displacement processing using
standard size-based purification methods (e.g. size
exclusion chromatography, ultrafiltration).
 In addition, the salt-dependent adsorption behavior
of these low MW displacers greatly facilitates
column regeneration.
 These displacers have been employed for a wide
variety of high resolution separations in ion
exchange systems. In addition, the utility of
displacement chromatography for the purification of
recombinant growth factors, antigenic vaccine
proteins and antisense oligonucleotides has also
been demonstrated.
 There are several examples in which displacement
chromatography has been applied to the purification
of proteins using ion exchange, hydrophobic
interaction, as well as reversed-phase
chromatography.
 Displacement chromatography is well suited for
obtaining mg quantities of purified proteins
from complex mixtures using standard analytical
chromatography columns at the bench scale.
 It is also particularly well suited for enriching
trace components in the feed.
 Displacement chromatography can be readily
carried out using a variety of resin systems
including, ion exchange, HIC and RPLC
Two-dimensional chromatography
 Two-dimensional chromatography represents the most
thorough and rigorous approach to evaluation of the
proteome.
 While previously accepted approaches have utilized
elution mode chromatographic approaches such as cation
exchange to reversed phase HPLC, yields are typically very
low requiring analytical sensitivities in the picomolar to
femtomolar range.
 As displacement chromatography offers the advantage of
concentration of trace components, two dimensional
chromatography utilizing displacement rather than
elution mode in the upstream chromatography step
represents a potentially powerful tool for analysis of trace
components, modifications, and identification of minor
expressed components of the proteome.
Introduction
 Gas chromatography - specifically gas-liquid
chromatography - involves a sample being
vapourised and injected onto the head of the
chromatographic column. The sample is
transported through the column by the flow of
inert, gaseous mobile phase. The column itself
contains a liquid stationary phase which is
adsorbed onto the surface of an inert solid.
 Have a look at this schematic diagram of a gas
chromatograph:
Instrumental components
Carrier gas :
 The carrier gas must be chemically inert.
Commonly used gases include nitrogen,
helium, argon, and carbon dioxide.
 The choice of carrier gas is often dependant
upon the type of detector which is used.
 The carrier gas system also contains a
molecular sieve to remove water and other
impurities.
Sample injection port:
 For optimum column efficiency, the sample should
not be too large, and should be introduced onto the
column as a "plug" of vapour - slow injection of large
samples causes band broadening and loss of
resolution.
 The most common injection method is where a
microsyringe is used to inject sample through a
rubber septum into a flash vapouriser port at the
head of the column.
 The temperature of the sample port is usually about
50°C higher than the boiling point of the least
volatile component of the sample.
 For packed columns, sample size ranges from tenths
of a microliter up to 20 microliters.
 Capillary columns, on the other hand, need much
less sample, typically around 10-3 mL.
 For capillary GC, split/splitless injection is used.
 Have a look at this diagram of a split/splitless
injector:
 The injector can be used in one of two modes; split
or splitless.
 The injector contains a heated chamber containing
a glass liner into which the sample is injected
through the septum.
 The carrier gas enters the chamber and can leave
by three routes (when the injector is in split
mode).
 The sample vapourises to form a mixture of carrier
gas, vapourised solvent and vapourised solutes.
 A proportion of this mixture passes onto the
column, but most exits through the split outlet.
 The septum purge outlet prevents septum bleed
components from entering the column.
Columns:
 There are two general types of column, packed and
capillary (also known as open tubular).
 Packed columns contain a finely divided, inert,
solid support material (commonly based on
diatomaceous earth) coated with liquid stationary
phase.
 Most packed columns are 1.5 - 10m in length and
have an internal diameter of 2 - 4mm.
 Capillary columns have an internal diameter of a
few tenths of a millimeter.
 They can be one of two types; wall-coated open
tubular (WCOT) or support-coated open tubular
(SCOT).
 Wall-coated columns consist of a capillary tube
whose walls are coated with liquid stationary
phase.
 In support-coated columns, the inner wall of the
capillary is lined with a thin layer of support
material such as diatomaceous earth, onto which
the stationary phase has been adsorbed.
 SCOT columns are generally less efficient than
WCOT columns.
 Both types of capillary column are more efficient
than packed columns.
 In 1979, a new type of WCOT column was devised - the
Fused Silica Open Tubular (FSOT) column;
 These have much thinner walls than the glass capillary
columns, and are given strength by the polyimide coating.
 These columns are flexible and can be wound into coils.
 They have the advantages of physical strength, flexibility
and low reactivity.
Column temperature
 For precise work, column temperature must be controlled
to within tenths of a degree.
 The optimum column temperature is dependant upon the
boiling point of the sample.
 As a rule of thumb, a temperature slightly above the
average boiling point of the sample results in an elution
time of 2 - 30 minutes.
 Minimal temperatures give good resolution, but increase
elution times.
 If a sample has a wide boiling range,
then temperature programming can be
useful.
 The column temperature is increased
(either continuously or in steps) as
separation proceeds.
Detectors:
 There are many detectors which can be used in gas
chromatography.
 Different detectors will give different types of
selectivity.
 A non-selective detector responds to all compounds
except the carrier gas, a selective detector responds
to a range of compounds with a common physical or
chemical property and a specific detector responds
to a single chemical compound.
 Detectors can also be grouped into concentration
dependant detectors and mass flow dependant
detectors.
 The signal from a concentration dependant
detector is related to the concentration of solute in
the detector, and does not usually destroy the
sample Dilution of with make-up gas will lower the
detectors response.
 Mass flow dependant detectors usually destroy the
sample, and the signal is related to the rate at
which solute molecules enter the detector.
 The response of a mass flow dependant detector is
unaffected by make-up gas.
 Have a look at this tabular summary of common
GC detectors:
Detector Type Support gases Selectivity Detectability
Dynamic
range
Flame
ionization
(FID)
Mass flow
Hydrogen and
air
Most organic
cpds.
100 pg 107
Thermal
conductivity
(TCD)
Concentration Reference Universal 1 ng 107
Electron
capture (ECD)
Concentration Make-up
Halides,
nitrates,
nitriles,
peroxides,
anhydrides,
organometallic
s
50 fg 105
Nitrogen-
phosphorus
Mass flow
Hydrogen and
air
Nitrogen,
phosphorus
10 pg 106
Hall
electrolytic
conductivity
Mass flow
Hydrogen,
oxygen
Halide,
nitrogen,
nitrosamine,
sulphur
Detector Type Support gases Selectivity Detectability
Dynamic
range
Flame
photometric
(FPD)
Mass flow
Hydrogen and
air possibly
oxygen
Sulphur,
phosphorus,
tin, boron,
arsenic,
germanium,
selenium,
chromium
100 pg 103
Photo-
ionization
(PID)
Concentration Make-up
Aliphatics,
aromatics,
ketones, esters,
aldehydes,
amines,
heterocyclics,
organosulphur
s, some
organometallic
s
2 pg 107
 The effluent from the column is mixed with hydrogen and
air, and ignited.
 Organic compounds burning in the flame produce ions
and electrons which can conduct electricity through the
flame.
 A large electrical potential is applied at the burner tip, and
a collector electrode is located above the flame.
 The current resulting from the pyrolysis of any organic
compounds is measured.
 FIDs are mass sensitive rather than concentration sensitive;
this gives the advantage that changes in mobile phase flow
rate do not affect the detector's response.
 The FID is a useful general detector for the analysis of
organic compounds; it has high sensitivity, a large linear
response range, and low noise.
 It is also robust and easy to use, but unfortunately, it
destroys the sample.
THANK YOU

Chromatography

  • 1.
    Mr. Abhirup Ganguli AssistantProfessor Dept. of Biotechnology Swami Vivekananda Institute of Modern Science
  • 2.
     Chromatography isa laboratory technique for the separation of a mixture.  The mixture is dissolved in a fluid called the mobile phase, which carries it through a structure holding another material called the stationary phase.  The various constituents of the mixture travel at different speeds, causing them to separate.  The separation is based on differential partitioning between the mobile and stationary phases.  Subtle differences in a compound's partition coefficient result in differential retention on the stationary phase and thus affect the separation.
  • 3.
     Chromatography maybe preparative or analytical.  The purpose of preparative chromatography is to separate the components of a mixture for later use, and is thus a form of purification.  Analytical chromatography is done normally with smaller amounts of material and is for establishing the presence or measuring the relative proportions of analytes in a mixture.  The two are not mutually exclusive.  Chromatography is derived from Greek: chroma, which means "color", and graphein, which means "to write"
  • 4.
     It isan analytical technique for separating and identifying mixtures that are or can be coloured, especially pigments.  This can also be used in secondary or primary schools in ink experiments.  This method has been largely replaced by thin layer chromatography; however it is still a powerful teaching tool.  Two-way paper chromatography, also called two- dimensional chromatography, involves using two solvents and rotating the paper 90° in between.  This is useful for separating complex mixtures of similar compounds, for example, amino acids.
  • 5.
     A small,ideally concentrated spot of solution that contains the sample is applied to a strip of chromatography paper about 1 cm from the base, usually using a capillary tube for maximum precision.  This sample is absorbed onto the paper and may form interactions with it.  Any substance that reacts or bonds with the paper cannot be measured using -Solvent front technique.  The paper is then dipped into a suitable solvent, such as ethanol or water, taking care that the spot is above the surface of the solvent, and placed in a sealed container.  The solvent moves up the paper by capillary action, which occurs as a result of the attraction of the solvent molecules to the paper and to one another.
  • 6.
     As thesolvent rises through the paper it meets and dissolves the sample mixture, which will then travel up the paper with the solvent.  Different compounds in the sample mixture travel at different rates due to differences in solubility in the solvent, and due to differences in their attraction to the fibers in the paper.  Paper chromatography takes anywhere from several minutes to several hours.  In some cases, paper chromatography does not separate pigments completely; this occurs when two substances appear to have the same values in a particular solvent.  In these cases, two-way chromatography is used to separate the multiple-pigment spots.
  • 7.
     The chromatogramis turned by ninety degrees, and placed in a different solvent in the same way as before; some spots separate in the presence of more than one pigment.  As before, the value is calculated, and the two pigments are identified.  The Rf value (retention factor) is the distance travelled by a particular component from the origin (where the sample was originally spotted) as a ratio to the distance travelled by the solvent front from the origin.  Rf values for each substance will be unique, and can be used to identify components.  A particular component will have the same Rf value if it is separated under identical conditions.
  • 8.
     After development,the spots corresponding to different compounds may be located by their colour, ultraviolet light, ninhydrin (Triketohydrindane hydrate) or by treatment with iodine vapours.  The final chromatogram can be compared with other known mixture chromatograms to identify sample mixture using the Rn value.  As in most other forms of chromatography, paper chromatography uses Rn values to help identify compounds.  Rf values are calculated by dividing the distance the pigment travels up the paper by the distance the solvent travels (the solvent front).  Because Rf values are standard for a given compound, known Rn values can be used to aid in the identification of an unknown substance in an experiment.
  • 10.
     Displacement chromatographyis a chromatography technique in which a sample is placed onto the head of the column and is then displaced by a solute that is more strongly sorbed than the components of the original mixture.  The result is that the components are resolved into consecutive “rectangular” zones of highly concentrated pure substances rather than solvent- separated “peaks”.  It is primarily a preparative technique; higher product concentration, higher purity, and increased throughput may be obtained compared to other modes of chromatography.
  • 11.
    Discovery:  The adventof displacement chromatography can be attributed to Arne Tiselius, who in 1943 first classified the modes of chromatography as frontal, elution, and displacement.  Displacement chromatography found a variety of applications including isolation of transuranic elements and biochemical entities.  The technique was redeveloped by Csaba Horváth, who employed modern high-pressure columns and equipment.  It has since found many applications, particularly in the realm of biological macromolecule purification.
  • 12.
    Principle:  The basicprinciple of displacement chromatography is: there are only a finite number of binding sites for solutes on the matrix (the stationary phase), and if a site is occupied by one molecule, it is unavailable to others.  As in any chromatography, equilibrium is established between molecules of a given kind bound to the matrix and those of the same kind free in solution.  Because the number of binding sites is finite, when the concentration of molecules free in solution is large relative to the dissociation constant for the sites, those sites will mostly be filled.  This results in a downward-curvature in the plot of bound vs free solute, in the simplest case giving a Langmuir isotherm.
  • 13.
     A moleculewith a high affinity for the matrix (the displacer) will compete more effectively for binding sites, leaving the mobile phase enriched in the lower-affinity solute.  Flow of mobile phase through the column preferentially carries off the lower-affinity solute and thus at high concentration the higher-affinity solute will eventually displace all molecules with lesser affinities.
  • 14.
    Mode of operation: a.Loading –  At the beginning of the run, a mixture of solutes to be separated is applied to the column, under conditions selected to promote high retention.  The higher-affinity solutes are preferentially retained near the head of the column, with the lower-affinity solutes moving farther downstream.  The fastest moving component begins to form a pure zone downstream.  The other components also begin to form zones, but the continued supply of the mixed feed at head of the column prevents full resolution.
  • 15.
    Displacement -  Afterthe entire sample is loaded, the feed is switched to the displacer, chosen to have higher affinity than any sample component.  The displacer forms a sharp-edged zone at the head of the column, pushing the other components downstream.  Each sample component now acts as a displacer for the lower-affinity solutes, and the solutes sort themselves out into a series of contiguous bands (a "displacement train"), all moving downstream at the rate set by the displacer.  The size and loading of the column are chosen to let this sorting process reach completion before the components reach the bottom of the column.  The solutes appear at the bottom of the column as a series of contiguous zones, each consisting of one purified component, with the concentration within each individual zone effectively uniform.
  • 16.
    Regeneration –  Afterthe last solute has been eluted, it is necessary to strip the displacer from the column.  Since the displacer was chosen for high affinity, this can pose a challenge.  On reverse-phase materials, a wash with a high percentage of organic solvent may suffice.  Large pH shifts are also often employed.  One effective strategy is to remove the displacer by chemical reaction; for instance if hydrogen ion was used as displacer it can be removed by reaction with hydroxide, or a polyvalent metal ion can be removed by reaction with a chelating agent.  For some matrices, reactive groups on the stationary phase can be titrated to temporarily eliminate the binding sites, for instance weak-acid ion exchangers or chelating resins can be converted to the protonated form.
  • 17.
     For gel-typeion exchangers, selectivity reversal at very high ionic strength can also provide a solution.  Sometimes the displacer is specifically designed with a titratable functional group to shift its affinity.  After the displacer is washed out, the column is washed as needed to restore it to its initial state for the next run.
  • 18.
    Applications – Historically, displacementchromatography was applied to preparative separations of amino acids and rare earth elements and has also been investigated for isotope separation. Proteins  The chromatographic purification of proteins from complex mixtures can be quite challenging, particularly when the mixtures contain similarly retained proteins or when it is desired to enrich trace components in the feed.  Further, column loading is often limited when high resolutions are required using traditional modes of chromatography (e.g. linear gradient, isocratic chromatography).  In these cases, displacement chromatography is an efficient technique for the purification of proteins from complex mixtures at high column loadings in a variety of applications.
  • 19.
     An importantadvance in the state of the art of displacement chromatography was the development of low molecular mass displacers for protein purification in ion exchange systems.  This research was significant in that it represented a major departure from the conventional wisdom that large polyelectrolyte polymers are required to displace proteins in ion exchange systems.  Low molecular mass displacers have significant operational advantages as compared to large polyelectrolyte displacers.  For example, if there is any overlap between the displacer and the protein of interest, these low molecular mass materials can be readily separated from the purified protein during post-displacement processing using standard size-based purification methods (e.g. size exclusion chromatography, ultrafiltration).
  • 20.
     In addition,the salt-dependent adsorption behavior of these low MW displacers greatly facilitates column regeneration.  These displacers have been employed for a wide variety of high resolution separations in ion exchange systems. In addition, the utility of displacement chromatography for the purification of recombinant growth factors, antigenic vaccine proteins and antisense oligonucleotides has also been demonstrated.  There are several examples in which displacement chromatography has been applied to the purification of proteins using ion exchange, hydrophobic interaction, as well as reversed-phase chromatography.
  • 21.
     Displacement chromatographyis well suited for obtaining mg quantities of purified proteins from complex mixtures using standard analytical chromatography columns at the bench scale.  It is also particularly well suited for enriching trace components in the feed.  Displacement chromatography can be readily carried out using a variety of resin systems including, ion exchange, HIC and RPLC
  • 22.
    Two-dimensional chromatography  Two-dimensionalchromatography represents the most thorough and rigorous approach to evaluation of the proteome.  While previously accepted approaches have utilized elution mode chromatographic approaches such as cation exchange to reversed phase HPLC, yields are typically very low requiring analytical sensitivities in the picomolar to femtomolar range.  As displacement chromatography offers the advantage of concentration of trace components, two dimensional chromatography utilizing displacement rather than elution mode in the upstream chromatography step represents a potentially powerful tool for analysis of trace components, modifications, and identification of minor expressed components of the proteome.
  • 23.
    Introduction  Gas chromatography- specifically gas-liquid chromatography - involves a sample being vapourised and injected onto the head of the chromatographic column. The sample is transported through the column by the flow of inert, gaseous mobile phase. The column itself contains a liquid stationary phase which is adsorbed onto the surface of an inert solid.  Have a look at this schematic diagram of a gas chromatograph:
  • 26.
    Instrumental components Carrier gas:  The carrier gas must be chemically inert. Commonly used gases include nitrogen, helium, argon, and carbon dioxide.  The choice of carrier gas is often dependant upon the type of detector which is used.  The carrier gas system also contains a molecular sieve to remove water and other impurities.
  • 27.
    Sample injection port: For optimum column efficiency, the sample should not be too large, and should be introduced onto the column as a "plug" of vapour - slow injection of large samples causes band broadening and loss of resolution.  The most common injection method is where a microsyringe is used to inject sample through a rubber septum into a flash vapouriser port at the head of the column.  The temperature of the sample port is usually about 50°C higher than the boiling point of the least volatile component of the sample.  For packed columns, sample size ranges from tenths of a microliter up to 20 microliters.
  • 28.
     Capillary columns,on the other hand, need much less sample, typically around 10-3 mL.  For capillary GC, split/splitless injection is used.  Have a look at this diagram of a split/splitless injector:
  • 29.
     The injectorcan be used in one of two modes; split or splitless.  The injector contains a heated chamber containing a glass liner into which the sample is injected through the septum.  The carrier gas enters the chamber and can leave by three routes (when the injector is in split mode).  The sample vapourises to form a mixture of carrier gas, vapourised solvent and vapourised solutes.  A proportion of this mixture passes onto the column, but most exits through the split outlet.  The septum purge outlet prevents septum bleed components from entering the column.
  • 30.
    Columns:  There aretwo general types of column, packed and capillary (also known as open tubular).  Packed columns contain a finely divided, inert, solid support material (commonly based on diatomaceous earth) coated with liquid stationary phase.  Most packed columns are 1.5 - 10m in length and have an internal diameter of 2 - 4mm.  Capillary columns have an internal diameter of a few tenths of a millimeter.  They can be one of two types; wall-coated open tubular (WCOT) or support-coated open tubular (SCOT).  Wall-coated columns consist of a capillary tube whose walls are coated with liquid stationary phase.
  • 31.
     In support-coatedcolumns, the inner wall of the capillary is lined with a thin layer of support material such as diatomaceous earth, onto which the stationary phase has been adsorbed.  SCOT columns are generally less efficient than WCOT columns.  Both types of capillary column are more efficient than packed columns.  In 1979, a new type of WCOT column was devised - the Fused Silica Open Tubular (FSOT) column;
  • 32.
     These havemuch thinner walls than the glass capillary columns, and are given strength by the polyimide coating.  These columns are flexible and can be wound into coils.  They have the advantages of physical strength, flexibility and low reactivity. Column temperature  For precise work, column temperature must be controlled to within tenths of a degree.  The optimum column temperature is dependant upon the boiling point of the sample.  As a rule of thumb, a temperature slightly above the average boiling point of the sample results in an elution time of 2 - 30 minutes.  Minimal temperatures give good resolution, but increase elution times.
  • 33.
     If asample has a wide boiling range, then temperature programming can be useful.  The column temperature is increased (either continuously or in steps) as separation proceeds.
  • 34.
    Detectors:  There aremany detectors which can be used in gas chromatography.  Different detectors will give different types of selectivity.  A non-selective detector responds to all compounds except the carrier gas, a selective detector responds to a range of compounds with a common physical or chemical property and a specific detector responds to a single chemical compound.  Detectors can also be grouped into concentration dependant detectors and mass flow dependant detectors.
  • 35.
     The signalfrom a concentration dependant detector is related to the concentration of solute in the detector, and does not usually destroy the sample Dilution of with make-up gas will lower the detectors response.  Mass flow dependant detectors usually destroy the sample, and the signal is related to the rate at which solute molecules enter the detector.  The response of a mass flow dependant detector is unaffected by make-up gas.  Have a look at this tabular summary of common GC detectors:
  • 36.
    Detector Type Supportgases Selectivity Detectability Dynamic range Flame ionization (FID) Mass flow Hydrogen and air Most organic cpds. 100 pg 107 Thermal conductivity (TCD) Concentration Reference Universal 1 ng 107 Electron capture (ECD) Concentration Make-up Halides, nitrates, nitriles, peroxides, anhydrides, organometallic s 50 fg 105 Nitrogen- phosphorus Mass flow Hydrogen and air Nitrogen, phosphorus 10 pg 106 Hall electrolytic conductivity Mass flow Hydrogen, oxygen Halide, nitrogen, nitrosamine, sulphur
  • 37.
    Detector Type Supportgases Selectivity Detectability Dynamic range Flame photometric (FPD) Mass flow Hydrogen and air possibly oxygen Sulphur, phosphorus, tin, boron, arsenic, germanium, selenium, chromium 100 pg 103 Photo- ionization (PID) Concentration Make-up Aliphatics, aromatics, ketones, esters, aldehydes, amines, heterocyclics, organosulphur s, some organometallic s 2 pg 107
  • 39.
     The effluentfrom the column is mixed with hydrogen and air, and ignited.  Organic compounds burning in the flame produce ions and electrons which can conduct electricity through the flame.  A large electrical potential is applied at the burner tip, and a collector electrode is located above the flame.  The current resulting from the pyrolysis of any organic compounds is measured.  FIDs are mass sensitive rather than concentration sensitive; this gives the advantage that changes in mobile phase flow rate do not affect the detector's response.  The FID is a useful general detector for the analysis of organic compounds; it has high sensitivity, a large linear response range, and low noise.  It is also robust and easy to use, but unfortunately, it destroys the sample.
  • 40.