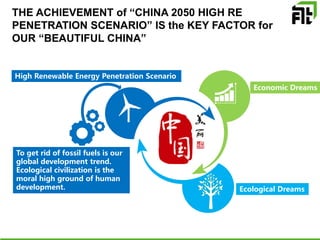
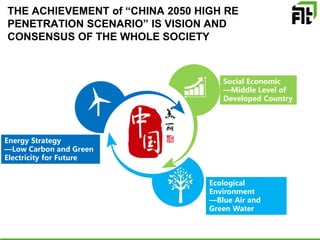
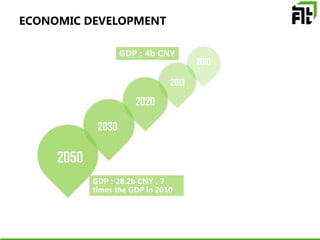
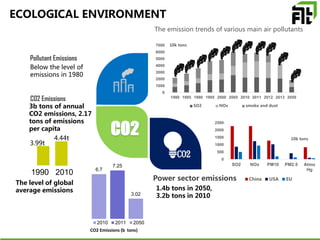
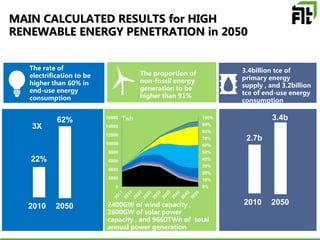
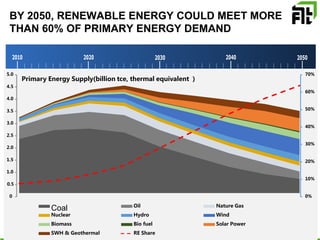
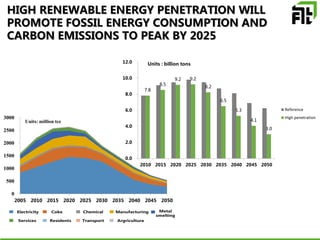
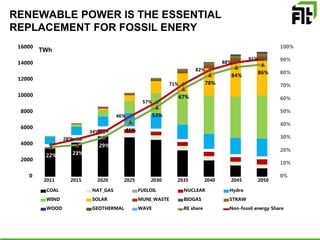
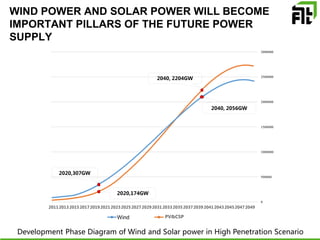
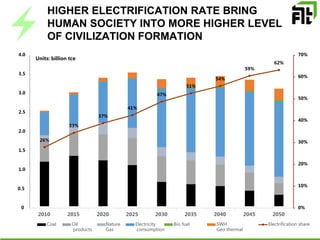
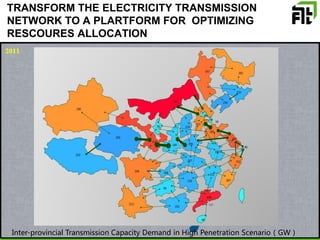
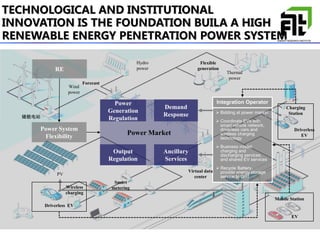
国家发展和改革委员会能源研究所
Energy Research Institute National Development and Reform Commission
CHINA 2050 HIGH RENEWABLE
ENERGY PENETRATION SCENARIO
AND RODAMAP STUDY
CHINA NATIONAL RENEWABLE ENERGY CENTER
ENERGY RESEARCH INSTITUTE OF NDRC
April 20, 2015
Partnership
Core Working Group:
Technical Support:
High Renewable Energy Penetration Scenario
Economic Dreams
Ecological Dreams
生态文明是人类文明的重要标志
To get rid of fossil fuels is our
global development trend.
Ecological civilization is the
moral high ground of human
development.
THE ACHIEVEMENT of “CHINA 2050 HIGH RE
PENETRATION SCENARIO” IS the KEY FACTOR for
OUR “BEAUTIFUL CHINA”
THE ACHIEVEMENT of “CHINA 2050 HIGH RE
PENETRATION SCENARIO” IS VISION AND
CONSENSUS OF THE WHOLE SOCIETY
Energy Strategy
—Low Carbon and Green
Electricity for Future
Social Economic
—Middle Level of
Developed Country
Ecological
Environment
—Blue Air and
Green Water
ECONOMIC DEVELOPMENT
GDP:4b CNY
GDP:28.2b CNY,7
times the GDP in 2010
2010
2013
2020
2030
2050
ECOLOGICAL ENVIRONMENT
CO2 Emissions (b tons)
6.7
7.25
3.02
2010 2011 2050
20101990
3.99t
4.44t
0
500
1000
1500
2000
2500
SO2 NOx PM10 PM2.5 Atmo
Hg
China USA EU
0
1000
2000
3000
4000
5000
6000
7000
1980 1985 1990 1995 2000 2005 2010 2011 2012 2013 2050
The emission trends of various main air pollutants
SO2
10k tons
NOx smoke and dust
10k tons
Below the level of
emissions in 1980
Pollutant Emissions
3b tons of annual
CO2 emissions, 2.17
tons of emissions
per capita
CO2 Emissions
The level of global
average emissions 1.4b tons in 2050,
3.2b tons in 2010
Power sector emissions
MAIN CALCULATED RESULTS for HIGH
RENEWABLE ENERGY PENETRATION in 2050
The rate of
electrification to be
higher than 60% in
end-use energy
consumption
The proportion of
non-fossil energy
generation to be
higher than 91%
3.4billion tce of
primary energy
supply , and 3.2billion
tce of end-use energy
consumption
3X
22%
62%
2010 2050
0%
10%
20%
30%
40%
50%
60%
70%
80%
90%
100%
0
2000
4000
6000
8000
10000
12000
14000
16000 Twh
2400GW of wind capacity ,
2600GW of solar power
capacity , and 9660TWh of total
annual power generation
2010 2050
2.7b
3.4b
HIGH RENEWABLE ENERGY PENETRATION
SCENARIO: PARTHWAY
TEN CONLUSIONS OR
TEN THINKS?
0%
10%
20%
30%
40%
50%
60%
70%
0
0.5
1.0
1.5
2.0
2.5
3.0
3.5
4.0
4.5
5.0
Coal Oil Nature Gas
Nuclear Hydro Wind
Biomass Bio fuel Solar Power
SWH & Geothermal RE Share
Primary Energy Supply(billion tce, thermal equivalent )
BY 2050, RENEWABLE ENERGY COULD MEET MORE
THAN 60% OF PRIMARY ENERGY DEMAND
2010 2020 2030 2040 2050
HIGH RENEWABLE ENERGY PENETRATION WILL
PROMOTE FOSSIL ENERGY CONSUMPTION AND
CARBON EMISSIONS TO PEAK BY 2025
0
500
1000
1500
2000
2500
3000
2005 2010 2015 2020 2025 2030 2035 2040 2045 2050
Units: million tce
7.8
8.5
9.2 9.2
8.2
6.5
5.3
4.1
3.0
0.0
2.0
4.0
6.0
8.0
10.0
12.0
2010 2015 2020 2025 2030 2035 2040 2045 2050
Reference
High penetration
Units : billion tons
Metal
smelting
Services Residents Transport Argriculture
Electricity Chemical ManufacturingCoke
RENEWABLE POWER IS THE ESSENTIAL
REPLACEMENT FOR FOSSIL ENERY
22% 23%
29%
41%
53%
67%
78%
84%
86%
28%
34%
46%
57%
71%
82%
88%
91%
TWh
0%
10%
20%
30%
40%
50%
60%
70%
80%
90%
100%
0
2000
4000
6000
8000
10000
12000
14000
16000
2011 2015 2020 2025 2030 2035 2040 2045 2050
COAL NAT_GAS FUELOIL NUCLEAR Hydro
WIND SOLAR MUNI_WASTE BIOGAS STRAW
WOOD GEOTHERMAL WAVE RE share Non-fossil energy Share
WIND POWER AND SOLAR POWER WILL BECOME
IMPORTANT PILLARS OF THE FUTURE POWER
SUPPLY
Development Phase Diagram of Wind and Solar power in High Penetration Scenario
0
500000
1000000
1500000
2000000
2500000
3000000
20112013201520172019202120232025202720292031203320352037203920412043204520472049
Wind PV&CSP
2020,307GW
2020,174GW
2040, 2204GW
2040, 2056GW
HIGHER ELECTRIFICATION RATE BRING
HUMAN SOCIETY INTO MORE HIGHER LEVEL
OF CIVILIZATION FORMATION
26%
33%
37%
41%
47%
51%
54%
59%
62%
0%
10%
20%
30%
40%
50%
60%
70%
0
0.5
1.0
1.5
2.0
2.5
3.0
3.5
4.0
2010 2015 2020 2025 2030 2035 2040 2045 2050
Coal Oil
products
Nature
Gas
Electricity
consumption
Bio fuel SWH
Geo thermal
Electrification share
Units: billion tce
TRANSFORM THE ELECTRICITY TRANSMISSION
NETWORK TO A PLARTFORM FOR OPTIMIZING
RESCOURES ALLOCATION
Inter-provincial Transmission Capacity Demand in High Penetration Scenario(GW)
国家发展和改革委员会能源研究所
Energy Research Institute National Development and Reform Commission
TECHNOLOGICAL AND INSTITUTIONAL
INNOVATION IS THE FOUNDATION BUILA A HIGH
RENEWABLE ENERGY PENETRATION POWER SYSTEM
RE Thermal
power
Hydro
power
Wind
power
PV
Power System
Flexibility
Wireless
charging
储能电站
Forecast
Flexible
generation
Driverless
EV
EV
Driverless EV
Charging
Station
Mobile Station
 Bidding at power market
 Coordinate EVs with
smart vehicle network,
driverless cars and
wireless charging
technology
 Business model:
charging and
discharging services,
and shared EV services
 Recycle Battery,
provide energy storage
service to Grid
Integration Operator
Demand
Response
Ancillary
Services
Power
Generation
Regulation
Output
Regulation
Smart
metering
Virtual data
center
Power Market
BUILDING A HIGH RENEWABLE ENERGY
PENETRATION POWER SYSTEM AT A SMALL OR
NON-INCREMENTAL COST
kWh Cost Development Trend in High Penetration Scenario
2011 2015 2020 2025 2030 2035 2040 2045 2050
Transmission Cost 0.180 0.182 0.183 0.185 0.190 0.199 0.213 0.230 0.250
Start-up costs 0.000 0.001 0.001 0.001 0.002 0.003 0.005 0.005 0.005
Fuel Cost 0.276 0.259 0.262 0.233 0.186 0.143 0.111 0.094 0.080
Variable O&M 0.022 0.021 0.019 0.016 0.014 0.011 0.010 0.010 0.010
Fixed O&M 0.023 0.028 0.029 0.035 0.040 0.044 0.050 0.053 0.054
Capital Cost 0.244 0.212 0.196 0.212 0.240 0.266 0.285 0.285 0.287
0.746
0.701 0.689 0.683 0.672 0.666 0.674 0.678 0.685
0.000
0.100
0.200
0.300
0.400
0.500
0.600
0.700
0.800
Yuan/KWh
AS A NEW ECONOMIC GROWTH POINT, RE CAN
SIGNIFICANTLY IMPROVE DEVELOPMENT QUALITY
OF OVERALL ECONOMY
Contribution of RE and
related industries to GDP
2.5%
1.6%
2.9%
0.9%
6.2%
0.0%
1.0%
2.0%
3.0%
4.0%
5.0%
6.0%
7.0%
2010 2020 2030 2050
Growth of Employment in RE
and related industries (unit: 10000)
Wind Solar EV Other RE
125
65
46
15 13
481
377
81
36
250
0
100
200
300
400
500
600
Solar Wind Hydro Biomass Others
2015
2050
0
1000
2000
3000
4000
5000
6000
7000
8000
Energy Sector Employment in 2010
(unit: 1000)
Coal Oil Gas Electricity RE Nuclear R&D
HIGH RENEWABLE ENERGY PENETRATION
WILL HELP BRING BACK CLEAR WATER AND
BLUE SKIES
2050 China's SO2 and NOX Emission in High Penetration Scenario
0%
5%
10%
15%
20%
25%
30%
35%
0.00
1.00
2.00
3.00
4.00
5.00
6.00
7.00
8.00
9.00
10.00
1990 1995 2000 2005 2010 2015 2020 2025 2030 2035 2040 2045 2050
China USA EU China Share of Global
Units: billion tons
0.0
5.0
10.0
15.0
20.0
25.0
30.0
1990 2000 2005 2009 2010 2011 2012 2015 2020 2025 2030 2035 2040 2045 2050
China SO2 Emission High Penetration Scenario
China Nox Emission High Penetration Scenario
Units: million tons
2050 China's CO2 Emission in the Global Contrast in High Penetration Scenario
Note: China's data after 2010 is scenario data
And data of other countries is trend prediction
Data from IEA ETP 2014
2050 HIGH PENETRATION SCENARIO:
PATHWAY
Largest Challenge:
Variability of
Renewables!
Achieve Higher-level Dynamic Stability
Through Changes: Internet +
Intelligence
Comm
Internet
Energy
Internet
Internet of
Things
Flexibility
Supply Side
Changes
Demand
Side
Also
Changes
Stability?
Reliability
?
System with High RE Penetration Will Be a
Reliable Power System
Variable demand Variable generation
Smart Control and real-
time price
Demand side flexibility
Flexible generation units
Contribution of EV’s Flexibility to the Power System
Vehicle
Technology
Charging Mode Operation Features
EV Charging and Discharging Load
EV
Plug-in
Fuel Battery
Low Voltage AC
DC
Changeable Battery
Frequency of Charging
Miles
TimeWireless Charging
Types and Numbers
Passenger V
Bus/Business/Delivery
Trucks
Daily miles Integration Charging Load Curves Charging control and
Storage
New Business model of EV Will Change the
Concept of Power Dispatch
退役电池
回收
EV Integration
Operator
Mobile
Stations
Fixed
Stations
流动站点
Wireless
Charging
EV Business Model and Integrated Operation of Power System
Wireless
Charging
Energy Storage of EV
Case Study for 2030 in Beijing
880GW Flexible Coal Will Provide Support
for Stable and Reliable Operation of the
Power System in 2050
Hourly Dispatch on a Typical Day in High Penetration
Scenario
0
500,000
1,000,000
1,500,000
2,000,000
2,500,000
T001 T002 T003 T004 T005 T006 T007 T008 T009 T010 T011 T012 T013 T014 T015 T016 T017 T018 T019 T020 T021 T022 T023 T024
NUCLEAR COAL Hydro NAT_GAS WIND
WOOD SOLAR GEOTHERMAL BIOGAS STRAW
MUNI_WASTE HEAT WAVE FUELOIL PUMPED_HYDRO
ACTION PLAN FOR HIGH RENEWABLE ENERGY
PENETRATION
BUILDING HIGH RENEWABLE ENERGY
PENETRATION FUTURE WILL BRING “NON-
ZERO-SUM”RESULTS
• Market Oriented
• Economically Viable
• Consider both long term and near term
• Soft and Hard Supports
• Benefit the Whole Society
KEY ELEMENTS of THE ACTION PLANS
20202015 2030 2040 2050
Technology
Revolution
Extract potential of grid,
strengthen infrastructure of
provincial distribution network,
especially 500KV interconnection
lines for large wind and solar
bases
EV Industrialized,EV become
pillar of vehicle industry or even
of the national economy by 2025
Enter the era of Energy Internet by 2025: efficiently
integrate EV, smart network, and Demand Response;
annual installation of wind and solar power each hit
100GW
,Power Sector Reform ongoing in
parallel with 13th FYP implementation;
Building a competitive power market
in China within 10 years
Reform of State Owned Enterprises:
Improve Market Mechanism and
break monopoly
Energy transformation of Germany(Learn and Cooperate)、Denmark concepts to phase
out fossil energy
Global energy governance is a trend,and conformed with Pareto Standard. Only
cooperation will lead to win-win!
Technology Innovation: Significantly increase
electrification rate in end-use consumptions, flexible
coal(target: 1000 hours), modernized manufacture
and 3-Networks Integration
Institutional
Reform
International
Cooperation
Do not ever think about that we can escape, our every
each step determine the final outcome, our foot steps
are moving towards the end of own chosen target.
──Milan Kundera

China energy roadmap slides

  • 1.
    国家发展和改革委员会能源研究所 Energy Research InstituteNational Development and Reform Commission CHINA 2050 HIGH RENEWABLE ENERGY PENETRATION SCENARIO AND RODAMAP STUDY CHINA NATIONAL RENEWABLE ENERGY CENTER ENERGY RESEARCH INSTITUTE OF NDRC April 20, 2015
  • 3.
  • 4.
    High Renewable EnergyPenetration Scenario Economic Dreams Ecological Dreams 生态文明是人类文明的重要标志 To get rid of fossil fuels is our global development trend. Ecological civilization is the moral high ground of human development. THE ACHIEVEMENT of “CHINA 2050 HIGH RE PENETRATION SCENARIO” IS the KEY FACTOR for OUR “BEAUTIFUL CHINA”
  • 5.
    THE ACHIEVEMENT of“CHINA 2050 HIGH RE PENETRATION SCENARIO” IS VISION AND CONSENSUS OF THE WHOLE SOCIETY Energy Strategy —Low Carbon and Green Electricity for Future Social Economic —Middle Level of Developed Country Ecological Environment —Blue Air and Green Water
  • 6.
    ECONOMIC DEVELOPMENT GDP:4b CNY GDP:28.2bCNY,7 times the GDP in 2010 2010 2013 2020 2030 2050
  • 7.
    ECOLOGICAL ENVIRONMENT CO2 Emissions(b tons) 6.7 7.25 3.02 2010 2011 2050 20101990 3.99t 4.44t 0 500 1000 1500 2000 2500 SO2 NOx PM10 PM2.5 Atmo Hg China USA EU 0 1000 2000 3000 4000 5000 6000 7000 1980 1985 1990 1995 2000 2005 2010 2011 2012 2013 2050 The emission trends of various main air pollutants SO2 10k tons NOx smoke and dust 10k tons Below the level of emissions in 1980 Pollutant Emissions 3b tons of annual CO2 emissions, 2.17 tons of emissions per capita CO2 Emissions The level of global average emissions 1.4b tons in 2050, 3.2b tons in 2010 Power sector emissions
  • 8.
    MAIN CALCULATED RESULTSfor HIGH RENEWABLE ENERGY PENETRATION in 2050 The rate of electrification to be higher than 60% in end-use energy consumption The proportion of non-fossil energy generation to be higher than 91% 3.4billion tce of primary energy supply , and 3.2billion tce of end-use energy consumption 3X 22% 62% 2010 2050 0% 10% 20% 30% 40% 50% 60% 70% 80% 90% 100% 0 2000 4000 6000 8000 10000 12000 14000 16000 Twh 2400GW of wind capacity , 2600GW of solar power capacity , and 9660TWh of total annual power generation 2010 2050 2.7b 3.4b
  • 9.
    HIGH RENEWABLE ENERGYPENETRATION SCENARIO: PARTHWAY TEN CONLUSIONS OR TEN THINKS?
  • 10.
    0% 10% 20% 30% 40% 50% 60% 70% 0 0.5 1.0 1.5 2.0 2.5 3.0 3.5 4.0 4.5 5.0 Coal Oil NatureGas Nuclear Hydro Wind Biomass Bio fuel Solar Power SWH & Geothermal RE Share Primary Energy Supply(billion tce, thermal equivalent ) BY 2050, RENEWABLE ENERGY COULD MEET MORE THAN 60% OF PRIMARY ENERGY DEMAND 2010 2020 2030 2040 2050
  • 11.
    HIGH RENEWABLE ENERGYPENETRATION WILL PROMOTE FOSSIL ENERGY CONSUMPTION AND CARBON EMISSIONS TO PEAK BY 2025 0 500 1000 1500 2000 2500 3000 2005 2010 2015 2020 2025 2030 2035 2040 2045 2050 Units: million tce 7.8 8.5 9.2 9.2 8.2 6.5 5.3 4.1 3.0 0.0 2.0 4.0 6.0 8.0 10.0 12.0 2010 2015 2020 2025 2030 2035 2040 2045 2050 Reference High penetration Units : billion tons Metal smelting Services Residents Transport Argriculture Electricity Chemical ManufacturingCoke
  • 12.
    RENEWABLE POWER ISTHE ESSENTIAL REPLACEMENT FOR FOSSIL ENERY 22% 23% 29% 41% 53% 67% 78% 84% 86% 28% 34% 46% 57% 71% 82% 88% 91% TWh 0% 10% 20% 30% 40% 50% 60% 70% 80% 90% 100% 0 2000 4000 6000 8000 10000 12000 14000 16000 2011 2015 2020 2025 2030 2035 2040 2045 2050 COAL NAT_GAS FUELOIL NUCLEAR Hydro WIND SOLAR MUNI_WASTE BIOGAS STRAW WOOD GEOTHERMAL WAVE RE share Non-fossil energy Share
  • 13.
    WIND POWER ANDSOLAR POWER WILL BECOME IMPORTANT PILLARS OF THE FUTURE POWER SUPPLY Development Phase Diagram of Wind and Solar power in High Penetration Scenario 0 500000 1000000 1500000 2000000 2500000 3000000 20112013201520172019202120232025202720292031203320352037203920412043204520472049 Wind PV&CSP 2020,307GW 2020,174GW 2040, 2204GW 2040, 2056GW
  • 14.
    HIGHER ELECTRIFICATION RATEBRING HUMAN SOCIETY INTO MORE HIGHER LEVEL OF CIVILIZATION FORMATION 26% 33% 37% 41% 47% 51% 54% 59% 62% 0% 10% 20% 30% 40% 50% 60% 70% 0 0.5 1.0 1.5 2.0 2.5 3.0 3.5 4.0 2010 2015 2020 2025 2030 2035 2040 2045 2050 Coal Oil products Nature Gas Electricity consumption Bio fuel SWH Geo thermal Electrification share Units: billion tce
  • 15.
    TRANSFORM THE ELECTRICITYTRANSMISSION NETWORK TO A PLARTFORM FOR OPTIMIZING RESCOURES ALLOCATION Inter-provincial Transmission Capacity Demand in High Penetration Scenario(GW)
  • 16.
    国家发展和改革委员会能源研究所 Energy Research InstituteNational Development and Reform Commission TECHNOLOGICAL AND INSTITUTIONAL INNOVATION IS THE FOUNDATION BUILA A HIGH RENEWABLE ENERGY PENETRATION POWER SYSTEM RE Thermal power Hydro power Wind power PV Power System Flexibility Wireless charging 储能电站 Forecast Flexible generation Driverless EV EV Driverless EV Charging Station Mobile Station  Bidding at power market  Coordinate EVs with smart vehicle network, driverless cars and wireless charging technology  Business model: charging and discharging services, and shared EV services  Recycle Battery, provide energy storage service to Grid Integration Operator Demand Response Ancillary Services Power Generation Regulation Output Regulation Smart metering Virtual data center Power Market
  • 17.
    BUILDING A HIGHRENEWABLE ENERGY PENETRATION POWER SYSTEM AT A SMALL OR NON-INCREMENTAL COST kWh Cost Development Trend in High Penetration Scenario 2011 2015 2020 2025 2030 2035 2040 2045 2050 Transmission Cost 0.180 0.182 0.183 0.185 0.190 0.199 0.213 0.230 0.250 Start-up costs 0.000 0.001 0.001 0.001 0.002 0.003 0.005 0.005 0.005 Fuel Cost 0.276 0.259 0.262 0.233 0.186 0.143 0.111 0.094 0.080 Variable O&M 0.022 0.021 0.019 0.016 0.014 0.011 0.010 0.010 0.010 Fixed O&M 0.023 0.028 0.029 0.035 0.040 0.044 0.050 0.053 0.054 Capital Cost 0.244 0.212 0.196 0.212 0.240 0.266 0.285 0.285 0.287 0.746 0.701 0.689 0.683 0.672 0.666 0.674 0.678 0.685 0.000 0.100 0.200 0.300 0.400 0.500 0.600 0.700 0.800 Yuan/KWh
  • 18.
    AS A NEWECONOMIC GROWTH POINT, RE CAN SIGNIFICANTLY IMPROVE DEVELOPMENT QUALITY OF OVERALL ECONOMY Contribution of RE and related industries to GDP 2.5% 1.6% 2.9% 0.9% 6.2% 0.0% 1.0% 2.0% 3.0% 4.0% 5.0% 6.0% 7.0% 2010 2020 2030 2050 Growth of Employment in RE and related industries (unit: 10000) Wind Solar EV Other RE 125 65 46 15 13 481 377 81 36 250 0 100 200 300 400 500 600 Solar Wind Hydro Biomass Others 2015 2050 0 1000 2000 3000 4000 5000 6000 7000 8000 Energy Sector Employment in 2010 (unit: 1000) Coal Oil Gas Electricity RE Nuclear R&D
  • 19.
    HIGH RENEWABLE ENERGYPENETRATION WILL HELP BRING BACK CLEAR WATER AND BLUE SKIES 2050 China's SO2 and NOX Emission in High Penetration Scenario 0% 5% 10% 15% 20% 25% 30% 35% 0.00 1.00 2.00 3.00 4.00 5.00 6.00 7.00 8.00 9.00 10.00 1990 1995 2000 2005 2010 2015 2020 2025 2030 2035 2040 2045 2050 China USA EU China Share of Global Units: billion tons 0.0 5.0 10.0 15.0 20.0 25.0 30.0 1990 2000 2005 2009 2010 2011 2012 2015 2020 2025 2030 2035 2040 2045 2050 China SO2 Emission High Penetration Scenario China Nox Emission High Penetration Scenario Units: million tons 2050 China's CO2 Emission in the Global Contrast in High Penetration Scenario Note: China's data after 2010 is scenario data And data of other countries is trend prediction Data from IEA ETP 2014
  • 20.
    2050 HIGH PENETRATIONSCENARIO: PATHWAY Largest Challenge: Variability of Renewables!
  • 21.
    Achieve Higher-level DynamicStability Through Changes: Internet + Intelligence Comm Internet Energy Internet Internet of Things Flexibility Supply Side Changes Demand Side Also Changes Stability? Reliability ?
  • 22.
    System with HighRE Penetration Will Be a Reliable Power System Variable demand Variable generation Smart Control and real- time price Demand side flexibility Flexible generation units
  • 23.
    Contribution of EV’sFlexibility to the Power System Vehicle Technology Charging Mode Operation Features EV Charging and Discharging Load EV Plug-in Fuel Battery Low Voltage AC DC Changeable Battery Frequency of Charging Miles TimeWireless Charging Types and Numbers Passenger V Bus/Business/Delivery Trucks Daily miles Integration Charging Load Curves Charging control and Storage
  • 24.
    New Business modelof EV Will Change the Concept of Power Dispatch 退役电池 回收 EV Integration Operator Mobile Stations Fixed Stations 流动站点 Wireless Charging EV Business Model and Integrated Operation of Power System Wireless Charging
  • 25.
    Energy Storage ofEV Case Study for 2030 in Beijing
  • 26.
    880GW Flexible CoalWill Provide Support for Stable and Reliable Operation of the Power System in 2050
  • 27.
    Hourly Dispatch ona Typical Day in High Penetration Scenario 0 500,000 1,000,000 1,500,000 2,000,000 2,500,000 T001 T002 T003 T004 T005 T006 T007 T008 T009 T010 T011 T012 T013 T014 T015 T016 T017 T018 T019 T020 T021 T022 T023 T024 NUCLEAR COAL Hydro NAT_GAS WIND WOOD SOLAR GEOTHERMAL BIOGAS STRAW MUNI_WASTE HEAT WAVE FUELOIL PUMPED_HYDRO
  • 28.
    ACTION PLAN FORHIGH RENEWABLE ENERGY PENETRATION
  • 29.
    BUILDING HIGH RENEWABLEENERGY PENETRATION FUTURE WILL BRING “NON- ZERO-SUM”RESULTS • Market Oriented • Economically Viable • Consider both long term and near term • Soft and Hard Supports • Benefit the Whole Society
  • 30.
    KEY ELEMENTS ofTHE ACTION PLANS 20202015 2030 2040 2050 Technology Revolution Extract potential of grid, strengthen infrastructure of provincial distribution network, especially 500KV interconnection lines for large wind and solar bases EV Industrialized,EV become pillar of vehicle industry or even of the national economy by 2025 Enter the era of Energy Internet by 2025: efficiently integrate EV, smart network, and Demand Response; annual installation of wind and solar power each hit 100GW ,Power Sector Reform ongoing in parallel with 13th FYP implementation; Building a competitive power market in China within 10 years Reform of State Owned Enterprises: Improve Market Mechanism and break monopoly Energy transformation of Germany(Learn and Cooperate)、Denmark concepts to phase out fossil energy Global energy governance is a trend,and conformed with Pareto Standard. Only cooperation will lead to win-win! Technology Innovation: Significantly increase electrification rate in end-use consumptions, flexible coal(target: 1000 hours), modernized manufacture and 3-Networks Integration Institutional Reform International Cooperation
  • 31.
    Do not everthink about that we can escape, our every each step determine the final outcome, our foot steps are moving towards the end of own chosen target. ──Milan Kundera