Download to read offline

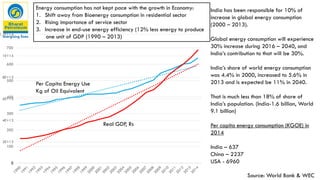
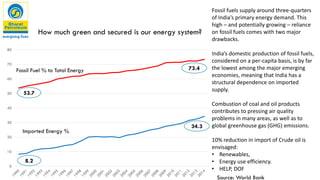
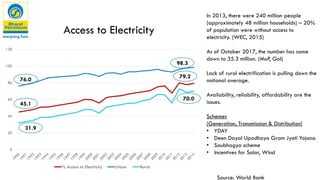
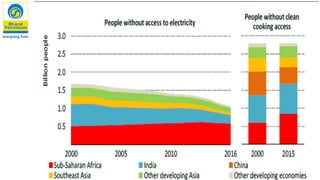
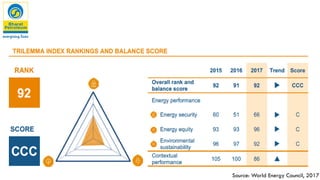
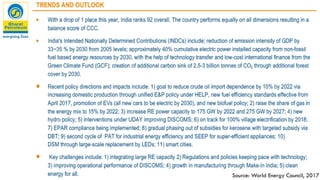
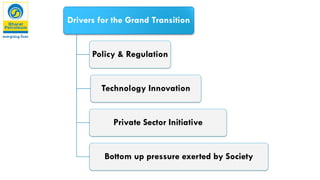
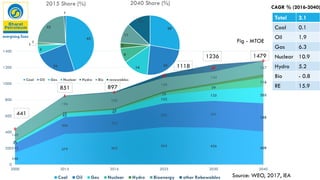


- India's energy consumption is growing rapidly but still lags population growth, resulting in lower per capita energy use than countries like China and the US. - India has improved energy efficiency but still relies heavily on fossil fuels, importing over 30% of its energy needs. - Access to electricity has increased greatly but nearly 35 million Indians still lack access, particularly in rural areas. - India has set targets to boost renewable energy and reduce emissions intensity in line with the Paris Agreement goals. Transitioning to a cleaner energy system will depend on policy support, technology innovations, private sector initiatives, and public pressure.


