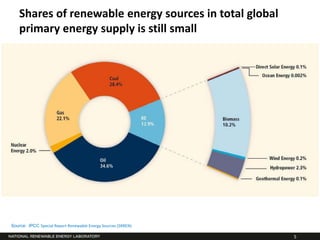
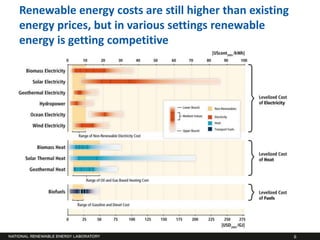
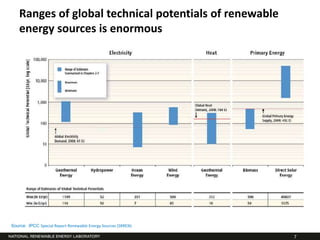
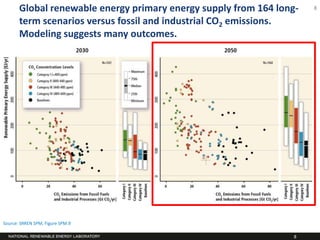
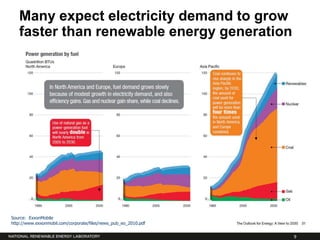
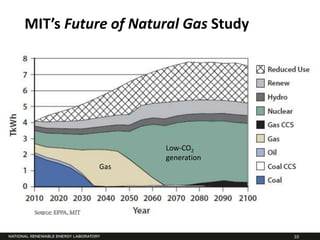
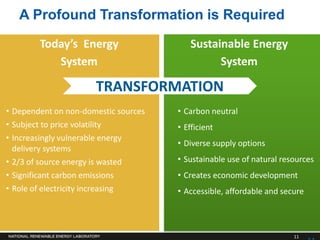
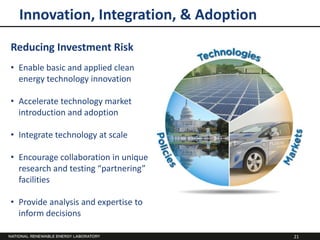
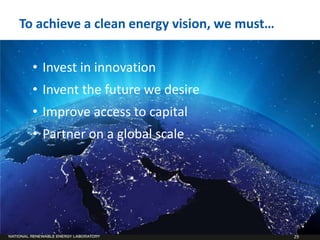
Realizing a Clean Energy
                                                Future


                                                                 World Renewable Energy
                                                                  Forum 2012

                                                                 Dr. Dan E. Arvizu

                                                                 Laboratory Director
NREL is a national laboratory of the U.S. Department of Energy, Office of Energy Efficiency and Renewable Energy, operated by the Alliance for Sustainable Energy, LLC.
Energy Context
National Energy Imperatives


          Reducing                           Stimulating
       dependence on                        clean-energy
       foreign sources                     companies and
                                             job growth


                            Protecting
                          resources and
                         reducing global
                             warming

                                                           3
4
Shares of renewable energy sources in total global
   primary energy supply is still small


Source: IPCC Special Report Renewable Energy Sources (SRREN)

                                                               5
Renewable energy costs are still higher than existing
energy prices, but in various settings renewable
energy is getting competitive


                                                        6
Ranges of global technical potentials of renewable
   energy sources is enormous


Source: IPCC Special Report Renewable Energy Sources (SRREN)

                                                               7
Global renewable energy primary energy supply from 164 long-   8

       term scenarios versus fossil and industrial CO2 emissions.
       Modeling suggests many outcomes.


Source: SRREN SPM, Figure SPM.9

                                                                  8
Many expect electricity demand to grow
   faster than renewable energy generation


Source: ExxonMobile
http://www.exxonmobil.com/corporate/files/news_pub_eo_2010.pdf


                                                                 9
MIT’s Future of Natural Gas Study


                    Low-CO2
                    generation
          Gas


                                    10
A Profound Transformation is Required
        Today’s Energy                   Sustainable Energy
           System                              System

                      TRANSFORMATION
• Dependent on non-domestic sources   • Carbon neutral
• Subject to price volatility         • Efficient
• Increasingly vulnerable energy
                                      • Diverse supply options
  delivery systems
• 2/3 of source energy is wasted      • Sustainable use of natural resources
• Significant carbon emissions        • Creates economic development
• Role of electricity increasing      • Accessible, affordable and secure


                                                                      11
Energy Sector Challenges


     R&D Investment
     Drives Innovation          Asset Utilization


 Capital Intensive with Long   National Strategies Driving
   Shaping the Market               Energy Market
          Life Cycles


                                                             12
RE Sector Capacities Vary by Region


                                      Source: REN21 (2011)


                                                 13
RE has achieved varying degrees of penetration

Country                                             % Renewable Generation (2010)
Australia                                                        8%
China                                                           19%                 Highest
                                                                                    penetration on
Denmark                                                         34%                 annual basis
Germany                                                         18%
India                                                           15%
Ireland                                                         13%
Mexico                                                          18%
Spain                                                           34%
Thailand                                                         8%
United Kingdom                                                   7%
United States                                                   11%


Source: U.S. EIA, International Energy Statistics


                                                                                                 14
As a result, different settings for RE integration
         Percentage of Electricity Generation by Type, 2010

              Australia                             Denmark     Germany
                Australia                                                     Nuclear


                                                                              Hydroelectric


                                                                              Geothermal


                                                                              Wind
                Ireland                              Spain    United States
                                                                              Solar, Tide and
                                                                              Wave
                                                                              Biomass and
                                                                              Waste
                                                                              Total Conventional
                                                                              Thermal

Source: U.S. EIA, International Energy Statistics


                                                                                                   15
Renewable Portfolio Standards


April 2012
Source: DSIRE http://www.dsireusa.org/summarymaps/index.cfm?ee=1&RE=1
                                                                        16
Renewable Share of Total Generation by State
Up Across the United States


Source: U.S. Energy Information Administration, Form EIA-923, Power Plant Operations Report.
Notes: Non-hydroelectric renewables include generation from wind, solar, geothermal, and other renewable sources
such as wood and wood wastes, municipal solid wastes, landfill gas, etc. Data for 2011 are preliminary.

                                                                                                          17
Specific Implementation Challenges

• Legal, market, and institutional barriers—Increasing power system
  flexibility needed to integrate variable RE (e.g., through larger balancing
  areas, new market rules) may require significant ecosystem-wide
  changes
• Coordination—Due to the involvement of multiple agencies and
  jurisdictions, developing and implementing a shared vision could be
  challenging
• Public support—The public may not understand or support actions
  necessary to integrate renewables
• Customizing solutions—There is no one-size-fits-all solution to
  integrating variable renewables; countries need to determine the most
  appropriate combination of approaches


                                                                            18
High-Penetration Renewables

                     New study to be
                     presented and
                     discussed in WREF
                     Thursday panel session


                                          19
All regions of the country could contribute substantial
renewable electricity supply in 2050


                                                      20
Innovation, Integration, & Adoption
Reducing Investment Risk
• Enable basic and applied clean
  energy technology innovation

• Accelerate technology market
  introduction and adoption

• Integrate technology at scale

• Encourage collaboration in unique
  research and testing “partnering”
  facilities

• Provide analysis and expertise to
  inform decisions

                                        21
Status of the Technologies
Multiple Promising PV Technologies


 20x-100x   500x   Cu(In,Ga)Se2 ~ 1-2 um   c-Si ~ 180 um


                                                           23
Wind Technology Innovation
• Modular large components –
  blades, drivetrains, and tall towers
• Advanced drivetrain power conversion
  systems – superconducting direct drive
  generators
• Flexible, ultra-large rotors and systems
• Active controls for structural load
  reduction, improved wind plant
  performance, and grid-friendly operation
• Floating offshore wind turbines
• Airborne wind power systems


                                             24
Biofuels Innovation
New conversion technologies are being developed, offering the
possibility of revolutionary, high volume methods for producing biofuel
hydrocarbon fuels for our trucks, trains, ships, and aircraft . . .

     Biological             Chemical Catalytic        Pyrolysis/Bio-Oil
     Conversion                Conversion                Pathways


    Heterotrophic Algae Conversion       Hybrid Conversion Technologies


                                                                     25
Transportation Innovation
  Portfolio of technologies leading to 54.5 mpg


                                                                                    Low rolling resistance tires
Degree of electrification      Start/stop                    Regenerative braking
(power electronics &
energy storage )

                                                                                             8 speed
                                                                                        transmissions


Electric infrastructure     Electric powered steeringLight weighting


                                   Variable                   Improved                 Diesel powered & or
                                   cylinder mgmt              aerodynamics             Alternative Fuels, H2
Turbocharging, direct fuel injection, advanced combustion

                                                                                                               26
Buildings Innovation


High Performance Buildings   BIPV Products & PV-T Array    Compressorless Cooling


Electrochromic Windows       Polymer Solar Water Heaters   Computerized optimization &
                                                           simulation Tools


                                                                                    27
Efficiency/Integration Innovation
Buildings
• Whole building systems integration
• Computerized building energy optimization tools
• Advanced HVAC (Heating Ventilating and air
  conditioning)
• Cost effective ultra energy efficient retrofits

Grid Integration
Interconnection Standards
• IEEE Standards Development
• Standards Testing and Validation
Smart-Grid Data Hub
RE Grid Integration
• Power Electronics for Interconnection monitoring and
   control
• Grid-to-vehicle interface

Advanced Vehicles
• Fuels utilization
• Component technologies
• Electric vehicle-to-grid interface
                                                         28
To achieve a clean energy vision, we must…


  • Invest in innovation
  • Invent the future we desire
  • Improve access to capital
  • Partner on a global scale


                                             29
Visit us online at www.nrel.gov


                              May 2011
                                  30

Dan Arvizu at WREF 2012

  • 1.
    Realizing a CleanEnergy Future World Renewable Energy Forum 2012 Dr. Dan E. Arvizu Laboratory Director NREL is a national laboratory of the U.S. Department of Energy, Office of Energy Efficiency and Renewable Energy, operated by the Alliance for Sustainable Energy, LLC.
  • 2.
  • 3.
    National Energy Imperatives Reducing Stimulating dependence on clean-energy foreign sources companies and job growth Protecting resources and reducing global warming 3
  • 4.
  • 5.
    Shares of renewableenergy sources in total global primary energy supply is still small Source: IPCC Special Report Renewable Energy Sources (SRREN) 5
  • 6.
    Renewable energy costsare still higher than existing energy prices, but in various settings renewable energy is getting competitive 6
  • 7.
    Ranges of globaltechnical potentials of renewable energy sources is enormous Source: IPCC Special Report Renewable Energy Sources (SRREN) 7
  • 8.
    Global renewable energyprimary energy supply from 164 long- 8 term scenarios versus fossil and industrial CO2 emissions. Modeling suggests many outcomes. Source: SRREN SPM, Figure SPM.9 8
  • 9.
    Many expect electricitydemand to grow faster than renewable energy generation Source: ExxonMobile http://www.exxonmobil.com/corporate/files/news_pub_eo_2010.pdf 9
  • 10.
    MIT’s Future ofNatural Gas Study Low-CO2 generation Gas 10
  • 11.
    A Profound Transformationis Required Today’s Energy Sustainable Energy System System TRANSFORMATION • Dependent on non-domestic sources • Carbon neutral • Subject to price volatility • Efficient • Increasingly vulnerable energy • Diverse supply options delivery systems • 2/3 of source energy is wasted • Sustainable use of natural resources • Significant carbon emissions • Creates economic development • Role of electricity increasing • Accessible, affordable and secure 11
  • 12.
    Energy Sector Challenges R&D Investment Drives Innovation Asset Utilization Capital Intensive with Long National Strategies Driving Shaping the Market Energy Market Life Cycles 12
  • 13.
    RE Sector CapacitiesVary by Region Source: REN21 (2011) 13
  • 14.
    RE has achievedvarying degrees of penetration Country % Renewable Generation (2010) Australia 8% China 19% Highest penetration on Denmark 34% annual basis Germany 18% India 15% Ireland 13% Mexico 18% Spain 34% Thailand 8% United Kingdom 7% United States 11% Source: U.S. EIA, International Energy Statistics 14
  • 15.
    As a result,different settings for RE integration Percentage of Electricity Generation by Type, 2010 Australia Denmark Germany Australia Nuclear Hydroelectric Geothermal Wind Ireland Spain United States Solar, Tide and Wave Biomass and Waste Total Conventional Thermal Source: U.S. EIA, International Energy Statistics 15
  • 16.
    Renewable Portfolio Standards April2012 Source: DSIRE http://www.dsireusa.org/summarymaps/index.cfm?ee=1&RE=1 16
  • 17.
    Renewable Share ofTotal Generation by State Up Across the United States Source: U.S. Energy Information Administration, Form EIA-923, Power Plant Operations Report. Notes: Non-hydroelectric renewables include generation from wind, solar, geothermal, and other renewable sources such as wood and wood wastes, municipal solid wastes, landfill gas, etc. Data for 2011 are preliminary. 17
  • 18.
    Specific Implementation Challenges •Legal, market, and institutional barriers—Increasing power system flexibility needed to integrate variable RE (e.g., through larger balancing areas, new market rules) may require significant ecosystem-wide changes • Coordination—Due to the involvement of multiple agencies and jurisdictions, developing and implementing a shared vision could be challenging • Public support—The public may not understand or support actions necessary to integrate renewables • Customizing solutions—There is no one-size-fits-all solution to integrating variable renewables; countries need to determine the most appropriate combination of approaches 18
  • 19.
    High-Penetration Renewables New study to be presented and discussed in WREF Thursday panel session 19
  • 20.
    All regions ofthe country could contribute substantial renewable electricity supply in 2050 20
  • 21.
    Innovation, Integration, &Adoption Reducing Investment Risk • Enable basic and applied clean energy technology innovation • Accelerate technology market introduction and adoption • Integrate technology at scale • Encourage collaboration in unique research and testing “partnering” facilities • Provide analysis and expertise to inform decisions 21
  • 22.
    Status of theTechnologies
  • 23.
    Multiple Promising PVTechnologies 20x-100x 500x Cu(In,Ga)Se2 ~ 1-2 um c-Si ~ 180 um 23
  • 24.
    Wind Technology Innovation •Modular large components – blades, drivetrains, and tall towers • Advanced drivetrain power conversion systems – superconducting direct drive generators • Flexible, ultra-large rotors and systems • Active controls for structural load reduction, improved wind plant performance, and grid-friendly operation • Floating offshore wind turbines • Airborne wind power systems 24
  • 25.
    Biofuels Innovation New conversiontechnologies are being developed, offering the possibility of revolutionary, high volume methods for producing biofuel hydrocarbon fuels for our trucks, trains, ships, and aircraft . . . Biological Chemical Catalytic Pyrolysis/Bio-Oil Conversion Conversion Pathways Heterotrophic Algae Conversion Hybrid Conversion Technologies 25
  • 26.
    Transportation Innovation Portfolio of technologies leading to 54.5 mpg Low rolling resistance tires Degree of electrification Start/stop Regenerative braking (power electronics & energy storage ) 8 speed transmissions Electric infrastructure Electric powered steeringLight weighting Variable Improved Diesel powered & or cylinder mgmt aerodynamics Alternative Fuels, H2 Turbocharging, direct fuel injection, advanced combustion 26
  • 27.
    Buildings Innovation High PerformanceBuildings BIPV Products & PV-T Array Compressorless Cooling Electrochromic Windows Polymer Solar Water Heaters Computerized optimization & simulation Tools 27
  • 28.
    Efficiency/Integration Innovation Buildings • Wholebuilding systems integration • Computerized building energy optimization tools • Advanced HVAC (Heating Ventilating and air conditioning) • Cost effective ultra energy efficient retrofits Grid Integration Interconnection Standards • IEEE Standards Development • Standards Testing and Validation Smart-Grid Data Hub RE Grid Integration • Power Electronics for Interconnection monitoring and control • Grid-to-vehicle interface Advanced Vehicles • Fuels utilization • Component technologies • Electric vehicle-to-grid interface 28
  • 29.
    To achieve aclean energy vision, we must… • Invest in innovation • Invent the future we desire • Improve access to capital • Partner on a global scale 29
  • 30.
    Visit us onlineat www.nrel.gov May 2011 30

Editor's Notes

  • #20 The format of this session will be a series of brief presentations, followed by a moderated Q&A session with speakers forming a panel. The Renewable Electricity Futures Study (RE Futures) is an initial investigation of the extent to which renewable energy supply can meet the electricity demands of the contiguous United States over the next several decades. The analysis examines the implications and challenges of renewable electricity generation levels—from 30% up to 90%, with a focus on 80%, of all U.S. electricity generation from renewable technologies—in 2050. At such high levels of renewable electricity penetration, the unique characteristics of some renewable resources, specifically geographical distribution and variability and uncertainty in output, may pose challenges to the operability of the nation’s electric system. The study focuses on key technical implications of this environment, exploring whether the U.S. power system can supply electricity to meet customer demand on an hourly basis with high levels of renewable electricity, including variable wind and solar generation. The study also begins to address the potential economic, environmental, and social implications of deploying and integrating high levels of renewable electricity in the United States. The bulleted list below summarizes the major topics summarized from the Renewable Electricity Futures study and to be presented by the speakers:- The study structure and methodology, including detailed electric sector modeling.- Overview of renewable electricity technologies, current deployment levels, technical potential, and grid integration characteristics.- Future electricity demand and possibilities for energy efficiency and demand-side flexibility options.- Modeled scenarios with up to 80% renewable electricity by 2050. The scenarios include multiple deployment pathways that transition away from fossil consumption to high renewable generation levels. Hourly operation is also modeled to explore the grid challenges associated with integration variable generation.- Economic and environmental implications of the high renewable generation scenarios.
  • #28 Upper Right: NREL designed and built a Net Zero Energy Habitat for Humanity House about 5 miles from the NREL campus. Over the two years that NREL monitored the building it actually produced 3000 kWh more than it used (accounting for gas use). Key energy features of the building are: a) Highly Insulated R-30 Walls and R-60 roof, b) passive solar window design, c) energy recovery ventilation system, e) 4kW PV array, f) Solar domestic hot water system backed up by an instantaneous gas water heater. Upper Middle: NREL has collaborated with industry to develop a number of Building Integrated PV (BIPV) systems that can work with shingle style roofs, standing seam metal roofs, and flat “built-up” roofs. NREL has also partnered with industry to develop a combined PV-Thermal system (shown on the house) that simultaneously cools the PV array, and preheats the solar thermal array providing electricity and hot water while reducing the roof area needed for the panels.Upper Right: NREL has collaborated with industry to produce a variety of evaporative and desiccant based coolers that are more efficient than vapor compression technology. NREL has also developed a revolutionary concept “DEVap” that combines desiccant and evaporative cooling in a single element making it possible to do highly efficient evaporative cooling anywhere in the country. Analysis for a DEVap unit in Phoenix showed 80% energy savings compared to a typical vapor compression air conditioner (even accounting for the 1 to 2 month humid monsoon period in the summer).Bottom Left: NREL has collaborated with industry to develop electrochromic windows that can be controlled to darken when the sun is not wanted, and lighten when the sun is beneficial.Bottom Middle: NREL has collaborated with industry partners to develop two low-cost polymer based solar hot water systems. The system in a box can be purchased at Home Depot and installed as a do-it-yourself project for about $1000.Bottom Right: NREL has developed building energy simulation and optimization tools that enable the most cost effective package of efficiency and renewable technologies to be determined for any given savings level, in any building type, in any climate. Other NREL developed tools assist developers to design energy efficient community layouts accounting for trees and other buildings.