Downloaded 10 times


![ANNEX – 53
SHARED MOBILITY - © OECD/ITF 2016
Annex
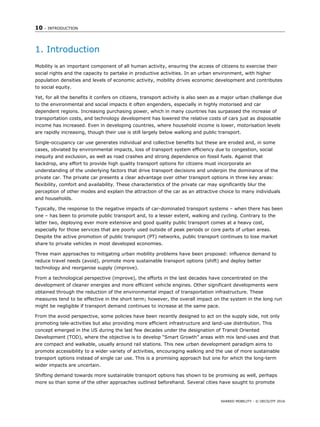
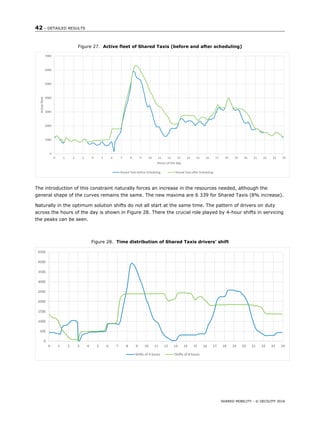
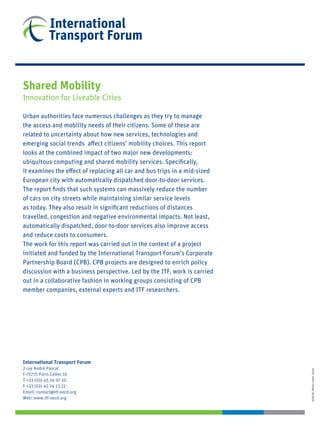
The model specification and calibration results are presented in Table A-1 below and nested-logit
aggregates transport alternatives into:
"Motorised Private transport” nest: private car (PC), motorcycle (MT) and taxi (TX);
"Public transport plus walking” nest: bus (BS), walk (WK), heavy public transport – metro and rail
(HV) and bus + heavy public transport (CB).
Table A-1. Coefficients of the obtained discrete choice model
Attributes Transport Alternatives
Motorised Private transport (MP) Public transport plus walking (PT)
PC MT TX BS WK HV CB
ASC NA NA -
4.230***
-0.218* -
1.140***
-0.270* -
0.706***
Socio-demographic attributes
Age [25-35] NA NA NA NA NA 0.559*** NA
Age [35-65] NA NA NA NA -0.308* NA -
Age [+65] NA NA NA 0.195* NA NA -
Income (thousand €) NA NA NA 0.007*** NA NA NA
Land use, car and public transport monthly pass availability
No parking at home NA NA 0.237*** NA NA NA NA
No parking at
destination
NA NA 0.237*** NA NA NA NA
Own car NA NA NA NA NA NA NA
Public transport pass NA NA NA 0.562*** -
0.766***
0.562*** NA
Parking Pressure [0-1] -
0.131***
NA NA NA NA NA NA
Transport operation attributes
Fuel cost (€) -
0.326***
-
0.326***
NA NA NA NA NA NA
Toll (€) -
0.221***
-
0.221***
- NA NA NA NA NA
Parking cost (€) -
0.221***
NA NA NA NA NA NA NA
Travel time (min) -
0.026***
-
0.026***
-
0.026***
-
0.024***
-
0.005***
-
0.015***
-
0.015***
Access time (min) NA NA NA -
0.051***
NA -
0.053***
-
0.051***
Tariff (€) NA NA -
0.115***
-
0.498***
NA -
0.498***
-
0.498***
Transfers NA NA NA -
0.199***
NA -0.150** -0.150**
Waiting time (min) NA NA -
0.028***
-
0.028***
NA -
0.045***
-
0.028***
Nested scale (η) 1.000 1.951
0- test significance NA ***
1-test significance NA ***
***significant at the 99% level; **significant at the 95% level; *significant at the 90% level.
†Parking pressure defined as the ratio between estimated demand and supply of parking in a specific area and time period of the
day.
The model proved to have an adequate specification: ρ2=0.37 and the utility function of each transport
alternative included socio-demographic variables of the user, land use, car and transit availability and
instrumental attributes such as travel time and cost, all being statistically significant at a 90% confidence
level.](https://image.slidesharecdn.com/shared-mobility-liveable-cities-160901153401/85/Shared-Mobility-54-320.jpg)


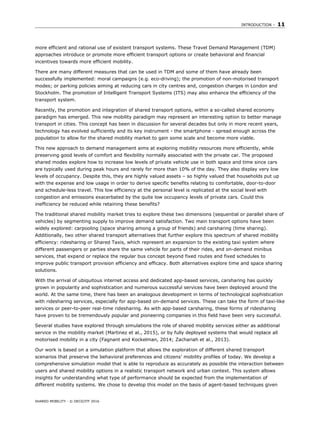
The document introduces the concept of shared mobility as a potential solution to address the negative impacts of car-dominated urban transport systems. It discusses how previous approaches have focused on promoting public transport, reducing travel needs, and improving vehicle technology. A new simulation is presented that models replacing all car and bus trips in a city with on-demand shared vehicles, including shared taxis and mini-buses. The simulation finds this approach could significantly reduce traffic, emissions, and parking needs while improving access and social inclusion. It examines the impacts on vehicle requirements, travel patterns, and the citizen experience of using shared mobility services.


