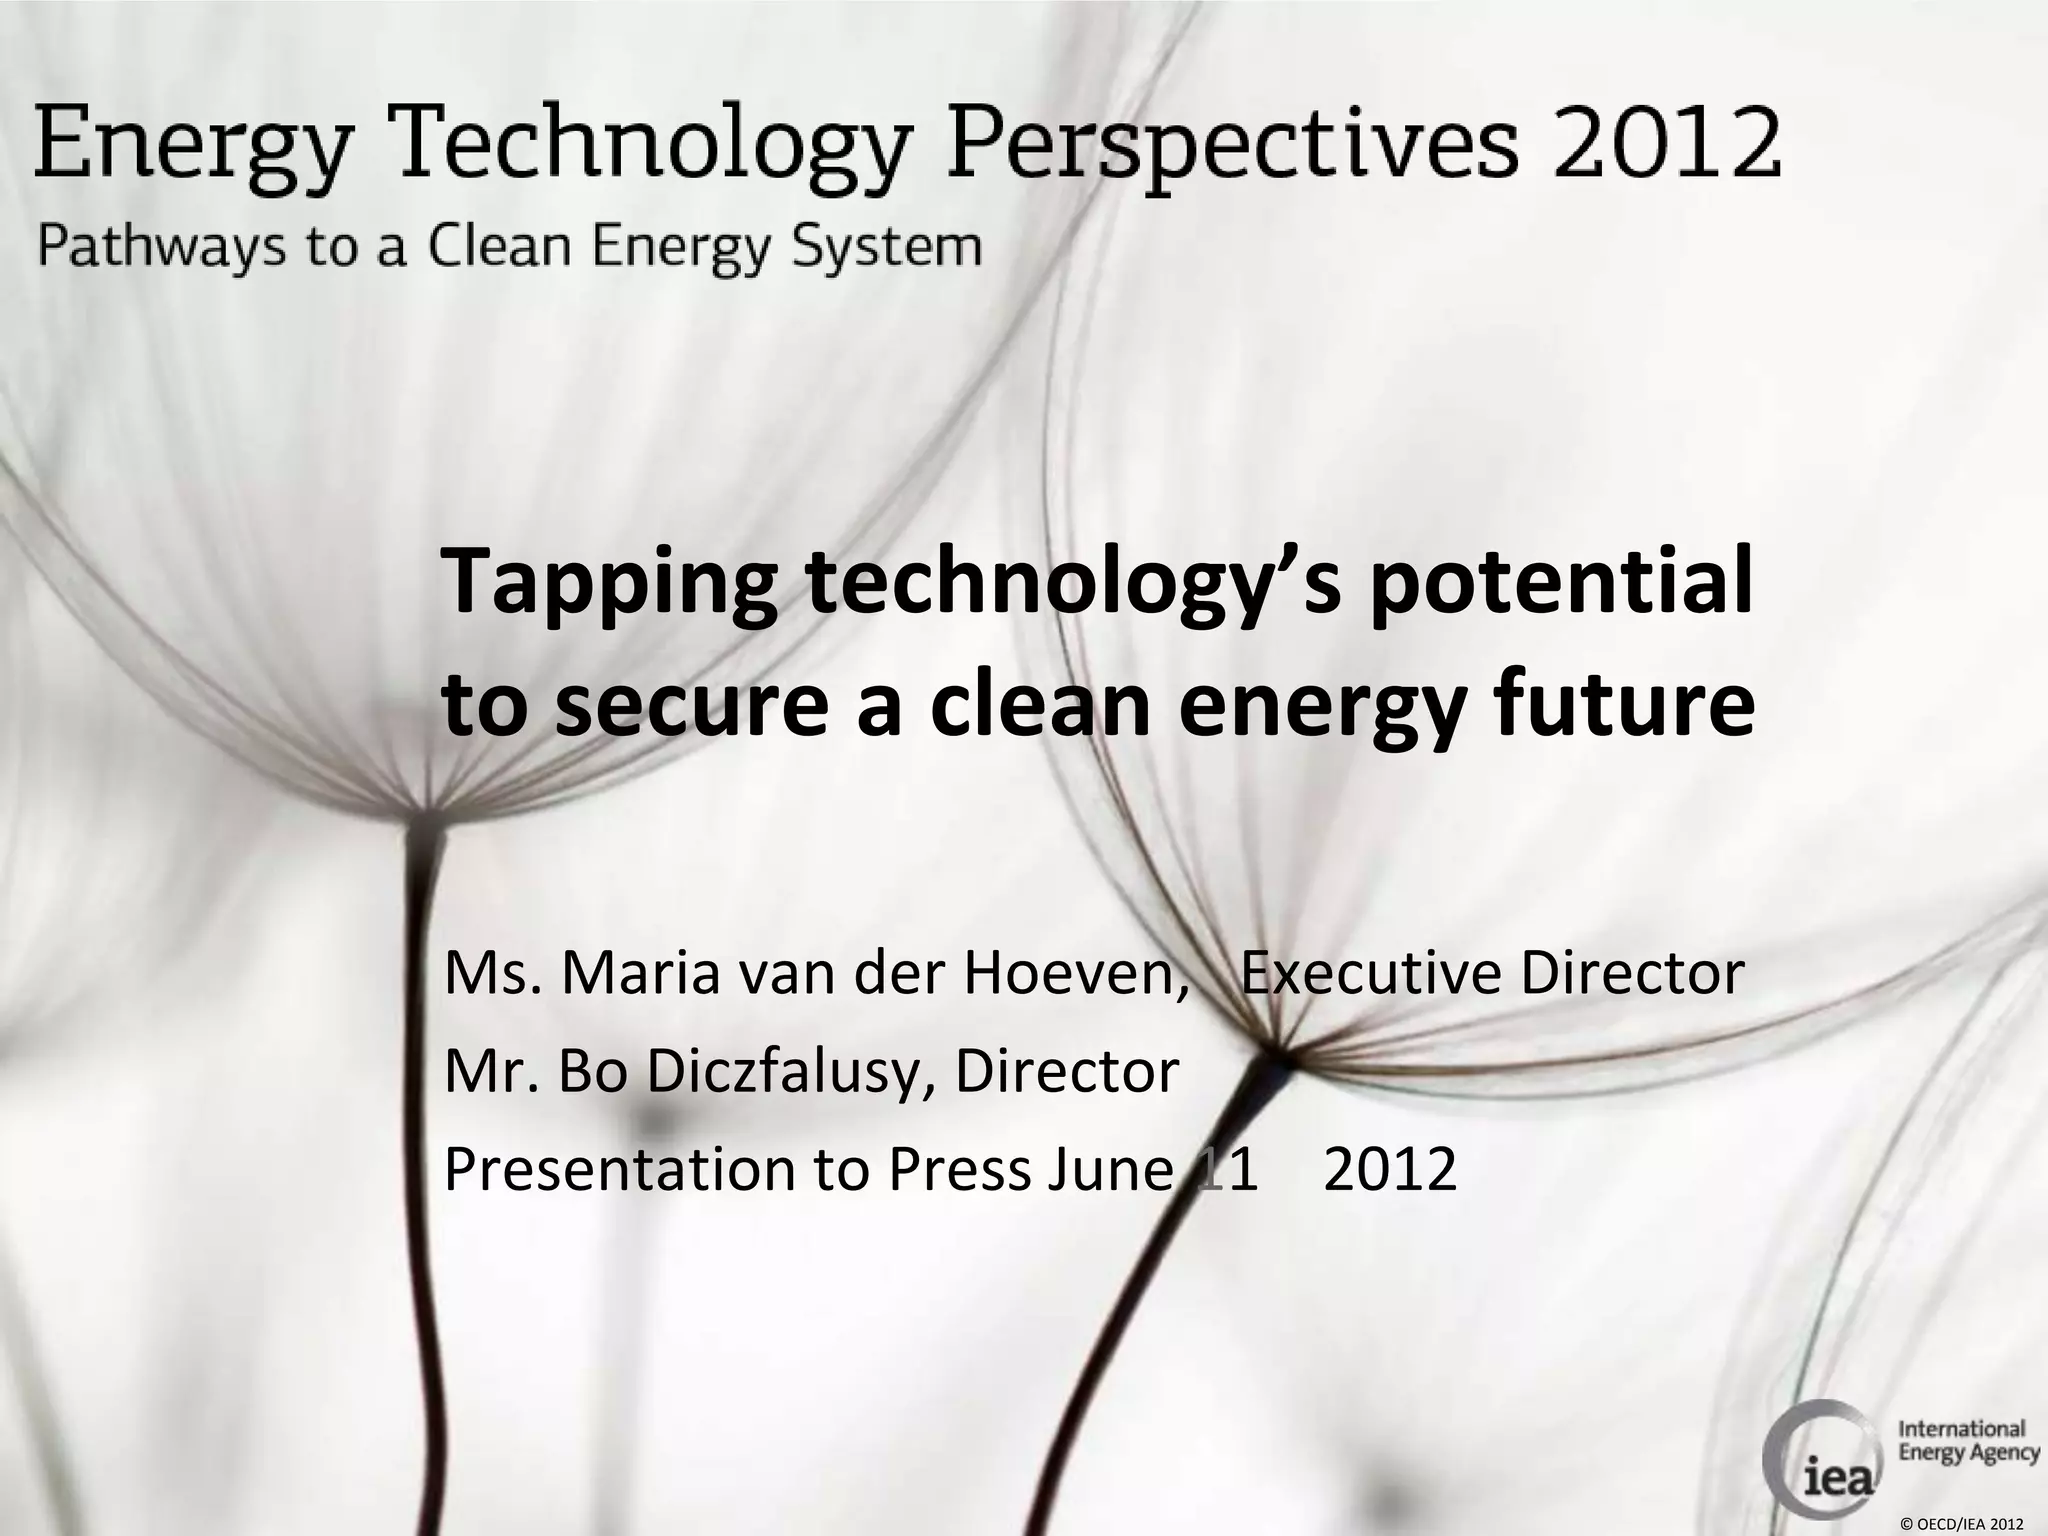
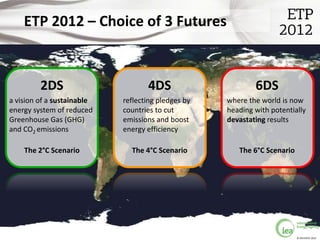
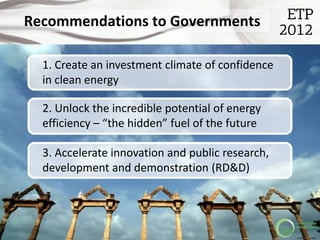
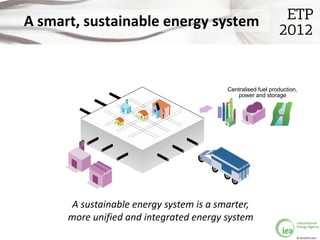
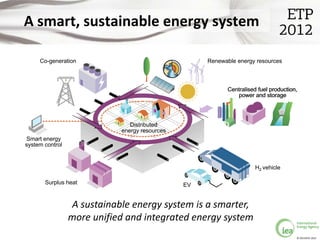
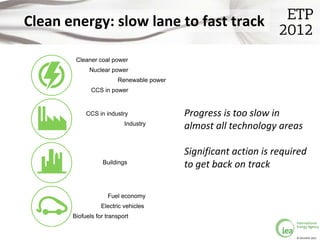
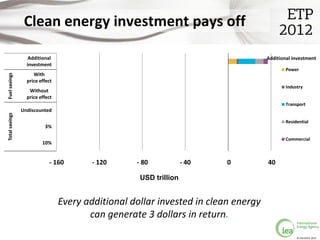
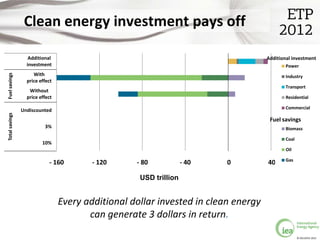
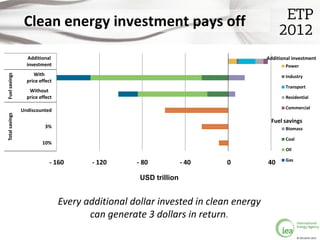
Tapping technology’s potential
to secure a clean energy future

Ms. Maria van der Hoeven, Executive Director
Mr. Bo Diczfalusy, Director
Presentation to Press June 11 2012


                                               © OECD/IEA 2012
ETP 2012 – Choice of 3 Futures


         2DS                       4DS                      6DS
a vision of a sustainable   reflecting pledges by   where the world is now
energy system of reduced    countries to cut        heading with potentially
Greenhouse Gas (GHG)        emissions and boost     devastating results
and CO2 emissions           energy efficiency

    The 2°C Scenario          The 4°C Scenario         The 6°C Scenario


                                                                          © OECD/IEA 2012
Sustainable future still in reach


Are we on track to   Can we get on    Is a clean energy
  reach a clean         track?       transition urgent?
 energy future?

   NO ✗               YES ✓             YES ✓


                                                    © OECD/IEA 2012
Recommendations to Governments

  1. Create an investment climate of confidence
  in clean energy

  2. Unlock the incredible potential of energy
  efficiency – “the hidden” fuel of the future

  3. Accelerate innovation and public research,
  development and demonstration (RD&D)


                                                  © OECD/IEA 2012
A smart, sustainable energy system


                                          Centralised fuel production,
                                             power and storage


       A sustainable energy system is a smarter,
      more unified and integrated energy system
                                                                     © OECD/IEA 2012
A smart, sustainable energy system

     Co-generation                                   Renewable energy resources


                                                            Centralised fuel production,
                                                               power and storage


                                Distributed
                             energy resources
Smart energy
system control


                                                                       H2 vehicle

       Surplus heat                             EV


                  A sustainable energy system is a smarter,
                 more unified and integrated energy system
                                                                                       © OECD/IEA 2012
Clean energy: slow lane to fast track

        Cleaner coal power
             Nuclear power
                        Renewable power
              CCS in power


            CCS in industry               Progress is too slow in
                           Industry
                                          almost all technology areas

                                          Significant action is required
                  Buildings
                                          to get back on track

                    Fuel economy
                  Electric vehicles
       Biofuels for transport


                                                                     © OECD/IEA 2012
Low-carbon electricity: a clean core

      45 000                                                 Other
      40 000                                                 Wind
      35 000                                                 Solar
      30 000                                                 Hydro
                                                             Nuclear
TWh


      25 000
                                                             Biomass and waste
      20 000
                                                             Oil
      15 000                                                 Gas with CCS
      10 000                                                 Gas
       5 000                                                 Coal with CCS
          0                                                  Coal
           2009    2020       2030        2040        2050

                  Renewables will generate more than
                  half the world’s electricity in the 2DS

                                                                          © OECD/IEA 2012
Natural Gas: a transitional fuel

                                    7 500
Power Generation from Natural Gas


                                    5 000
              TWh


                                    2 500


                                       0
                                        2009         2020             2030              2040   2050
                                                   Other non-OECD   India    China   OECD


                                            Around 2030, natural gas becomes ‘high carbon’

                                                                                                 © OECD/IEA 2012
The CCS infant must grow quickly

                                     Mt CO2


                                                       Mt CO2
             Mt CO2


                                              Mt CO2


                                                                Mt CO2
Mt CO2


Note: Capture rates in MtCO2 /year


                                                                         © OECD/IEA 2012
Industry must become more efficient

        12                                                      6DS

        10                                                      Other industries

         8                                                      Chemicals and
                                                                petrochemicals
GtCO2


         6                                                      Aluminium

         4                                                      Pulp and paper

         2                                                      Iron and steel

         0                                                      Cement
          2010       2020       2030        2040       2050

         Significant potential for enhanced energy efficiency
        can be achieved through best available technologies.

                                                                                 © OECD/IEA 2012
Electric vehicles need to come of age

                                200                                                 FCEV Electric Vehicles
                                                                                    Fuel Cell
                                                                                    Electricity
Passenger LDV sales (million)


                                150                                                 Plug-in hybrid diesel
                                                                                    Plug-in hybrid gasoline
                                100                                                 Diesel hybrid
                                                                                    Gasoline hybrid

                                 50                                                 CNG/LPG
                                                                                    Diesel

                                  0                                                 Gasoline
                                   2000   2010     2020    2030     2040     2050

                                  More than 90% of light duty vehicles need to be
                                      propelled by an electric motor in 2050
                                                                                                      © OECD/IEA 2012
Translating targets into action

                     8

                     7

                     6
million sales/year


                     5
                                                                             Projection
                     4                                                       (Estimated from
                                                                             each country's
                     3                                                       target)

                     2

                     1

                     0
                         2010   2012   2014    2016     2018    2020

                     Government targets need to be backed by policy action

                                                                                       © OECD/IEA 2012
Translating targets into action

                     8

                     7
                                                                         Manufacturers
                     6                                                   production/sales
million sales/year


                     5

                     4

                     3
                                                                         Projection
                     2                                                   (Estimated from
                                                                         each country's
                     1
                                                                         target)
                     0
                         2010
                         2010   2012
                                2012   2014
                                       2014    2016
                                               2016    2018
                                                       2018    2020
                                                               2020

                     Government targets need to be backed by policy action

                                                                                    © OECD/IEA 2012
Building Blocks of a Cleaner Future
                                       Total energy savings
                                               33 EJ Space heating
                                                             22%


                              Other
                              15%


                                                                                  Water heating
         Services                                                                     12%


                   Lighting, 3%
                                                                                              Residential
     Cooling and ventilation, 3%

               Water heating, 2%
                                                                                Cooking
                                                                                 15%
                   Space heating, 7%


                                       Appliances                  Cooling and ventilation
                                         10%          Lighting              5%
                                                        6%

 About 70% of buildings’ potential energy savings between
       the 4DS and 2DS are in the residential sector

                                                                                                            © OECD/IEA 2012
Building sector challenges differ

                     2.5

                     2.0
Billion households


                     1.5

                     1.0

                     0.5

                     0.0
                              2010   2020   2030   2040    2050
                           OECD

    75% of current buildings in OECD will still be standing in 2050
Building sector challenges differ

                     2.5

                     2.0
Billion households


                     1.5

                     1.0

                     0.5

                     0.0
                              2010    2020      2030   2040   2050
                           OECD      Non OECD

    75% of current buildings in OECD will still be standing in 2050
Heating & Cooling: huge potential

       Renewable heat                               Integration with electricity


                             District heating and
                              cooling network


      Co-generation                                              Surplus heat


   Heating and cooling account for 46% of global energy use.
Their huge potential for cutting CO2 emissions is often neglected.

                                                                                   © OECD/IEA 2012
Emissions must be eliminated by 2075


    A zero-carbon future looks possible but will be very
   challenging, even if 2050 targets are met in the 2DS.


                                                           © OECD/IEA 2012
Clean energy investment pays off

                   Additional                                                       Additional investment
                  investment                                                                Power
                                                                                            Power
                     With
Fuel savings


                                                                                            Industry
                  price effect
                                                                                            Industry
                                                                                            Transport
                   Without
                  price effect                                                              Residential
                                                                                            Transport
                                                                                            Commercial
                Undiscounted
Total savings


                                                                                     Fuel savings
                                                                                     Fuel savings
                                                                                           Residential
                          3%                                                                Biomass

                                                                                            Commercial
                                                                                            Coal
                         10%
                                                                                            Oil

                                                                                            Gas
                            - 160        - 120     - 80            - 40   0         40

                                                    USD trillion


                                 Every additional dollar invested in clean energy
                                        can generate 3 dollars in return.

                                                                                                  © OECD/IEA 2012
Clean energy investment pays off

                   Additional                                                       Additional investment
                  investment                                                                Power
                     With
Fuel savings


                                                                                            Industry
                  price effect
                                                                                            Transport
                   Without
                  price effect                                                              Residential

                                                                                            Commercial
                Undiscounted
Total savings


                                                                                     Fuel savings
                          3%                                                                Biomass

                                                                                            Coal
                         10%
                                                                                            Oil

                                                                                            Gas
                            - 160        - 120     - 80            - 40   0         40

                                                    USD trillion


                                 Every additional dollar invested in clean energy
                                        can generate 3 dollars in return.

                                                                                                   © OECD/IEA 2012
For much more, please visit

www.iea.org/etp


                              © OECD/IEA 2012

Tapping technology’s potential to secure a clean energy future

  • 1.
    Tapping technology’s potential tosecure a clean energy future Ms. Maria van der Hoeven, Executive Director Mr. Bo Diczfalusy, Director Presentation to Press June 11 2012 © OECD/IEA 2012
  • 2.
    ETP 2012 –Choice of 3 Futures 2DS 4DS 6DS a vision of a sustainable reflecting pledges by where the world is now energy system of reduced countries to cut heading with potentially Greenhouse Gas (GHG) emissions and boost devastating results and CO2 emissions energy efficiency The 2°C Scenario The 4°C Scenario The 6°C Scenario © OECD/IEA 2012
  • 3.
    Sustainable future stillin reach Are we on track to Can we get on Is a clean energy reach a clean track? transition urgent? energy future? NO ✗ YES ✓ YES ✓ © OECD/IEA 2012
  • 4.
    Recommendations to Governments 1. Create an investment climate of confidence in clean energy 2. Unlock the incredible potential of energy efficiency – “the hidden” fuel of the future 3. Accelerate innovation and public research, development and demonstration (RD&D) © OECD/IEA 2012
  • 5.
    A smart, sustainableenergy system Centralised fuel production, power and storage A sustainable energy system is a smarter, more unified and integrated energy system © OECD/IEA 2012
  • 6.
    A smart, sustainableenergy system Co-generation Renewable energy resources Centralised fuel production, power and storage Distributed energy resources Smart energy system control H2 vehicle Surplus heat EV A sustainable energy system is a smarter, more unified and integrated energy system © OECD/IEA 2012
  • 7.
    Clean energy: slowlane to fast track Cleaner coal power Nuclear power Renewable power CCS in power CCS in industry Progress is too slow in Industry almost all technology areas Significant action is required Buildings to get back on track Fuel economy Electric vehicles Biofuels for transport © OECD/IEA 2012
  • 8.
    Low-carbon electricity: aclean core 45 000 Other 40 000 Wind 35 000 Solar 30 000 Hydro Nuclear TWh 25 000 Biomass and waste 20 000 Oil 15 000 Gas with CCS 10 000 Gas 5 000 Coal with CCS 0 Coal 2009 2020 2030 2040 2050 Renewables will generate more than half the world’s electricity in the 2DS © OECD/IEA 2012
  • 9.
    Natural Gas: atransitional fuel 7 500 Power Generation from Natural Gas 5 000 TWh 2 500 0 2009 2020 2030 2040 2050 Other non-OECD India China OECD Around 2030, natural gas becomes ‘high carbon’ © OECD/IEA 2012
  • 10.
    The CCS infantmust grow quickly Mt CO2 Mt CO2 Mt CO2 Mt CO2 Mt CO2 Mt CO2 Note: Capture rates in MtCO2 /year © OECD/IEA 2012
  • 11.
    Industry must becomemore efficient 12 6DS 10 Other industries 8 Chemicals and petrochemicals GtCO2 6 Aluminium 4 Pulp and paper 2 Iron and steel 0 Cement 2010 2020 2030 2040 2050 Significant potential for enhanced energy efficiency can be achieved through best available technologies. © OECD/IEA 2012
  • 12.
    Electric vehicles needto come of age 200 FCEV Electric Vehicles Fuel Cell Electricity Passenger LDV sales (million) 150 Plug-in hybrid diesel Plug-in hybrid gasoline 100 Diesel hybrid Gasoline hybrid 50 CNG/LPG Diesel 0 Gasoline 2000 2010 2020 2030 2040 2050 More than 90% of light duty vehicles need to be propelled by an electric motor in 2050 © OECD/IEA 2012
  • 13.
    Translating targets intoaction 8 7 6 million sales/year 5 Projection 4 (Estimated from each country's 3 target) 2 1 0 2010 2012 2014 2016 2018 2020 Government targets need to be backed by policy action © OECD/IEA 2012
  • 14.
    Translating targets intoaction 8 7 Manufacturers 6 production/sales million sales/year 5 4 3 Projection 2 (Estimated from each country's 1 target) 0 2010 2010 2012 2012 2014 2014 2016 2016 2018 2018 2020 2020 Government targets need to be backed by policy action © OECD/IEA 2012
  • 15.
    Building Blocks ofa Cleaner Future Total energy savings 33 EJ Space heating 22% Other 15% Water heating Services 12% Lighting, 3% Residential Cooling and ventilation, 3% Water heating, 2% Cooking 15% Space heating, 7% Appliances Cooling and ventilation 10% Lighting 5% 6% About 70% of buildings’ potential energy savings between the 4DS and 2DS are in the residential sector © OECD/IEA 2012
  • 16.
    Building sector challengesdiffer 2.5 2.0 Billion households 1.5 1.0 0.5 0.0 2010 2020 2030 2040 2050 OECD 75% of current buildings in OECD will still be standing in 2050
  • 17.
    Building sector challengesdiffer 2.5 2.0 Billion households 1.5 1.0 0.5 0.0 2010 2020 2030 2040 2050 OECD Non OECD 75% of current buildings in OECD will still be standing in 2050
  • 18.
    Heating & Cooling:huge potential Renewable heat Integration with electricity District heating and cooling network Co-generation Surplus heat Heating and cooling account for 46% of global energy use. Their huge potential for cutting CO2 emissions is often neglected. © OECD/IEA 2012
  • 19.
    Emissions must beeliminated by 2075 A zero-carbon future looks possible but will be very challenging, even if 2050 targets are met in the 2DS. © OECD/IEA 2012
  • 20.
    Clean energy investmentpays off Additional Additional investment investment Power Power With Fuel savings Industry price effect Industry Transport Without price effect Residential Transport Commercial Undiscounted Total savings Fuel savings Fuel savings Residential 3% Biomass Commercial Coal 10% Oil Gas - 160 - 120 - 80 - 40 0 40 USD trillion Every additional dollar invested in clean energy can generate 3 dollars in return. © OECD/IEA 2012
  • 21.
    Clean energy investmentpays off Additional Additional investment investment Power With Fuel savings Industry price effect Transport Without price effect Residential Commercial Undiscounted Total savings Fuel savings 3% Biomass Coal 10% Oil Gas - 160 - 120 - 80 - 40 0 40 USD trillion Every additional dollar invested in clean energy can generate 3 dollars in return. © OECD/IEA 2012
  • 22.
    Clean energy investmentpays off Additional Additional investment investment Power With Fuel savings Industry price effect Transport Without price effect Residential Commercial Undiscounted Total savings Fuel savings 3% Biomass Coal 10% Oil Gas - 160 - 120 - 80 - 40 0 40 USD trillion Every additional dollar invested in clean energy can generate 3 dollars in return. © OECD/IEA 2012
  • 23.
    For much more,please visit www.iea.org/etp © OECD/IEA 2012