The document discusses Chi-Square tests for various scenarios: (1) testing a single population variance, (2) comparing two population variances, (3) testing independence between categorical variables, and (4) testing equality of three or more proportions. Examples are provided for each case outlining the null hypothesis, test statistic, degrees of freedom, critical value, and conclusions. A sample question is also presented comparing late flight proportions between three airlines using a chi-square test of equality of proportions.
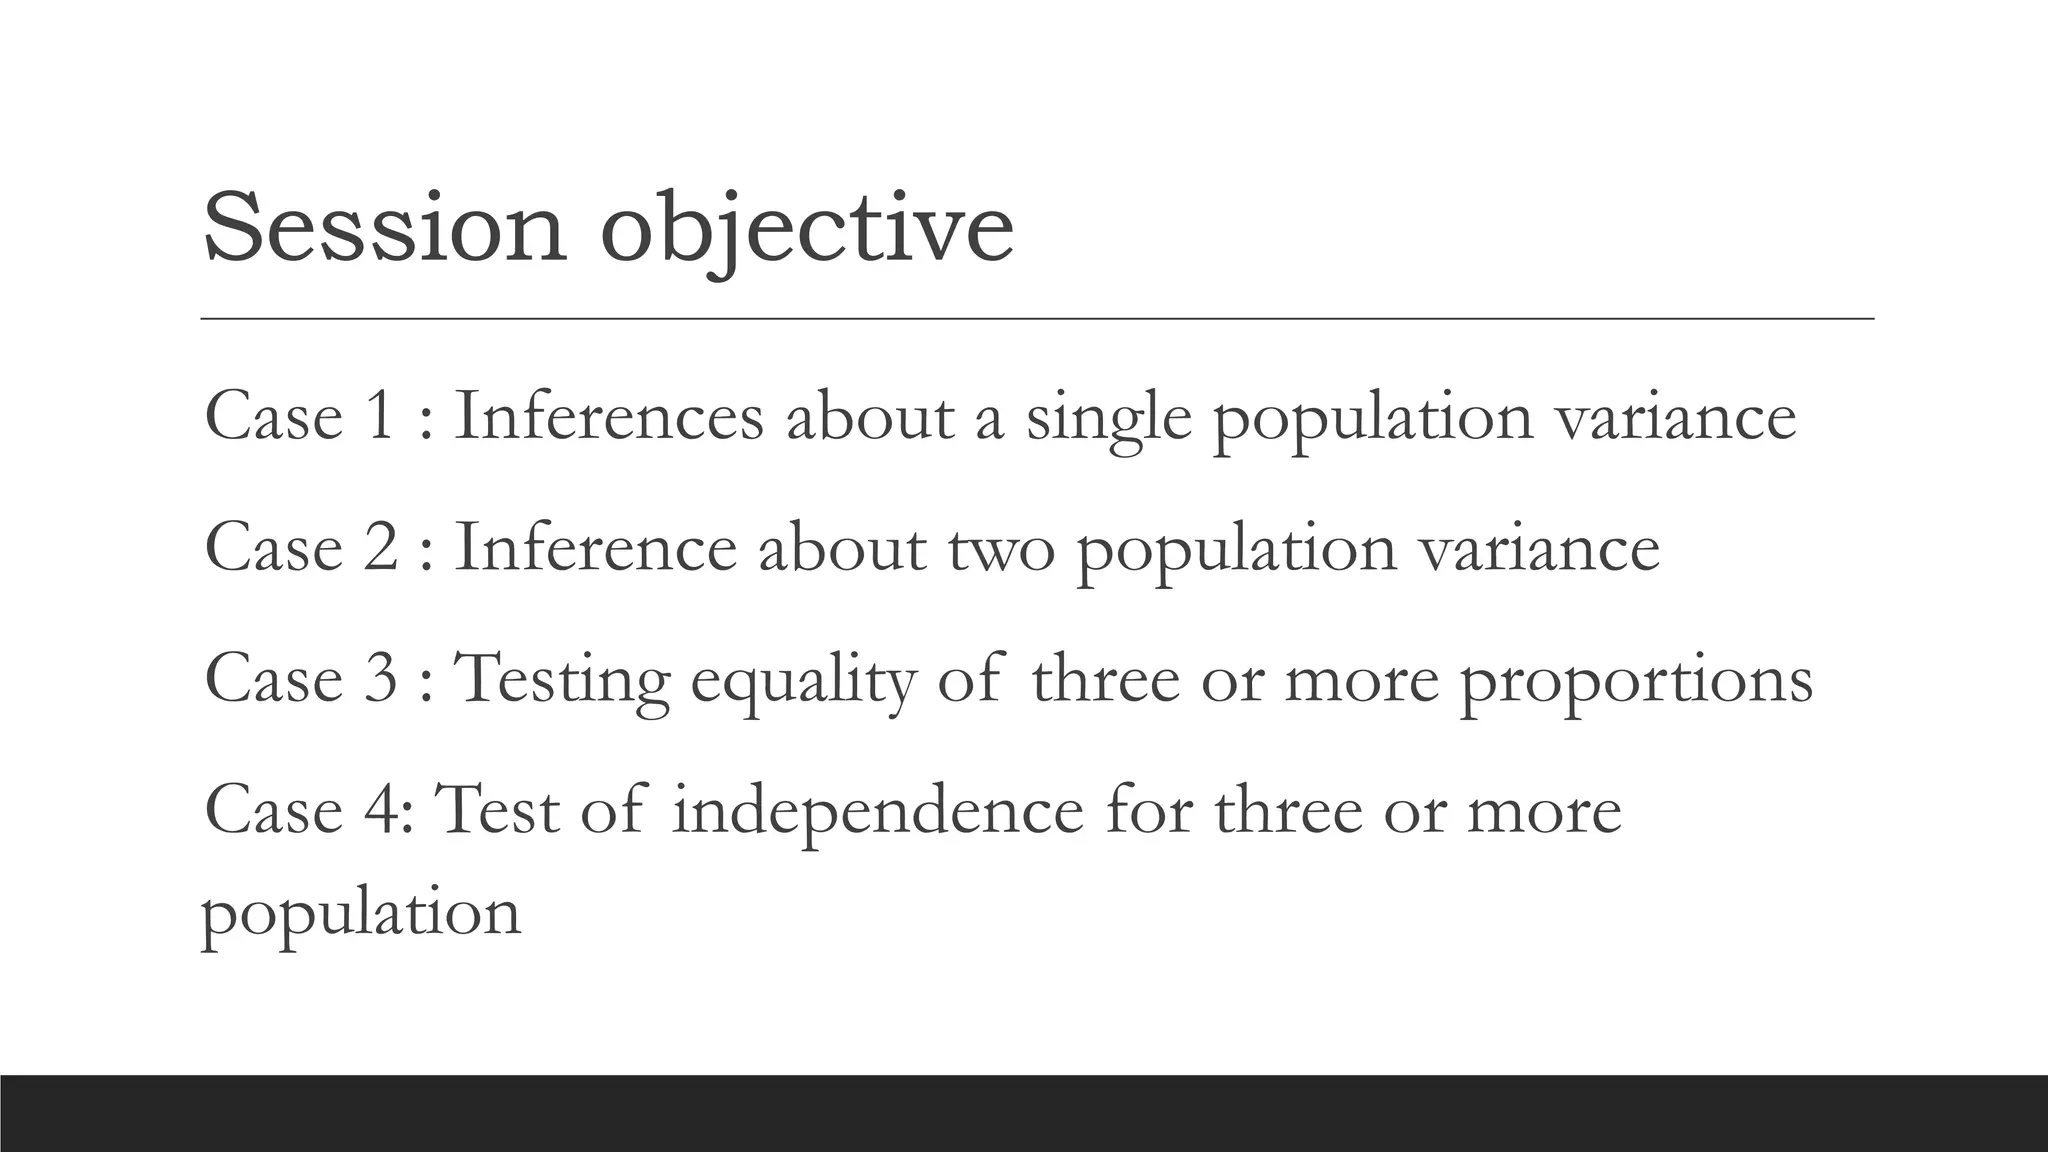
Session objective
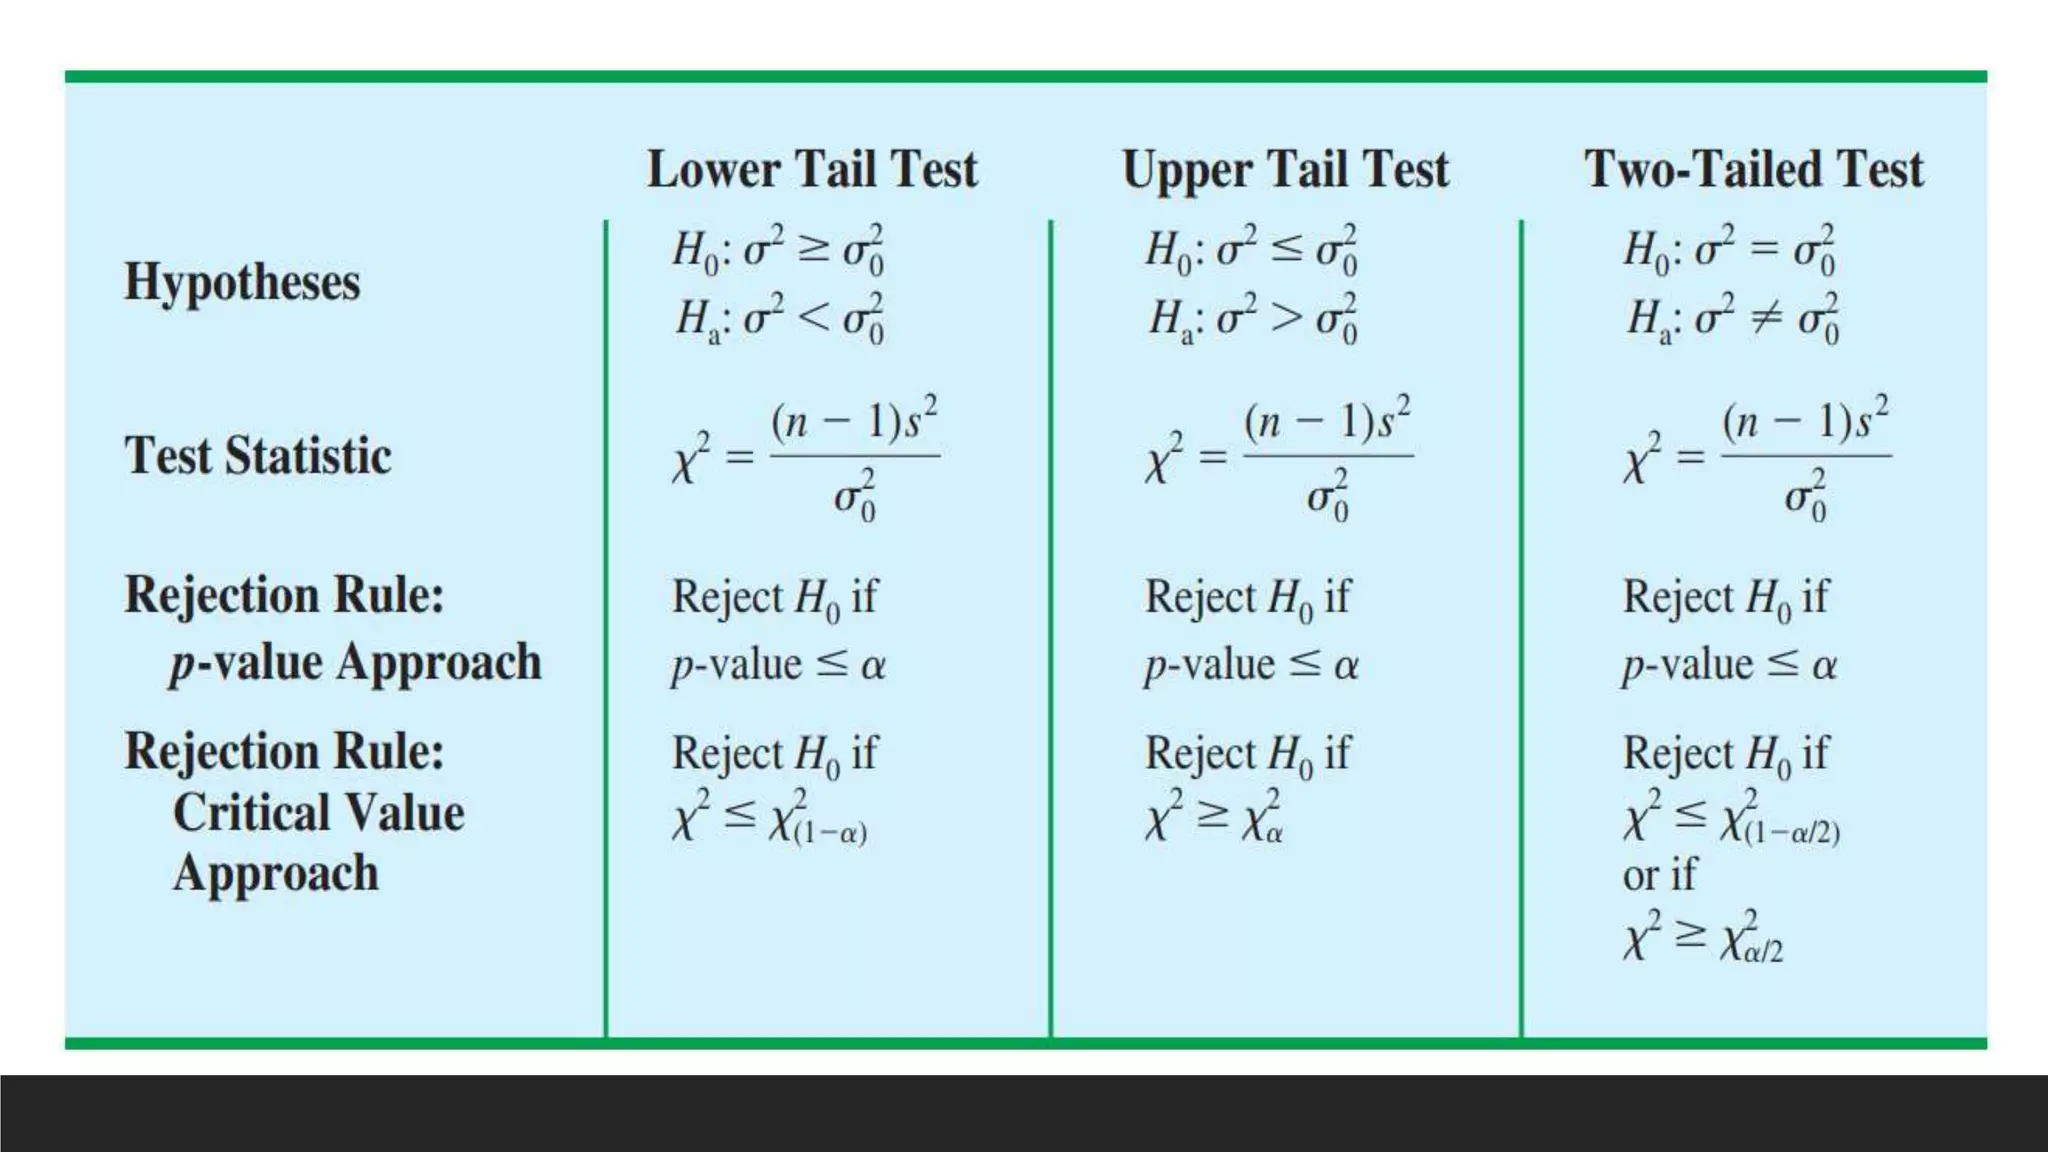
Case 1: Inferences about a single population variance
Case 2 : Inference about two population variance
Case 3 : Testing equality of three or more proportions
Case 4: Test of independence for three or more
population
3.
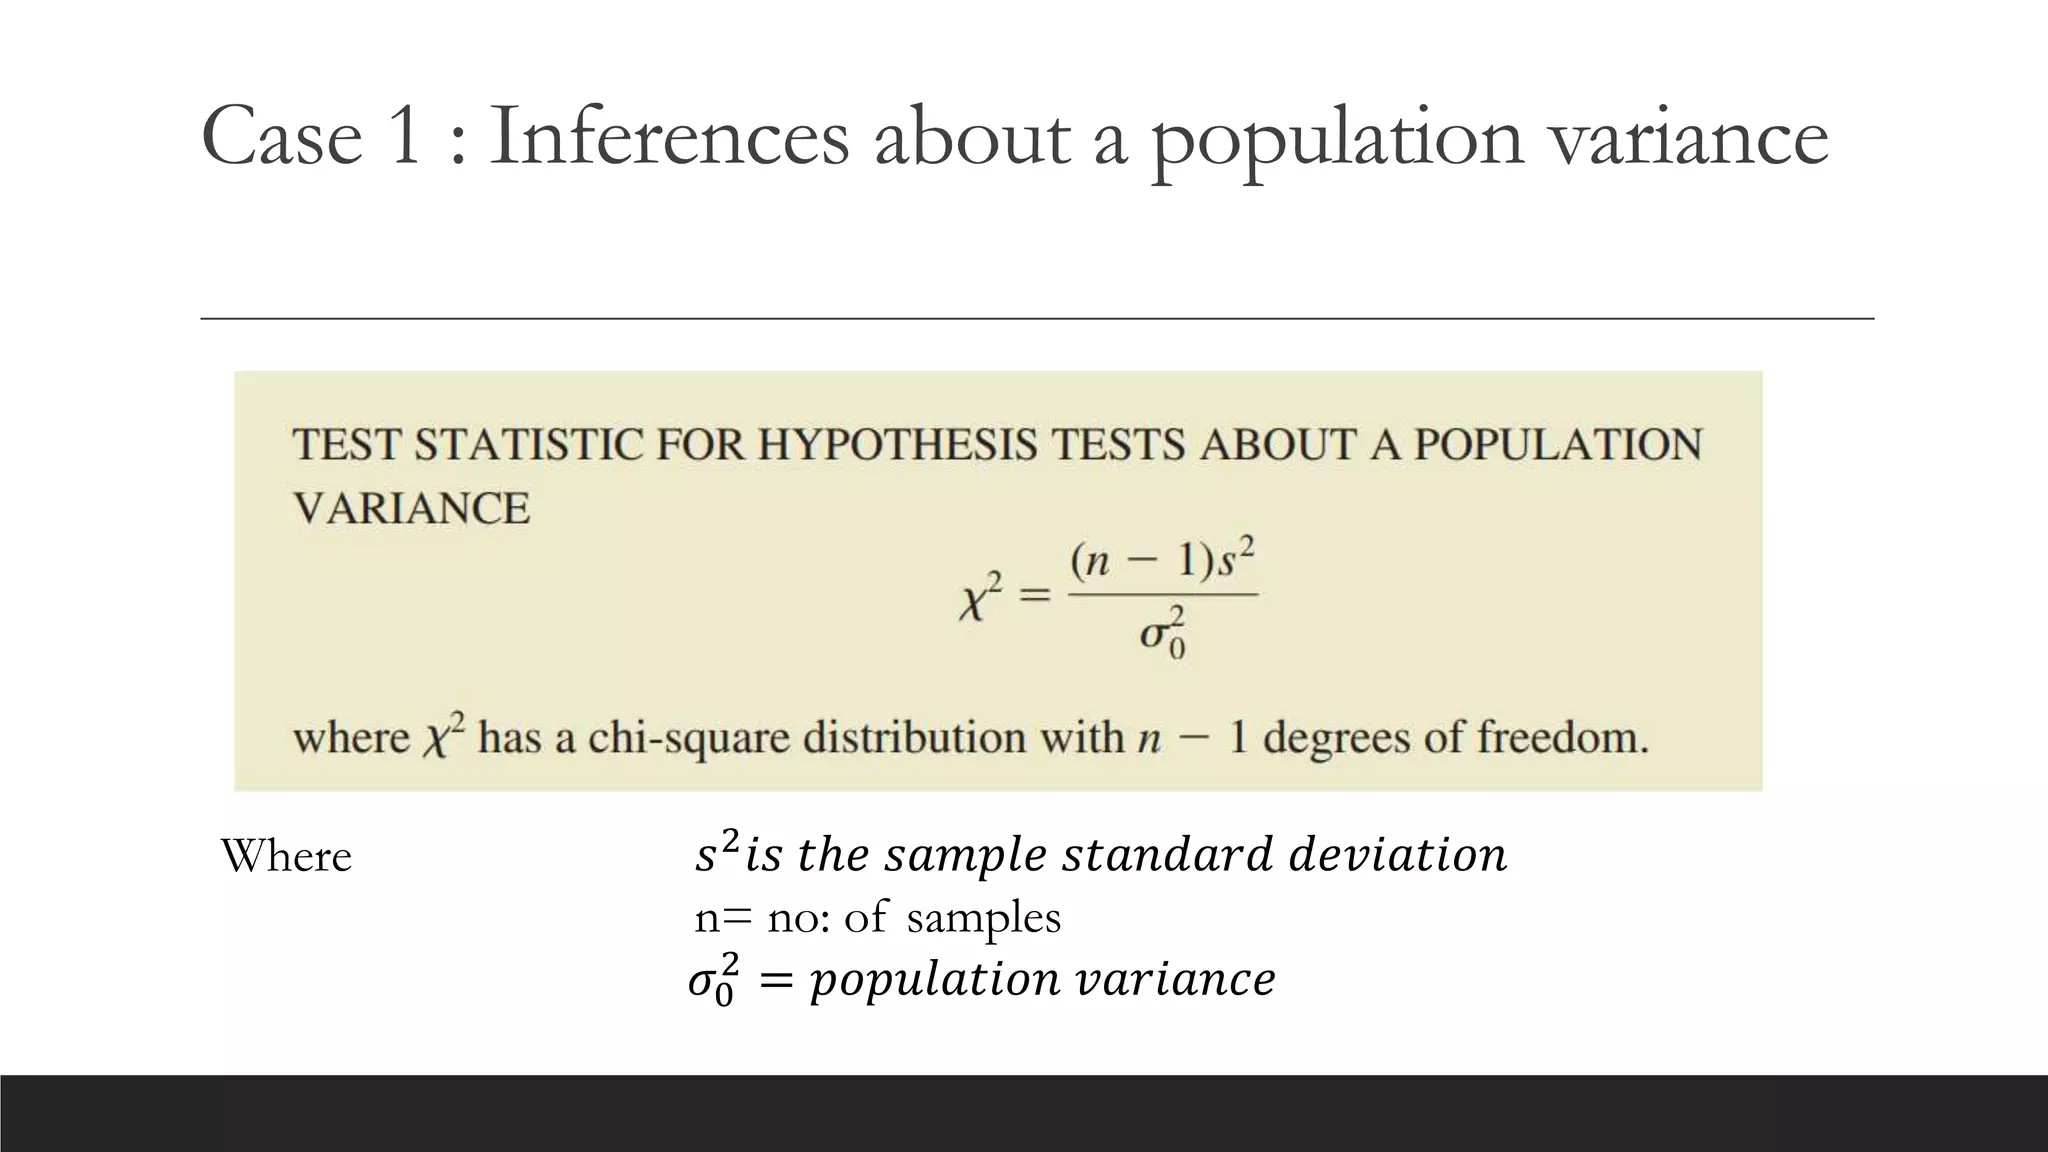
Case 1 :Inferences about a
single population variance
4.
Case 1 :Inferences about a population variance
Where 𝑠2𝑖𝑠 𝑡ℎ𝑒 𝑠𝑎𝑚𝑝𝑙𝑒 𝑠𝑡𝑎𝑛𝑑𝑎𝑟𝑑 𝑑𝑒𝑣𝑖𝑎𝑡𝑖𝑜𝑛
n= no: of samples
𝜎0
2
= 𝑝𝑜𝑝𝑢𝑙𝑎𝑡𝑖𝑜𝑛 𝑣𝑎𝑟𝑖𝑎𝑛𝑐𝑒
6.
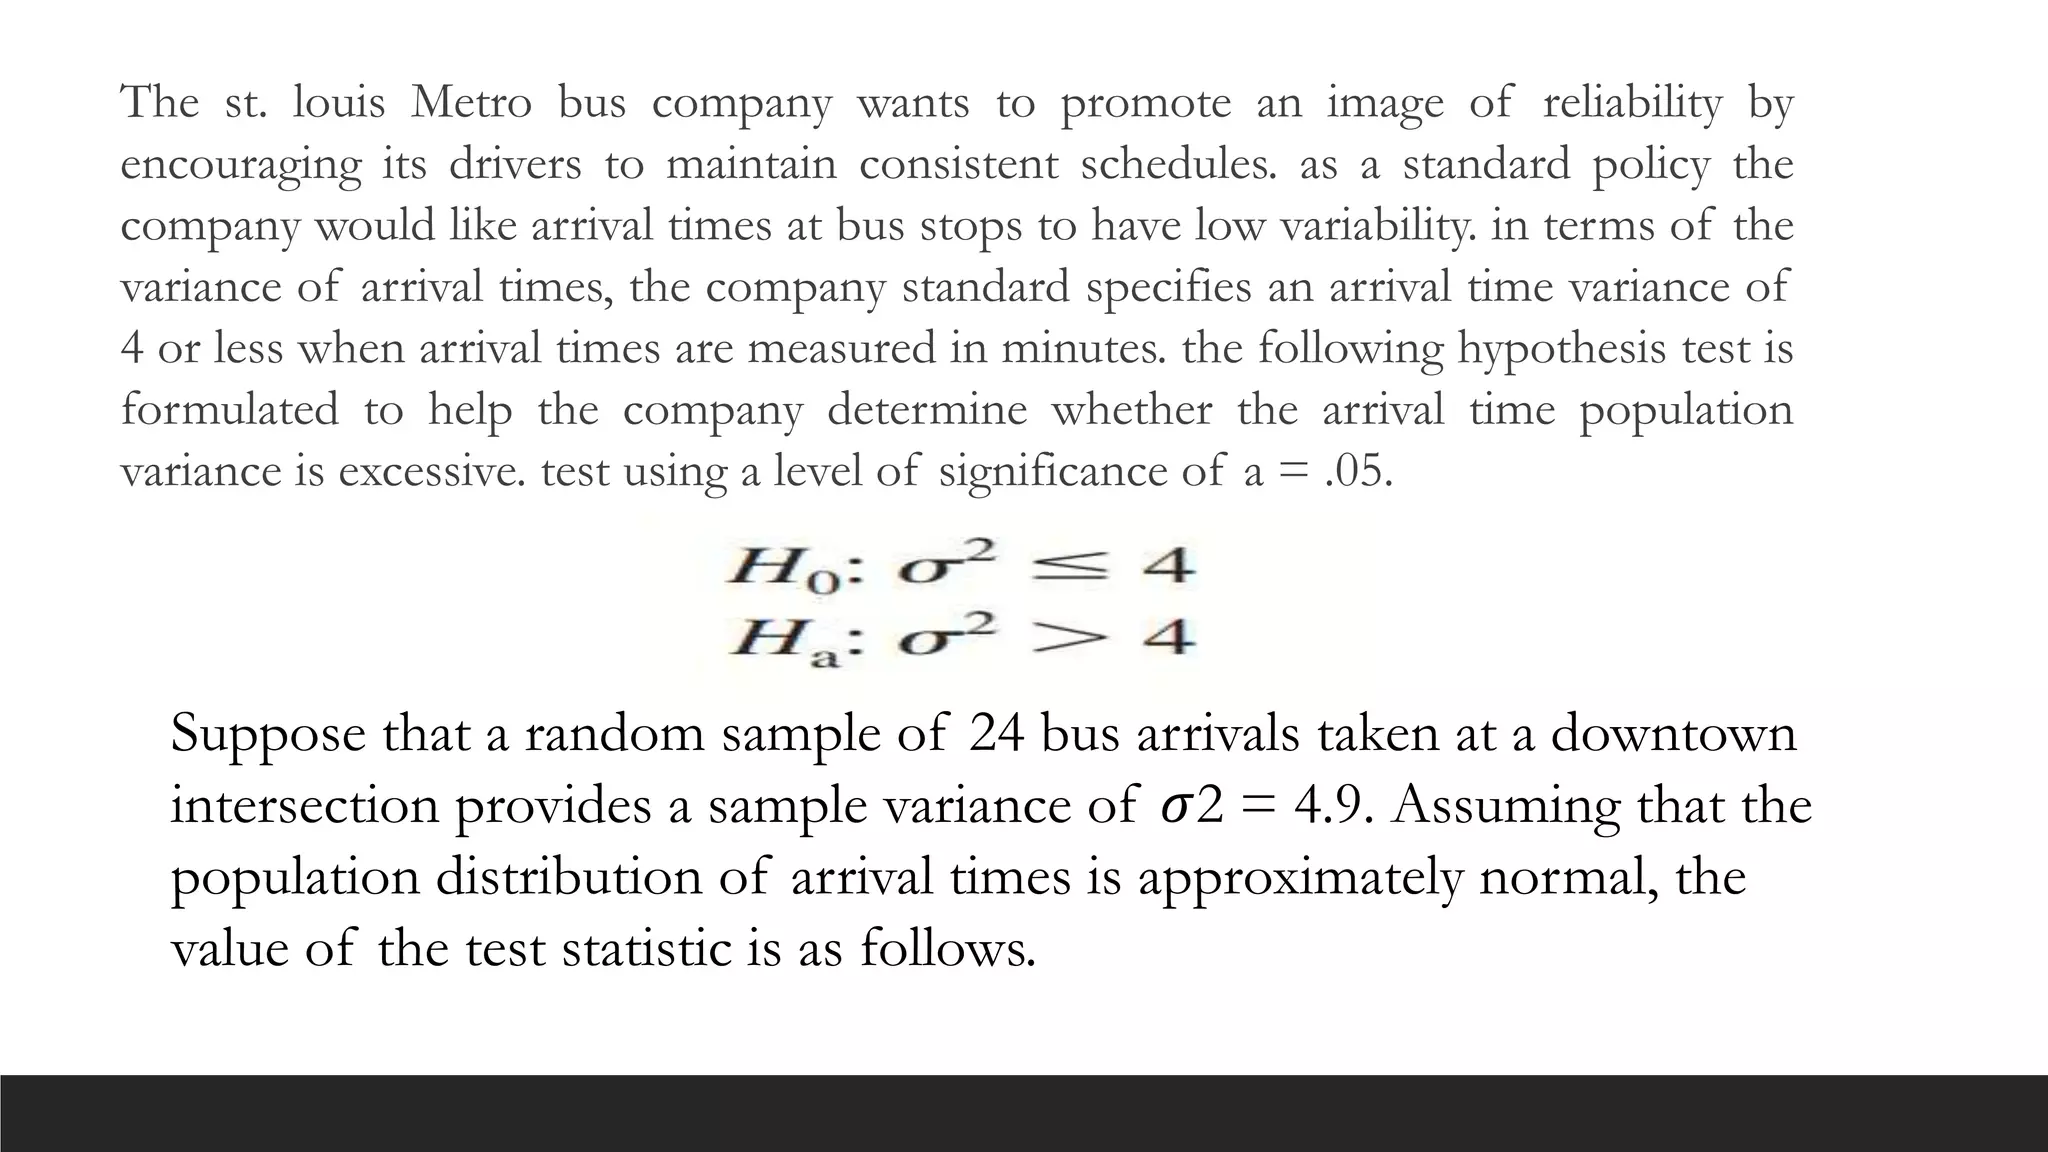
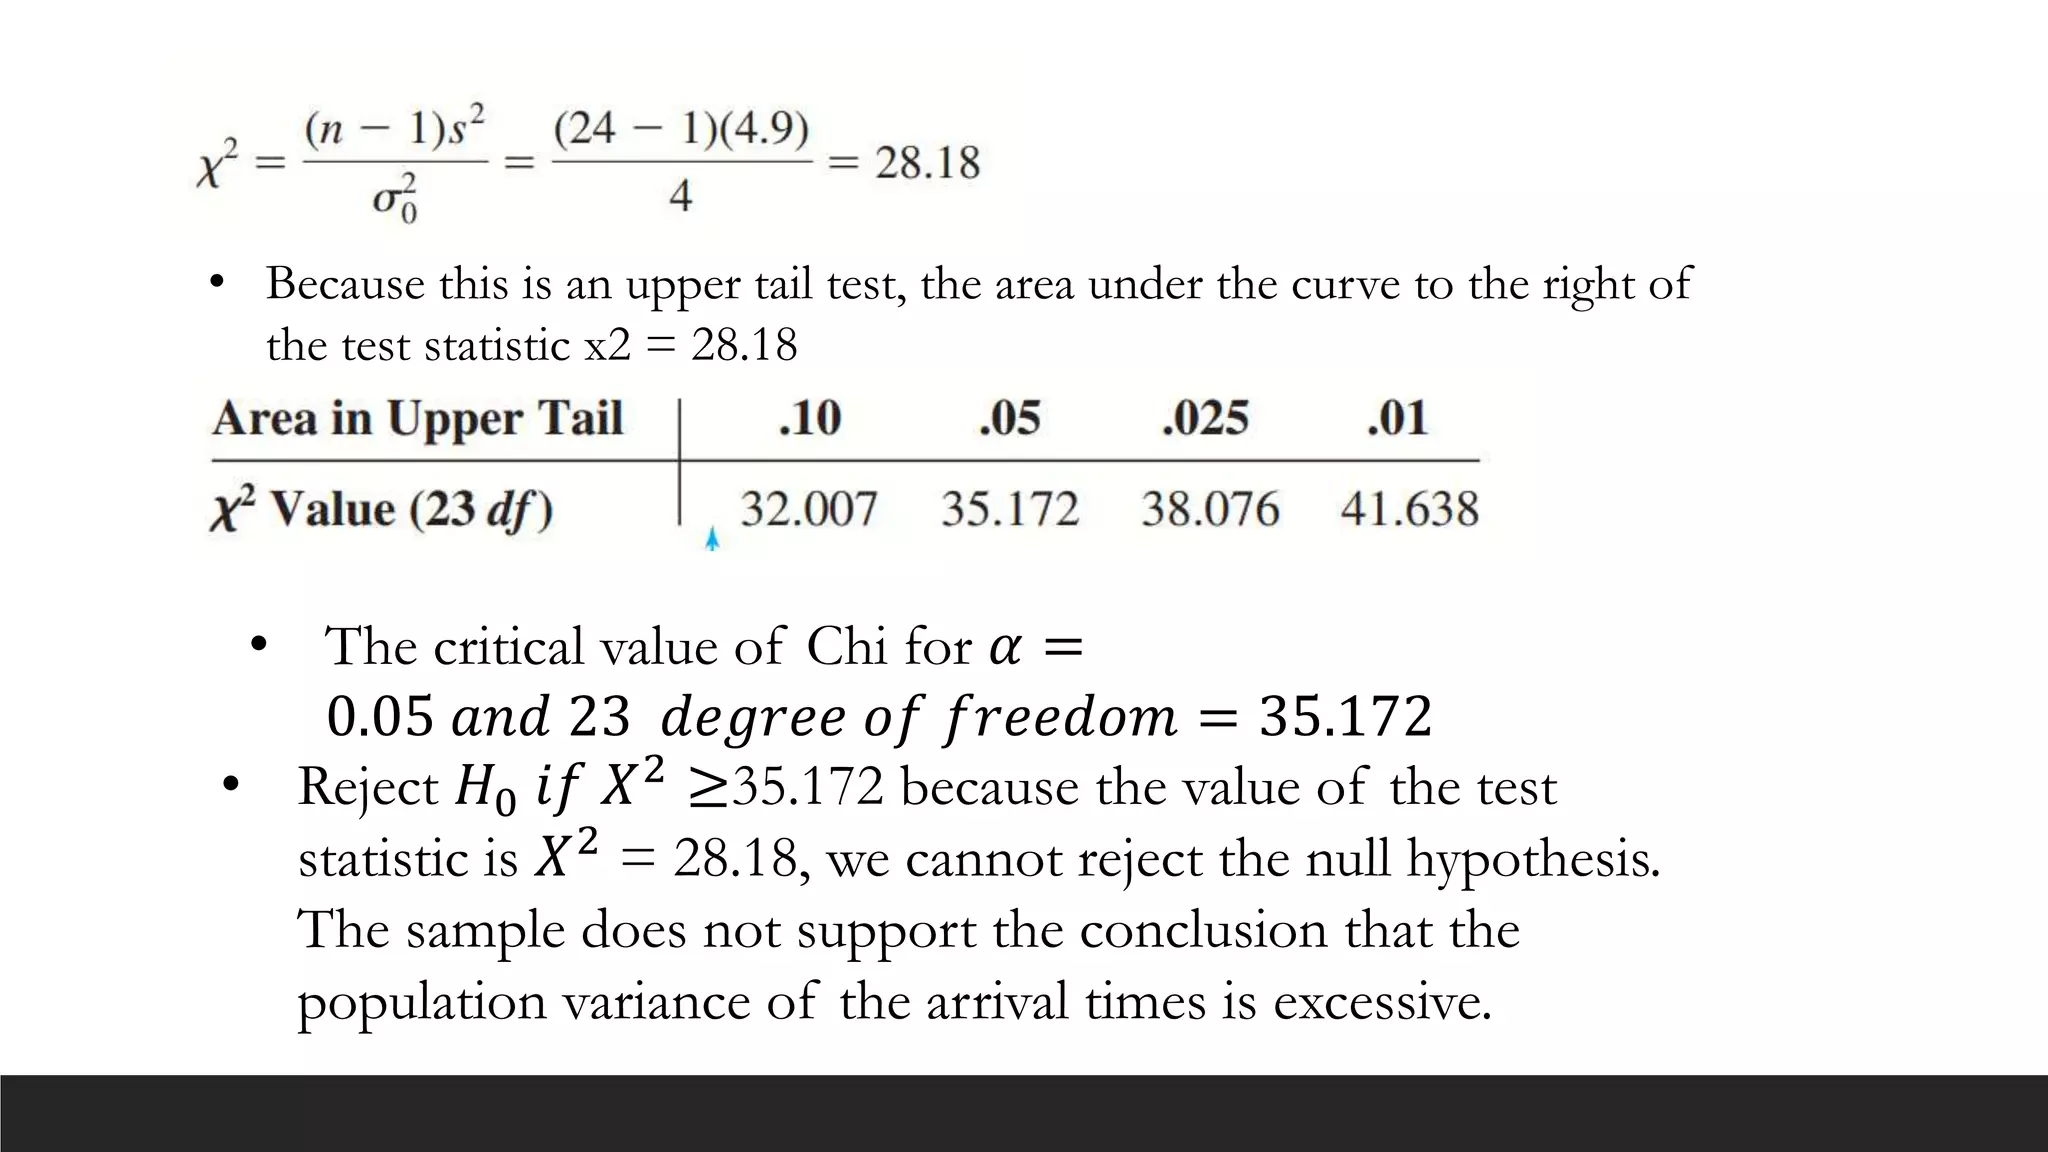
The st. louisMetro bus company wants to promote an image of reliability by
encouraging its drivers to maintain consistent schedules. as a standard policy the
company would like arrival times at bus stops to have low variability. in terms of the
variance of arrival times, the company standard specifies an arrival time variance of
4 or less when arrival times are measured in minutes. the following hypothesis test is
formulated to help the company determine whether the arrival time population
variance is excessive. test using a level of significance of a = .05.
Suppose that a random sample of 24 bus arrivals taken at a downtown
intersection provides a sample variance of 𝜎2 = 4.9. Assuming that the
population distribution of arrival times is approximately normal, the
value of the test statistic is as follows.
7.
• Because thisis an upper tail test, the area under the curve to the right of
the test statistic x2 = 28.18
• The critical value of Chi for 𝛼 =
0.05 𝑎𝑛𝑑 23 𝑑𝑒𝑔𝑟𝑒𝑒 𝑜𝑓 𝑓𝑟𝑒𝑒𝑑𝑜𝑚 = 35.172
• Reject 𝐻0 𝑖𝑓 𝑋2
≥35.172 because the value of the test
statistic is 𝑋2 = 28.18, we cannot reject the null hypothesis.
The sample does not support the conclusion that the
population variance of the arrival times is excessive.
8.
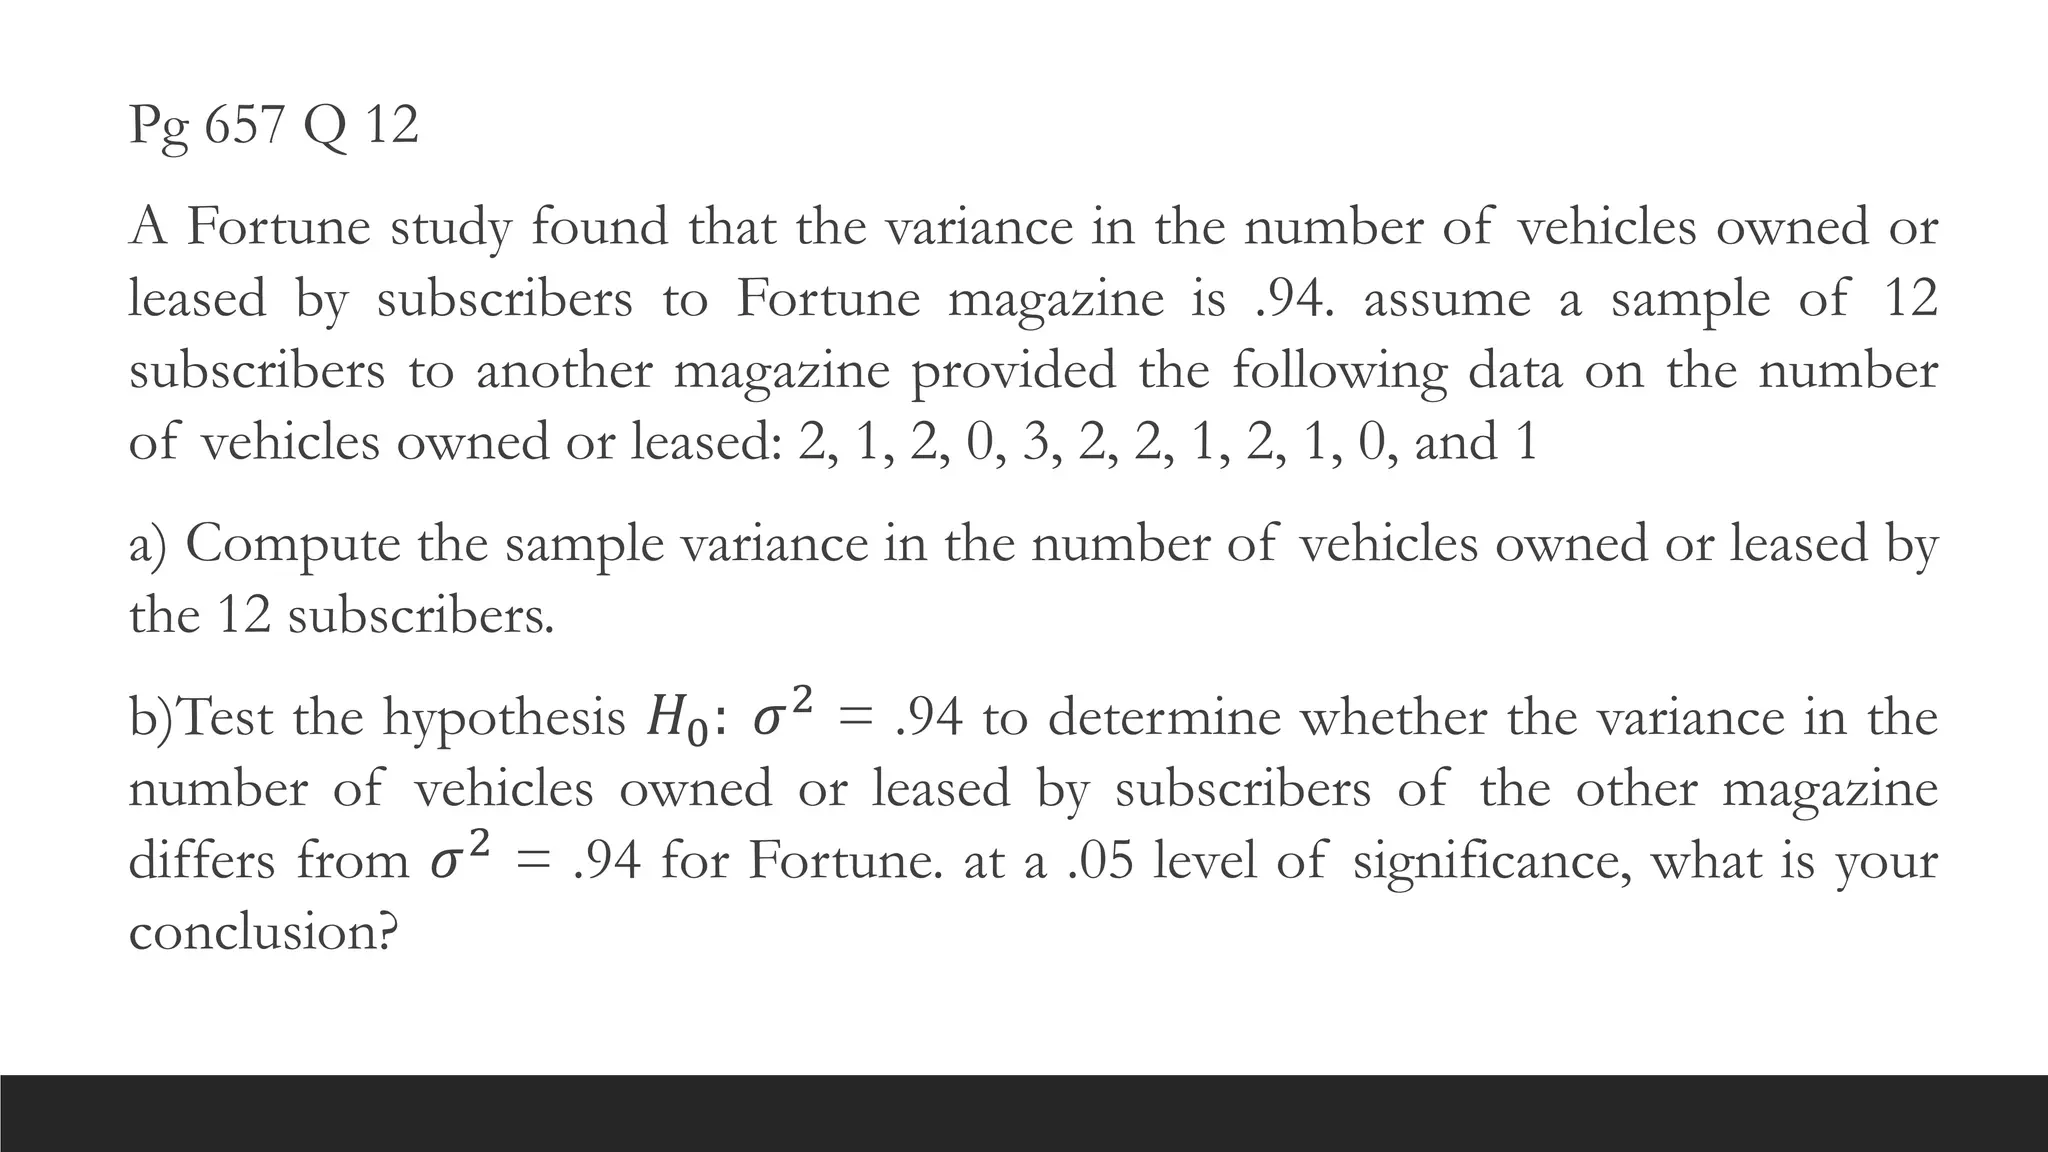
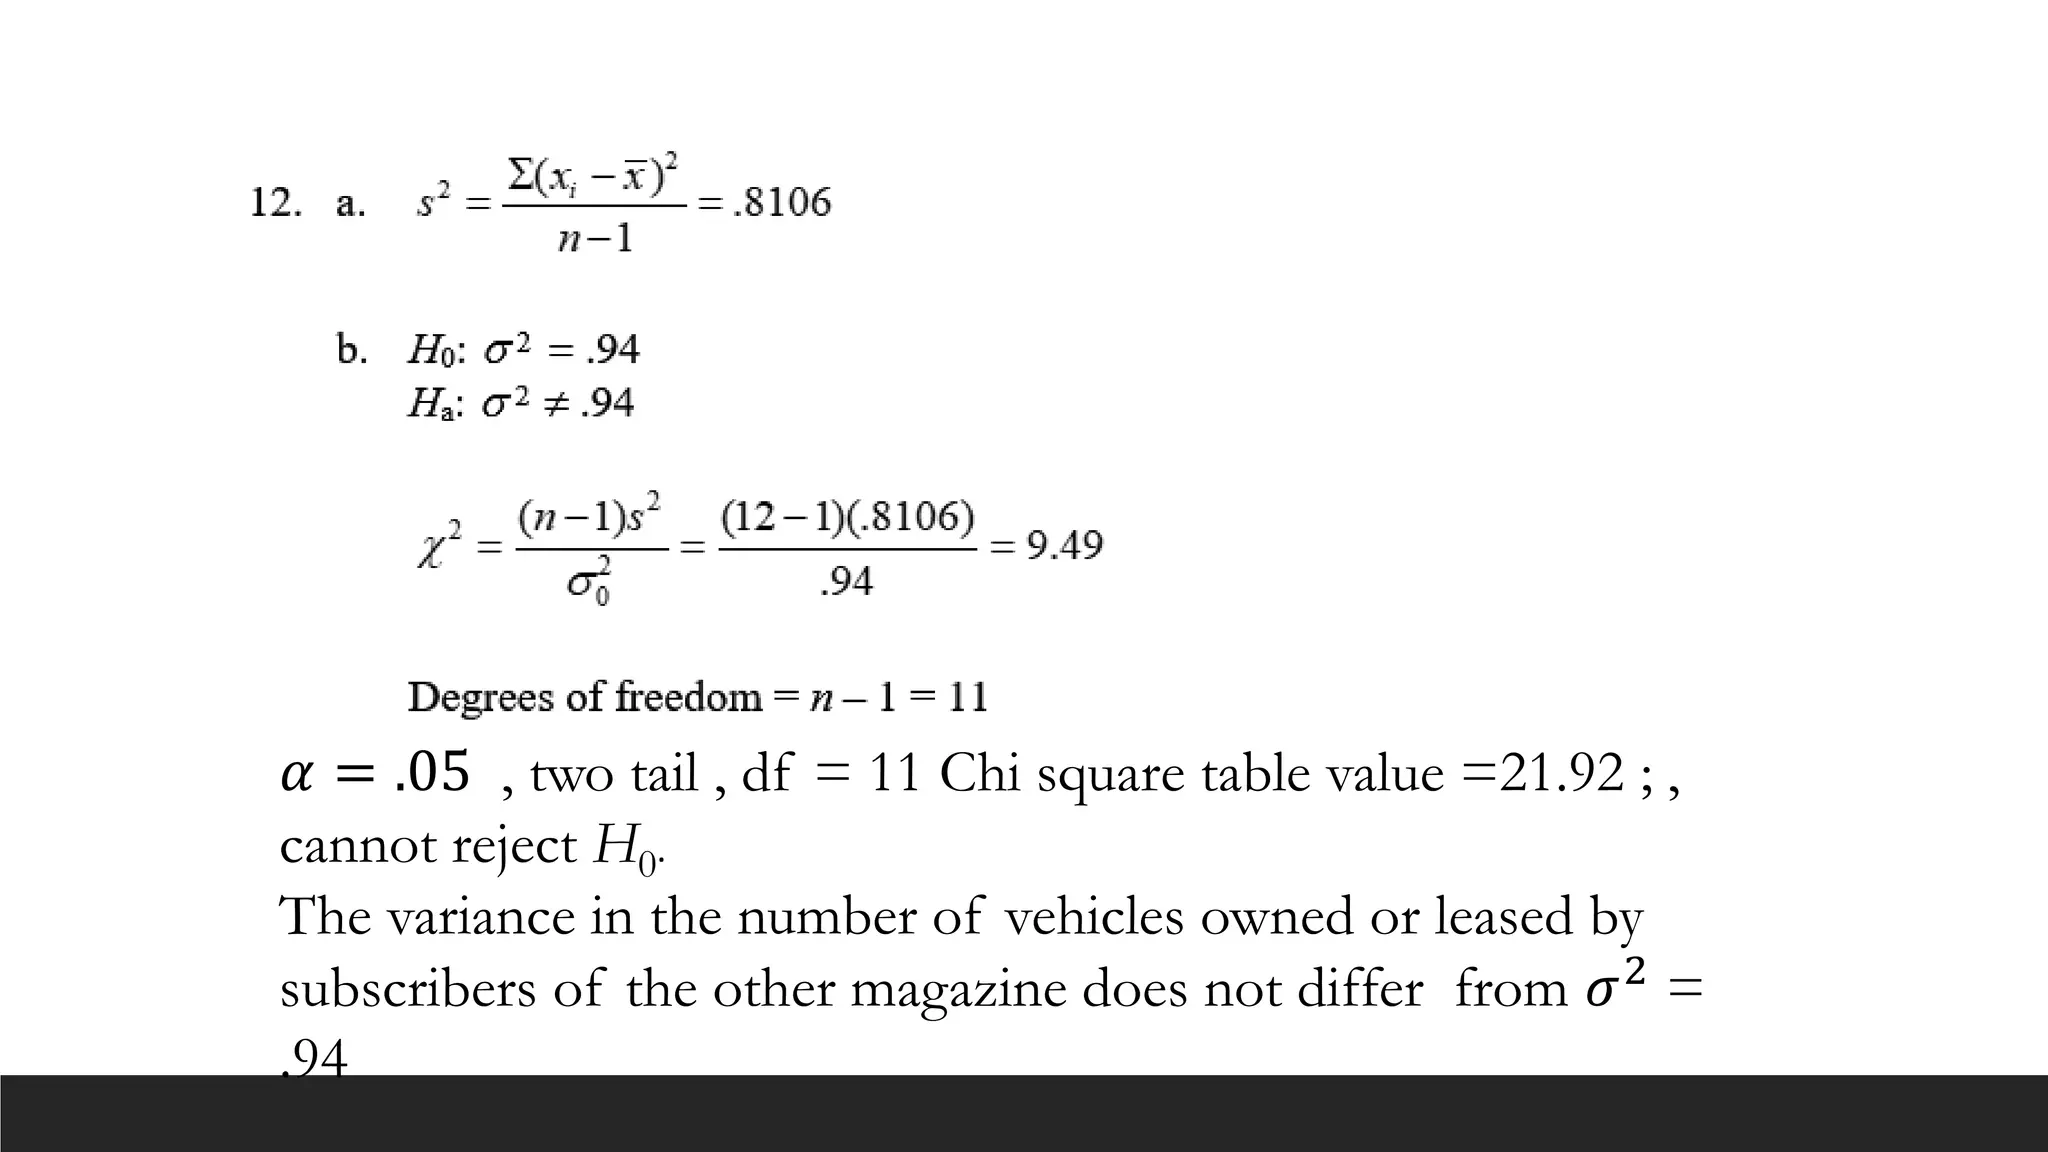
Pg 657 Q12
A Fortune study found that the variance in the number of vehicles owned or
leased by subscribers to Fortune magazine is .94. assume a sample of 12
subscribers to another magazine provided the following data on the number
of vehicles owned or leased: 2, 1, 2, 0, 3, 2, 2, 1, 2, 1, 0, and 1
a) Compute the sample variance in the number of vehicles owned or leased by
the 12 subscribers.
b)Test the hypothesis 𝐻0: 𝜎2 = .94 to determine whether the variance in the
number of vehicles owned or leased by subscribers of the other magazine
differs from 𝜎2 = .94 for Fortune. at a .05 level of significance, what is your
conclusion?
9.
𝛼 = .05, two tail , df = 11 Chi square table value =21.92 ; ,
cannot reject H0.
The variance in the number of vehicles owned or leased by
subscribers of the other magazine does not differ from 𝜎2
=
.94
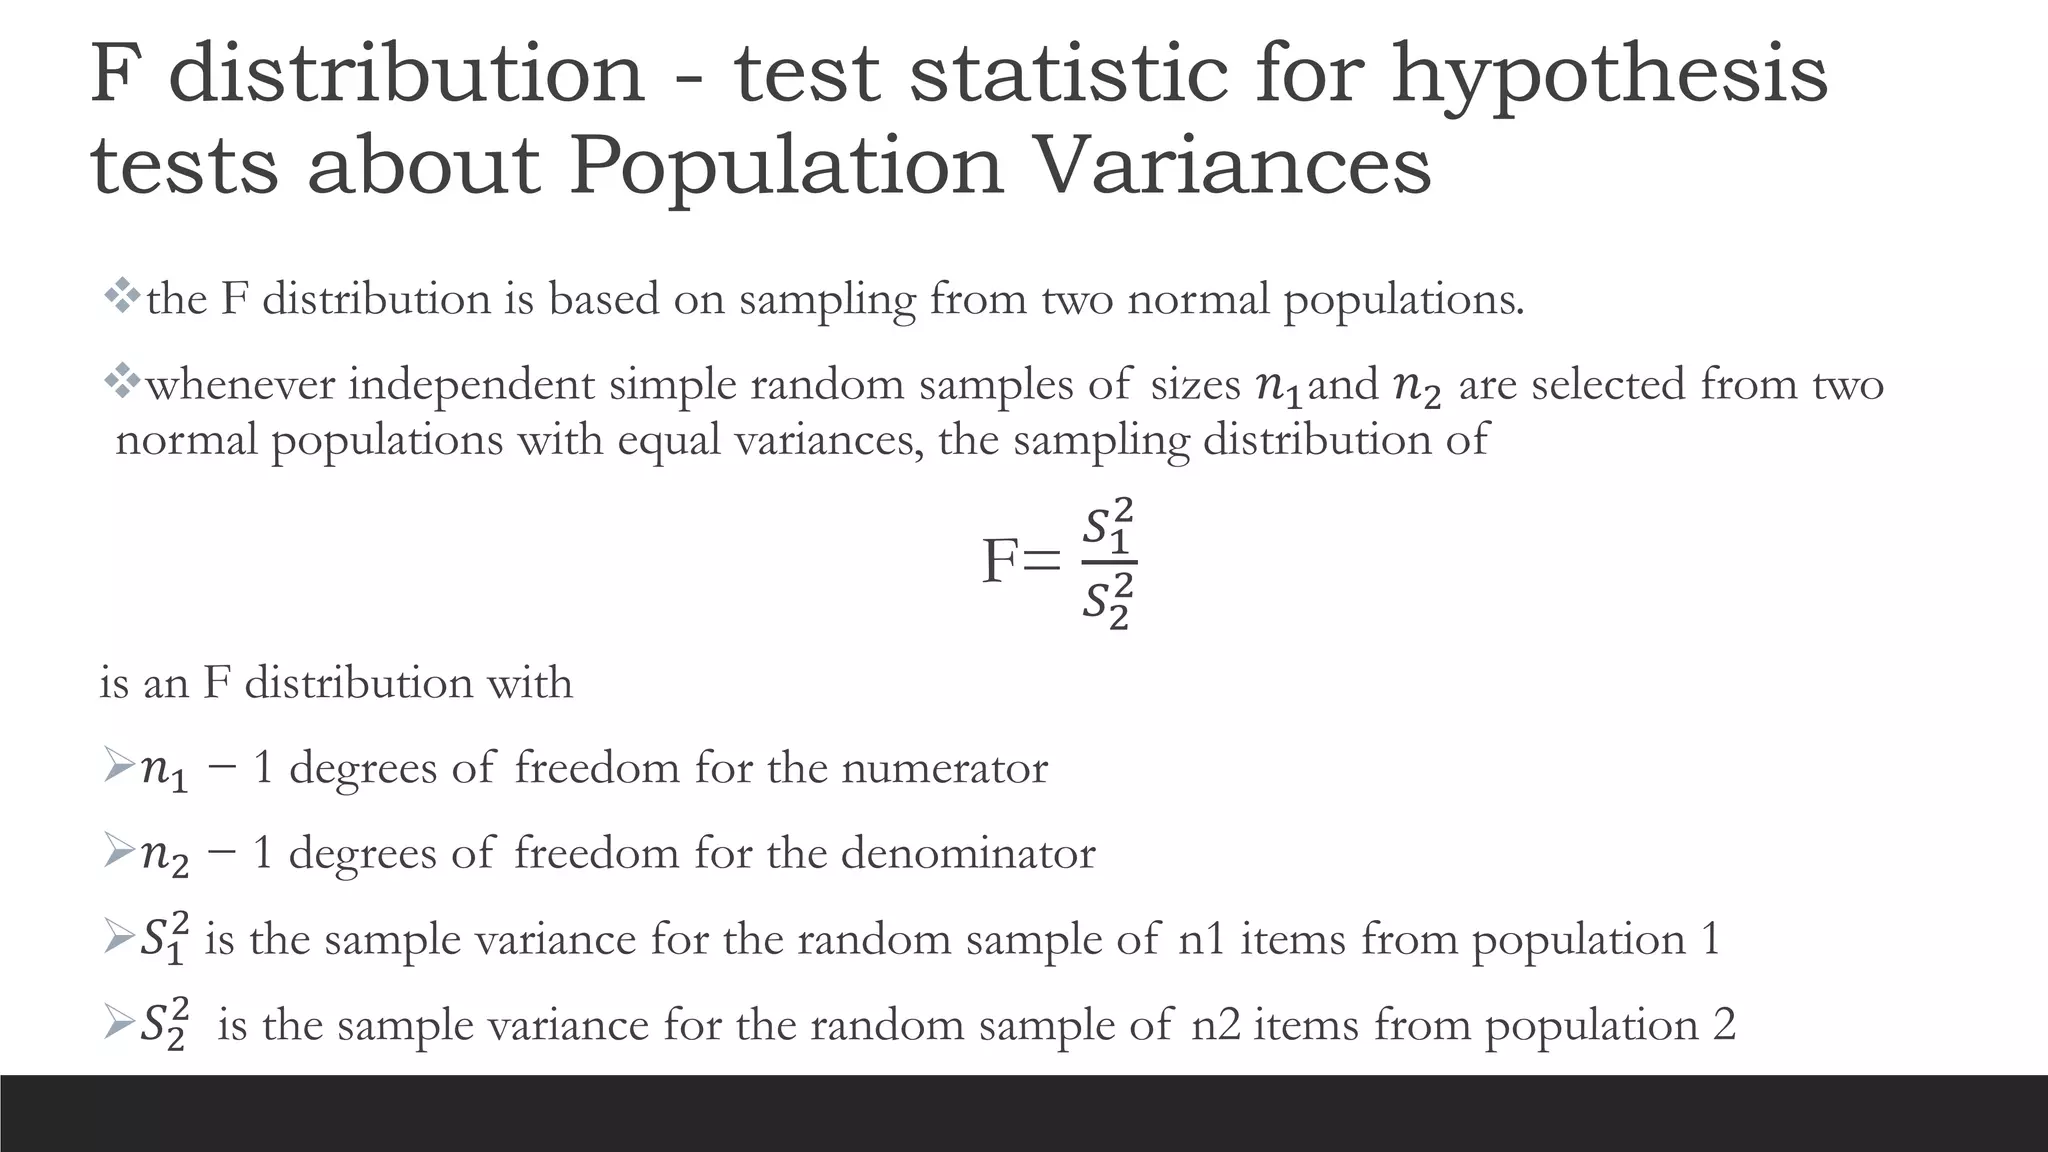
F distribution -test statistic for hypothesis
tests about Population Variances
the F distribution is based on sampling from two normal populations.
whenever independent simple random samples of sizes 𝑛1and 𝑛2 are selected from two
normal populations with equal variances, the sampling distribution of
F=
𝑆1
2
𝑆2
2
is an F distribution with
𝑛1 − 1 degrees of freedom for the numerator
𝑛2 − 1 degrees of freedom for the denominator
𝑆1
2
is the sample variance for the random sample of n1 items from population 1
𝑆2
2
is the sample variance for the random sample of n2 items from population 2
12.
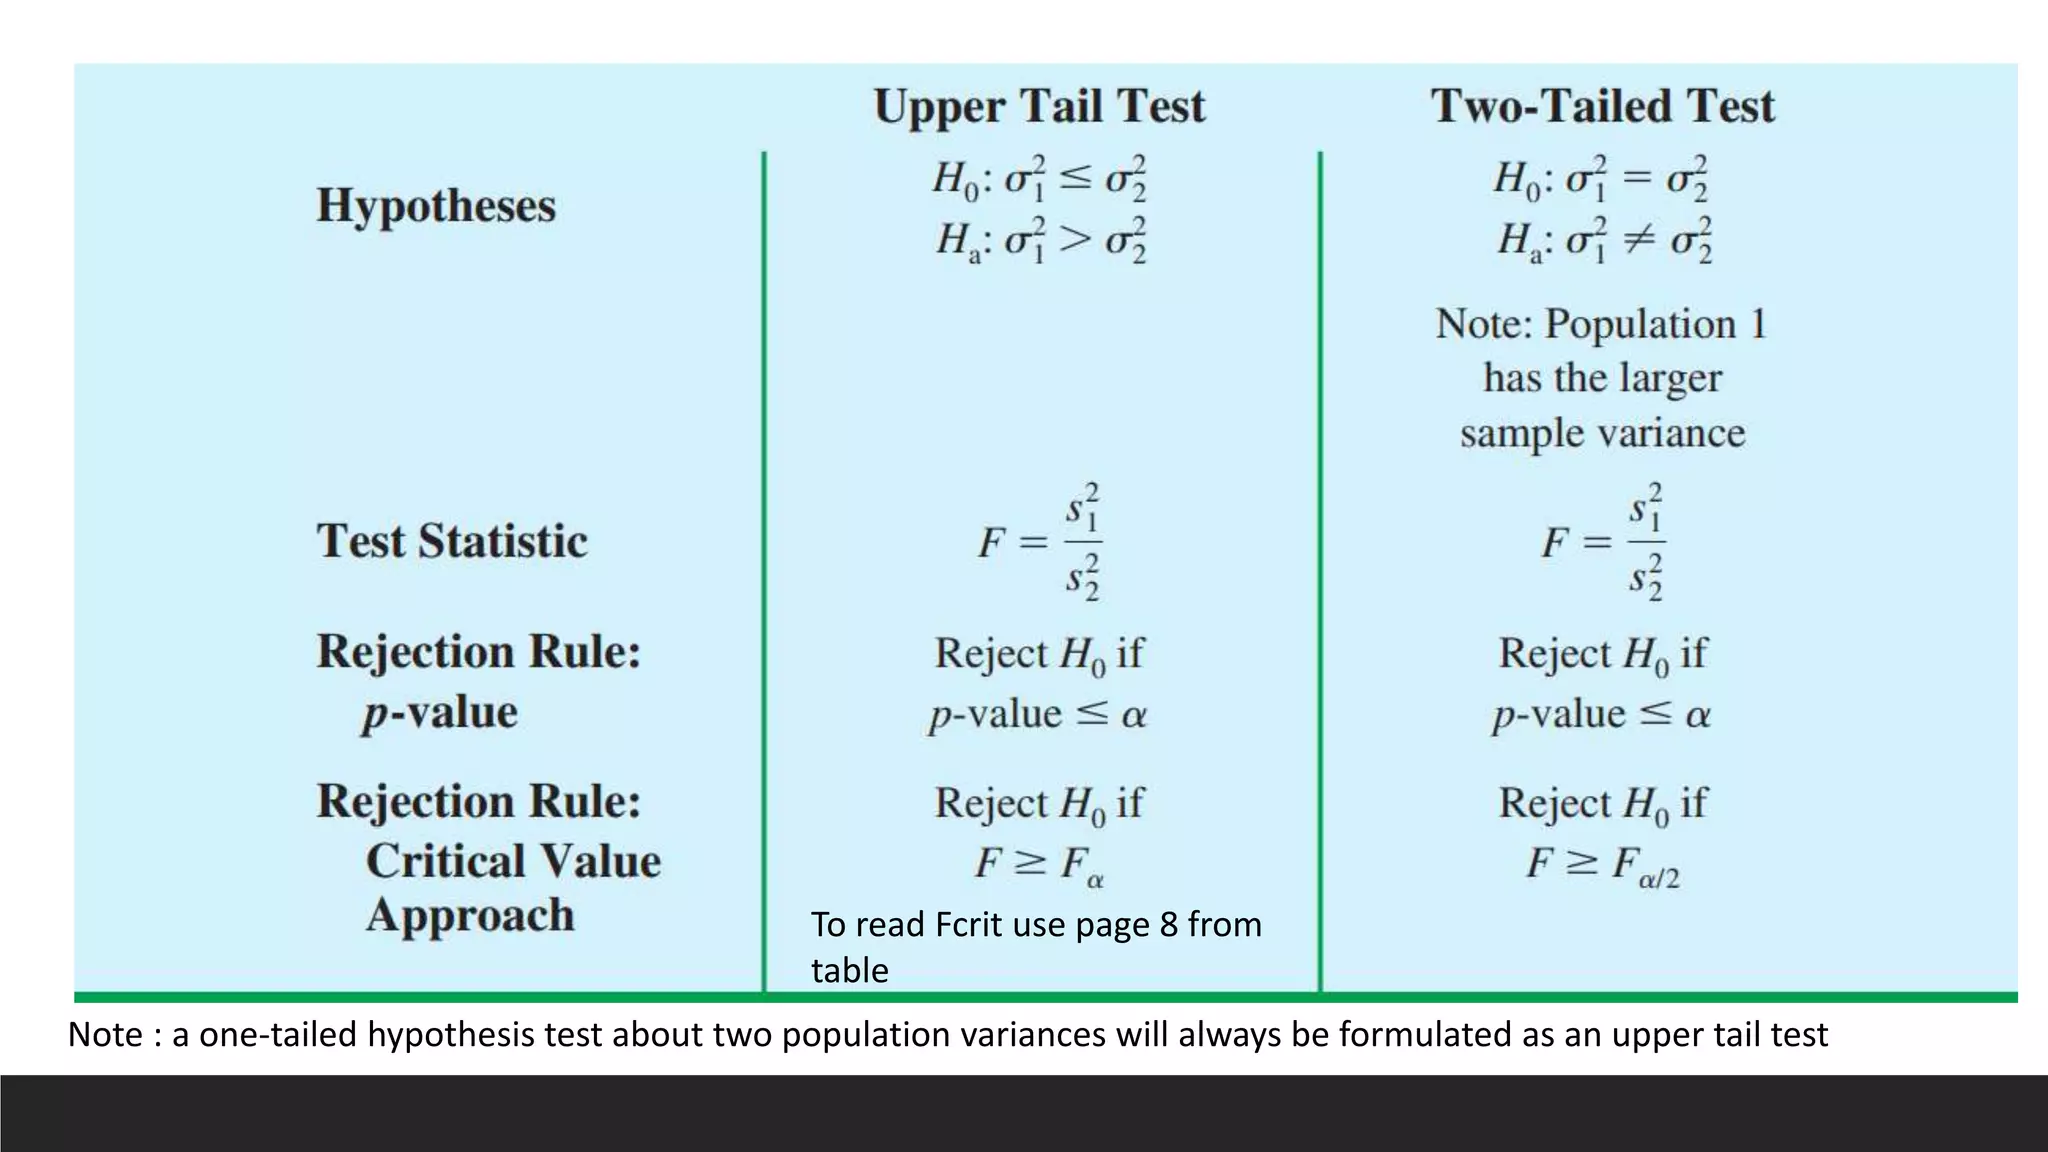
Note : aone-tailed hypothesis test about two population variances will always be formulated as an upper tail test
To read Fcrit use page 8 from
table
13.
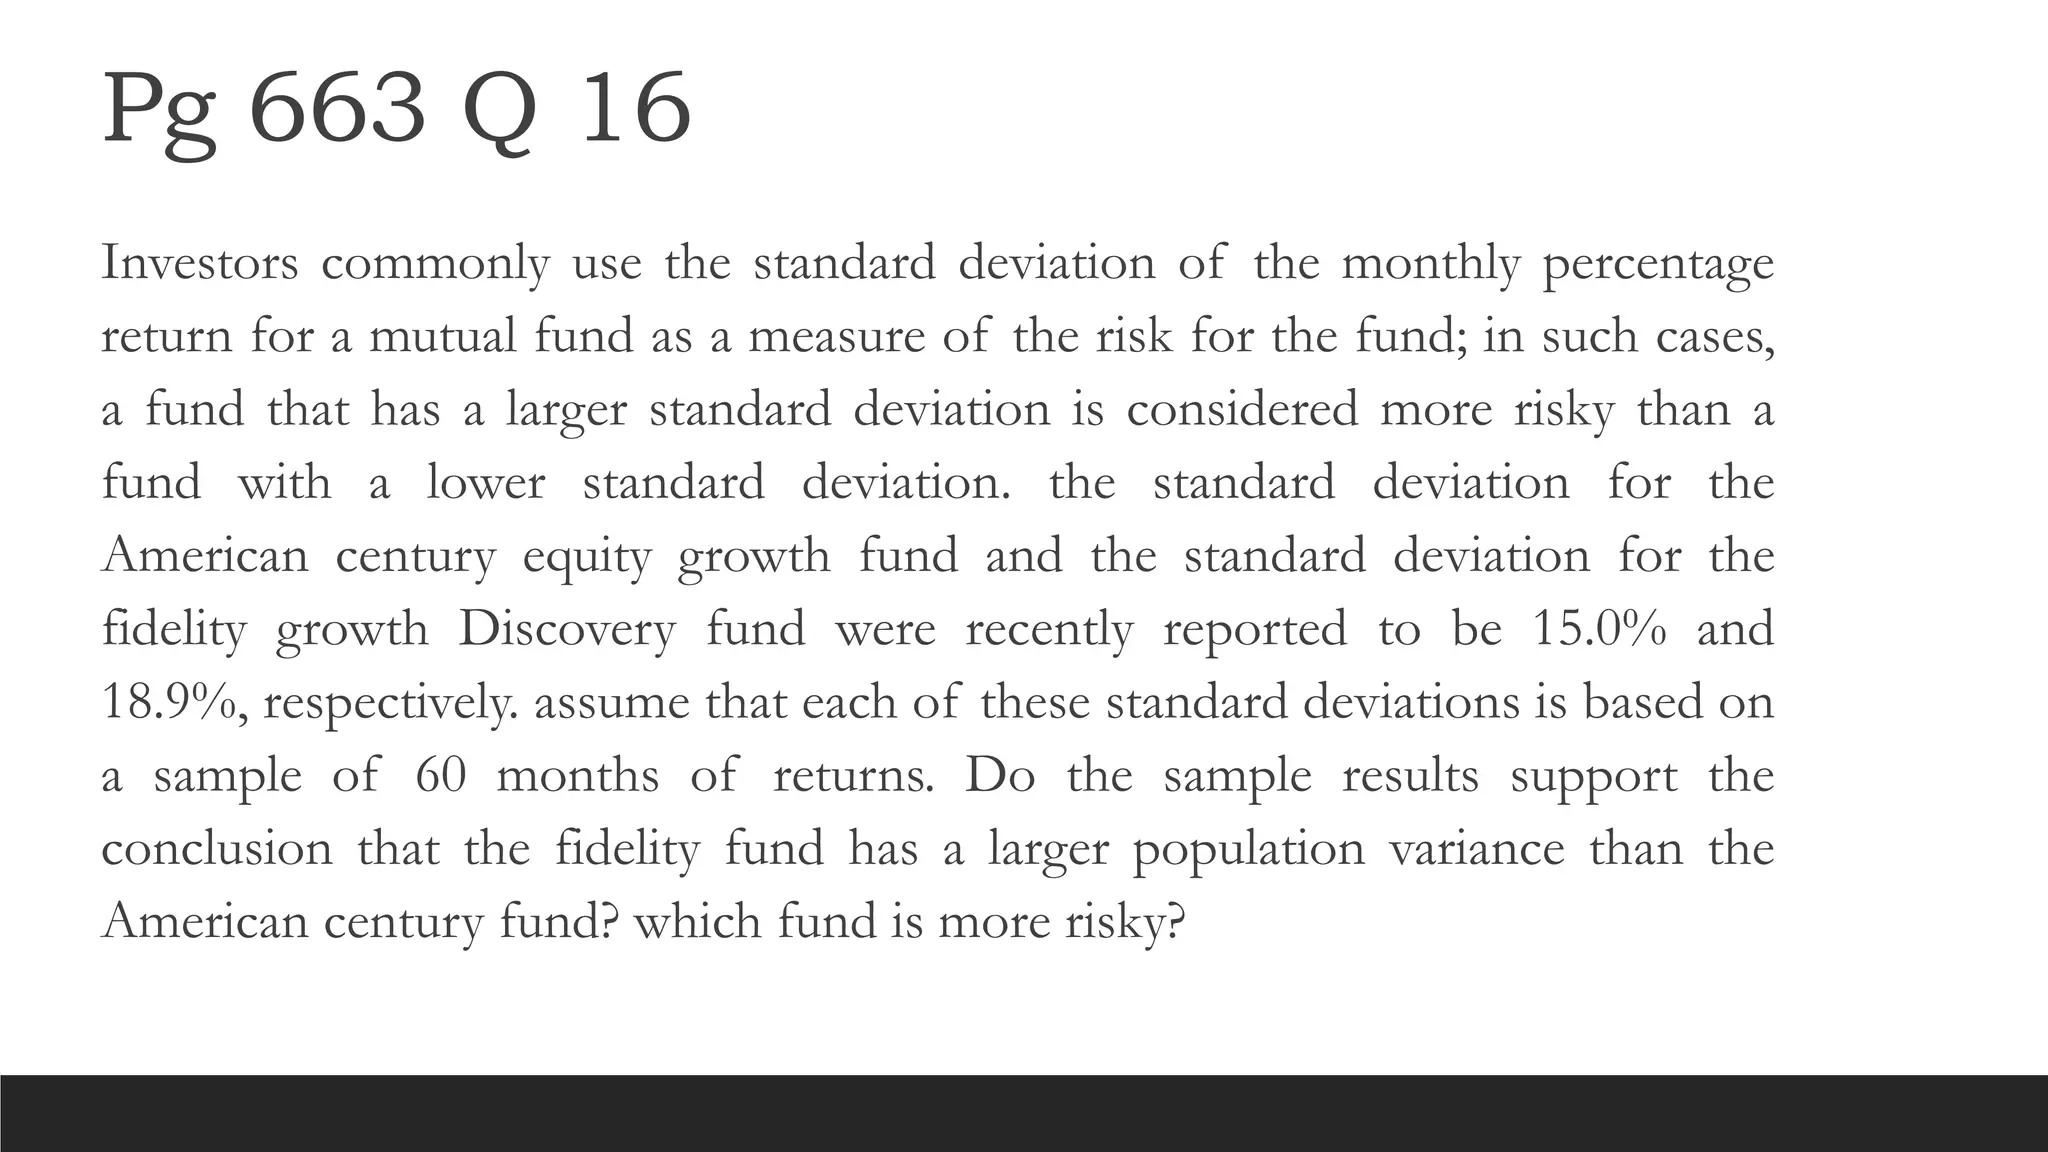
Pg 663 Q16
Investors commonly use the standard deviation of the monthly percentage
return for a mutual fund as a measure of the risk for the fund; in such cases,
a fund that has a larger standard deviation is considered more risky than a
fund with a lower standard deviation. the standard deviation for the
American century equity growth fund and the standard deviation for the
fidelity growth Discovery fund were recently reported to be 15.0% and
18.9%, respectively. assume that each of these standard deviations is based on
a sample of 60 months of returns. Do the sample results support the
conclusion that the fidelity fund has a larger population variance than the
American century fund? which fund is more risky?
14.
F crit fordf =59 for 𝑛1 and 𝑛2 and 𝛼 = .05 𝑖𝑠 1.40 or 1.39
reject H0. We conclude that the Fidelity fund has a greater variance than the American Century
fund.
15.
Q 17 Pg663
Most individuals are aware of the fact that the average annual repair cost for an
automobile depends on the age of the automobile. a researcher is interested in
finding out whether the variance of the annual repair costs also increases with the
age of the automobile. a sample of 26 automobiles 4 years old showed a sample
standard deviation for annual repair costs of $170 and a sample of 25 automobiles
2 years old showed a sample standard deviation for annual repair costs of $100.
a. State the null and alternative versions of the research hypothesis that the
variance in annual repair costs is larger for the older automobiles
b. At 𝛼= .01 level of significance, what is your conclusion? what is the p-value?
Discuss the reasonableness of your findings
16.
F crit fordf pf 25 and 24 and 𝛼 = .01 is 2.58
reject H0. Conclude that 4 year old automobiles have a larger variance in
annual repair costs compared to 2 year old automobiles. This is
expected due to the fact that older automobiles are more likely to have
some more expensive repairs which lead to greater variance in the
annual repair costs.
17.
Case 4: Testof
independence
for three or more population
18.
Chi – square– Test of
independence
One sample from a population and record the observations for two or more
categorical variables.
Summarize the data by counting the number of responses for each combination
of a category for variable 1 and a category for variable 2.
The null hypothesis for this test is that the two categorical variables are
independent.
Example
H0: Variable represented in row is independent of variable represented in
column
H1: Variable represented in row is dependent on variable represented in column
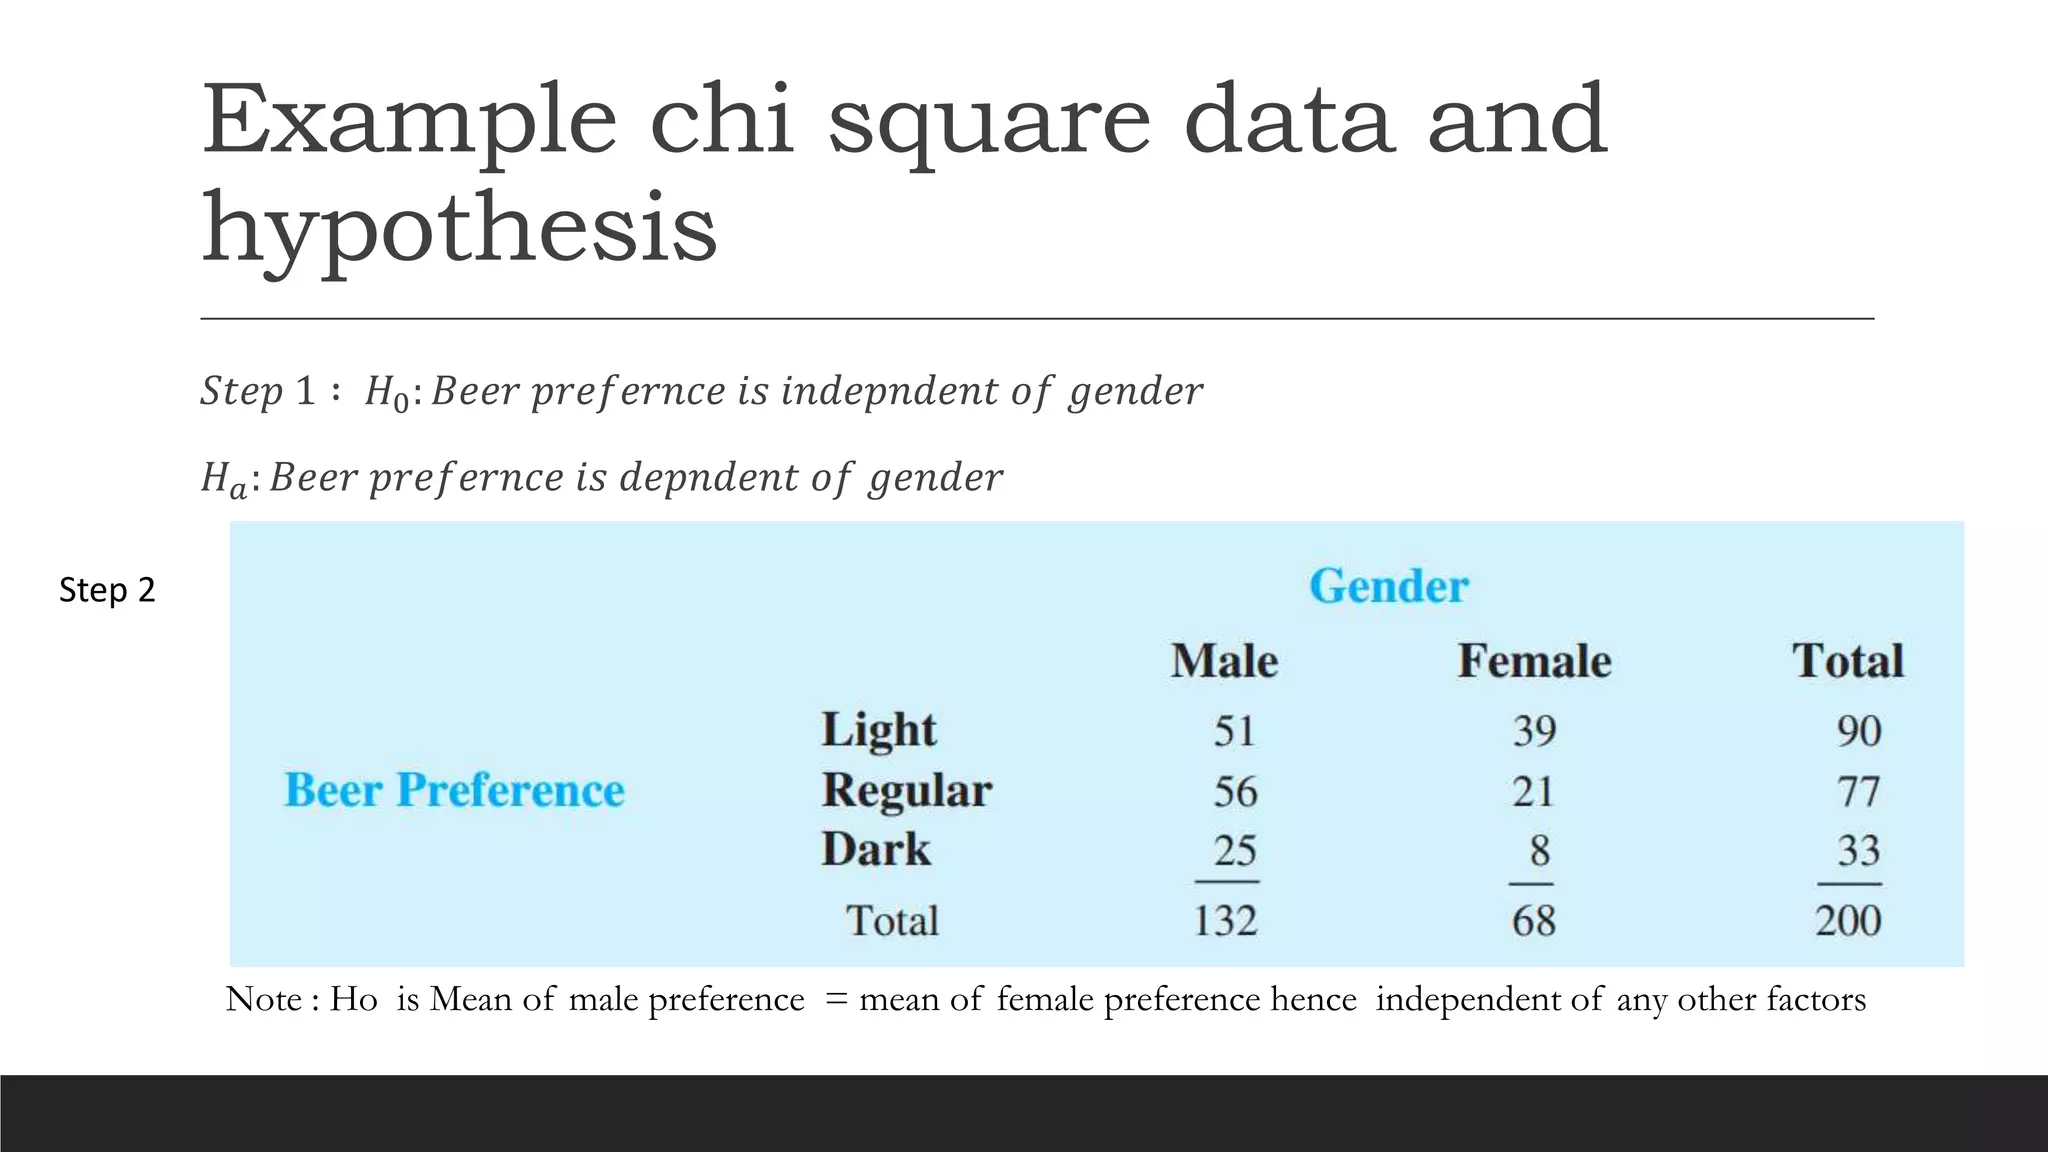
Example chi squaredata and
hypothesis
𝑆𝑡𝑒𝑝 1 ∶ 𝐻0: 𝐵𝑒𝑒𝑟 𝑝𝑟𝑒𝑓𝑒𝑟𝑛𝑐𝑒 𝑖𝑠 𝑖𝑛𝑑𝑒𝑝𝑛𝑑𝑒𝑛𝑡 𝑜𝑓 𝑔𝑒𝑛𝑑𝑒𝑟
𝐻𝑎: 𝐵𝑒𝑒𝑟 𝑝𝑟𝑒𝑓𝑒𝑟𝑛𝑐𝑒 𝑖𝑠 𝑑𝑒𝑝𝑛𝑑𝑒𝑛𝑡 𝑜𝑓 𝑔𝑒𝑛𝑑𝑒𝑟
Note : Ho is Mean of male preference = mean of female preference hence independent of any other factors
Step 2
21.
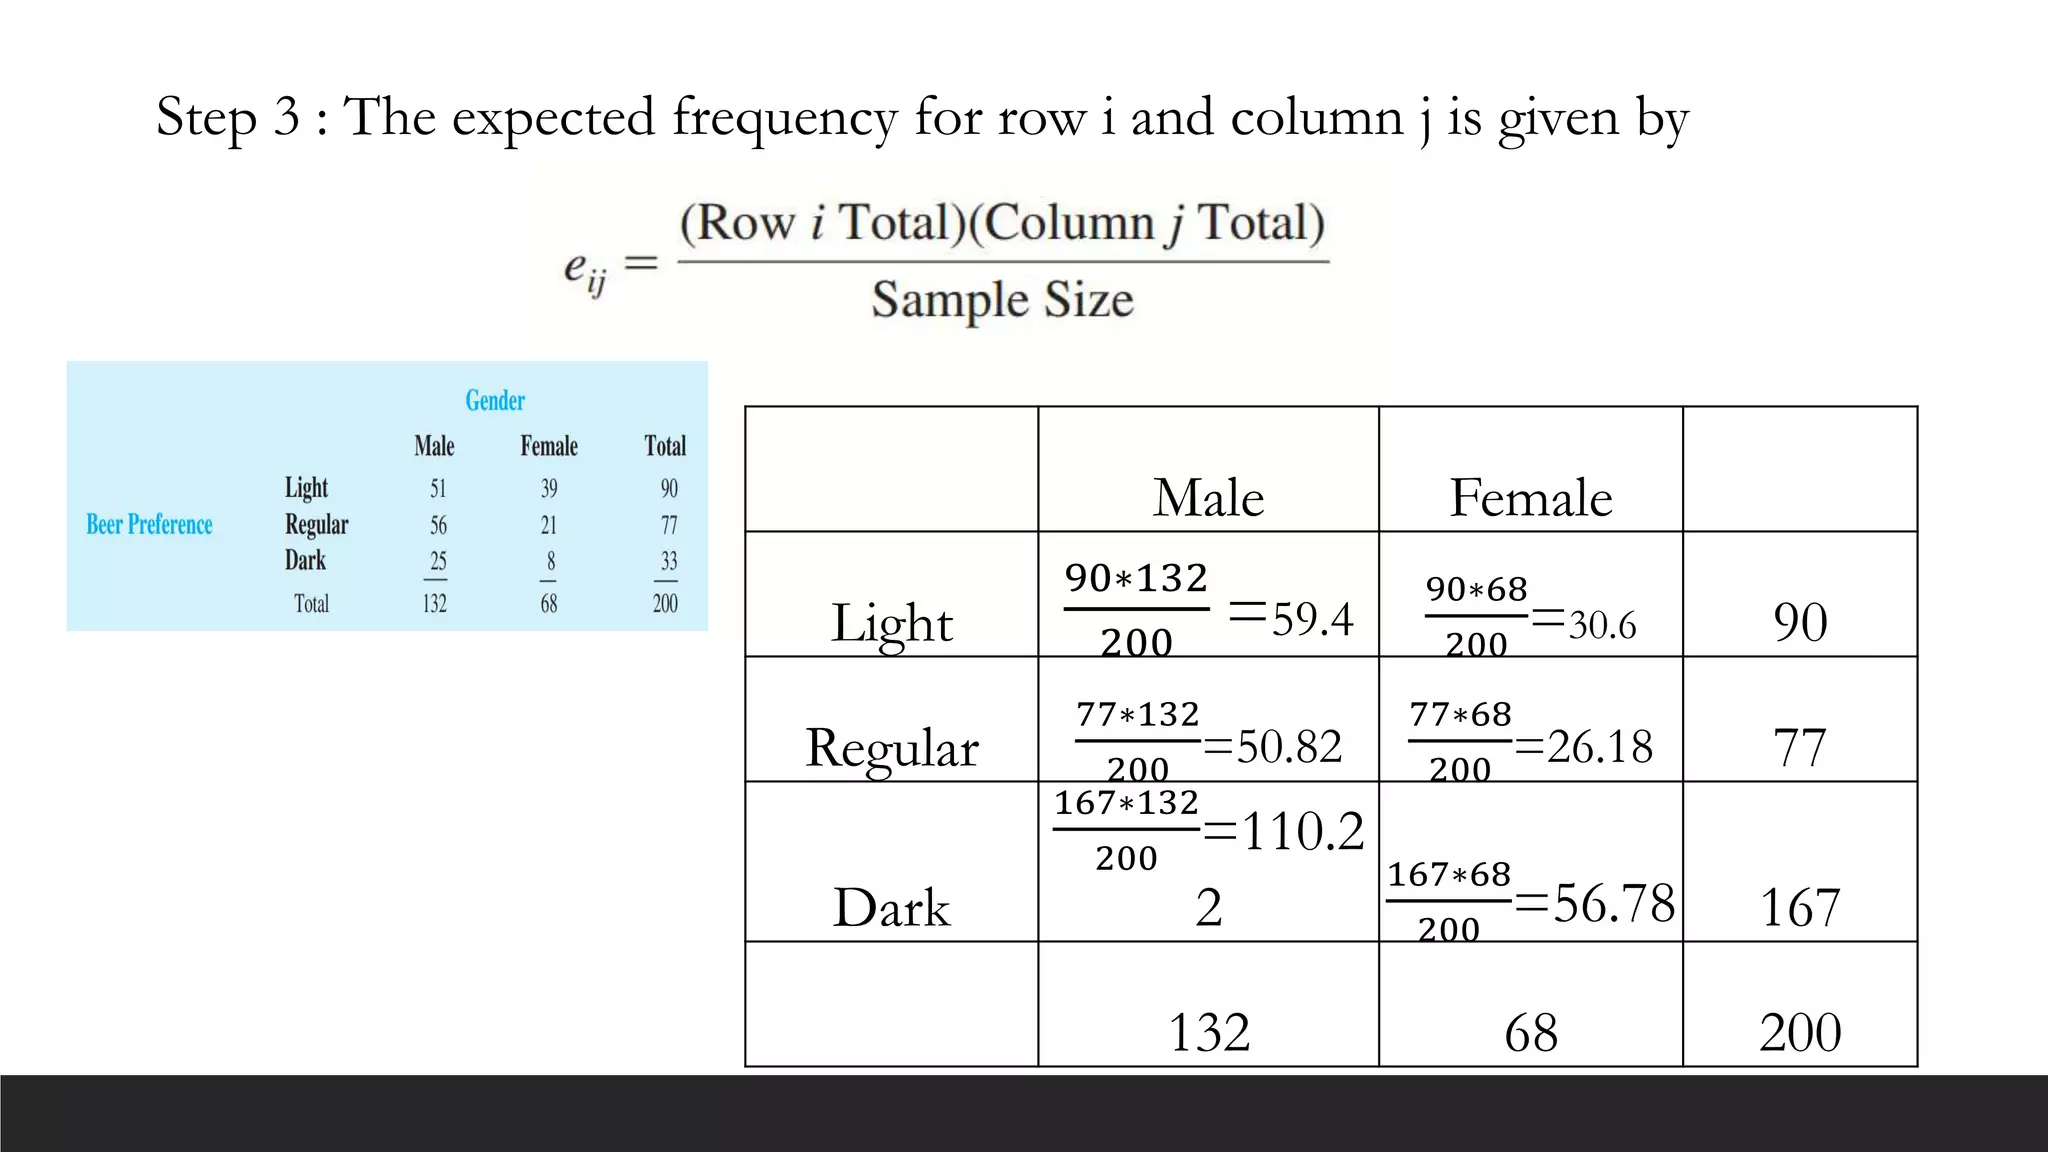
Step 3 :The expected frequency for row i and column j is given by
Male Female
Light
90∗132
200
=59.4
90∗68
200
=30.6 90
Regular
77∗132
200
=50.82
77∗68
200
=26.18 77
Dark
167∗132
200
=110.2
2
167∗68
200
=56.78 167
132 68 200
22.
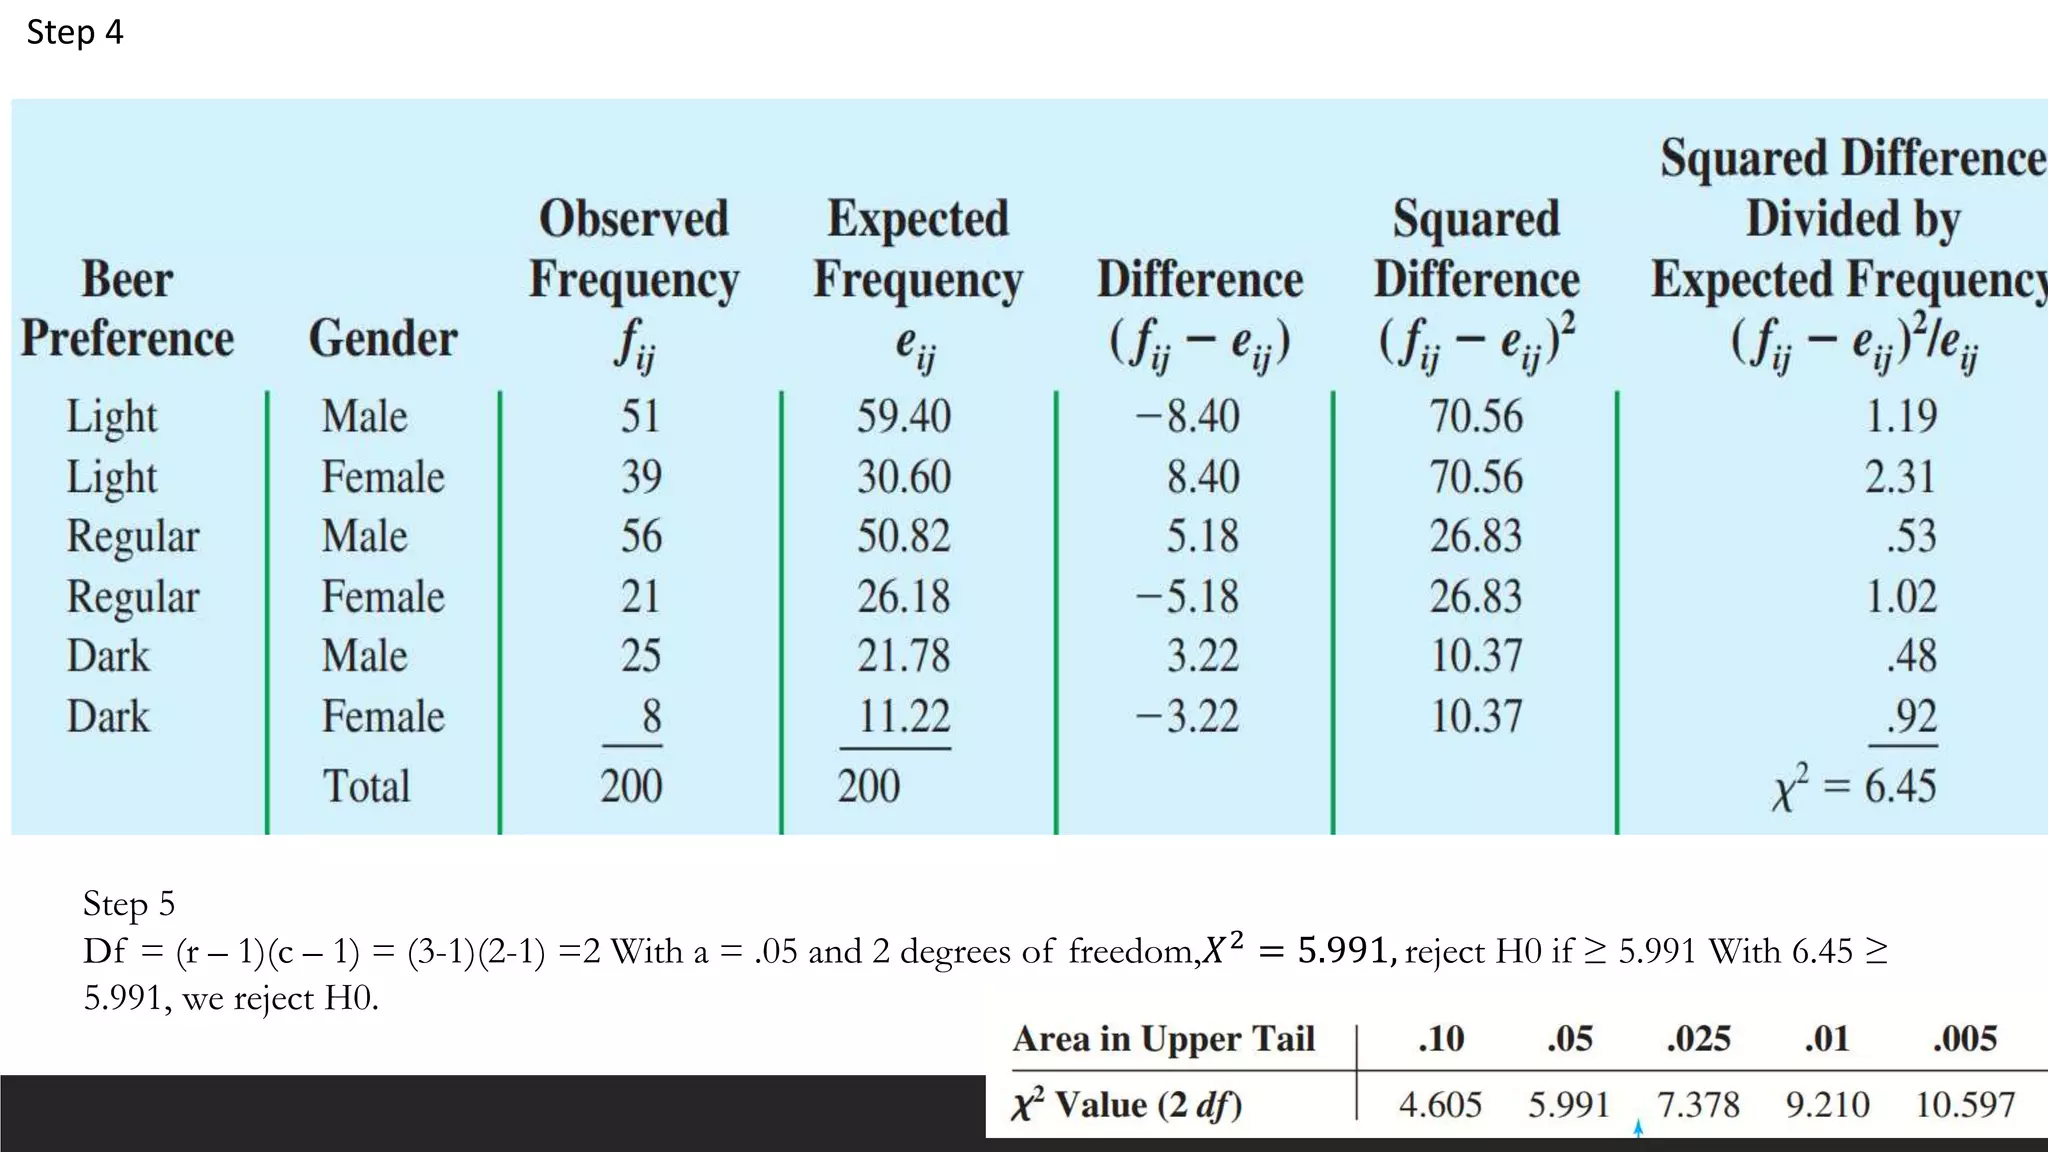
Step 4
Step 5
Df= (r – 1)(c – 1) = (3-1)(2-1) =2 With a = .05 and 2 degrees of freedom,𝑋2 = 5.991, reject H0 if ≥ 5.991 With 6.45 ≥
5.991, we reject H0.
23.
Example – Chisquare as test of
independence
A research worker conducted survey in two areas and classified some people in income groups on the basis of
sampling studies. Their results are as follows
Test if the areas and income level have association
Solution
H0: The areas and income level are independent or no association
Investigators Poor income Middle
income
High income Total
Area 1 160 30 10 200
Area 2 140 120 40 300
Total 300 150 50 500
X2 = 55.54 , df =2, 5% , crtical = 5.991
CV > TV reject Ho : the areas and income as depe
Kothari Pg 242
24.
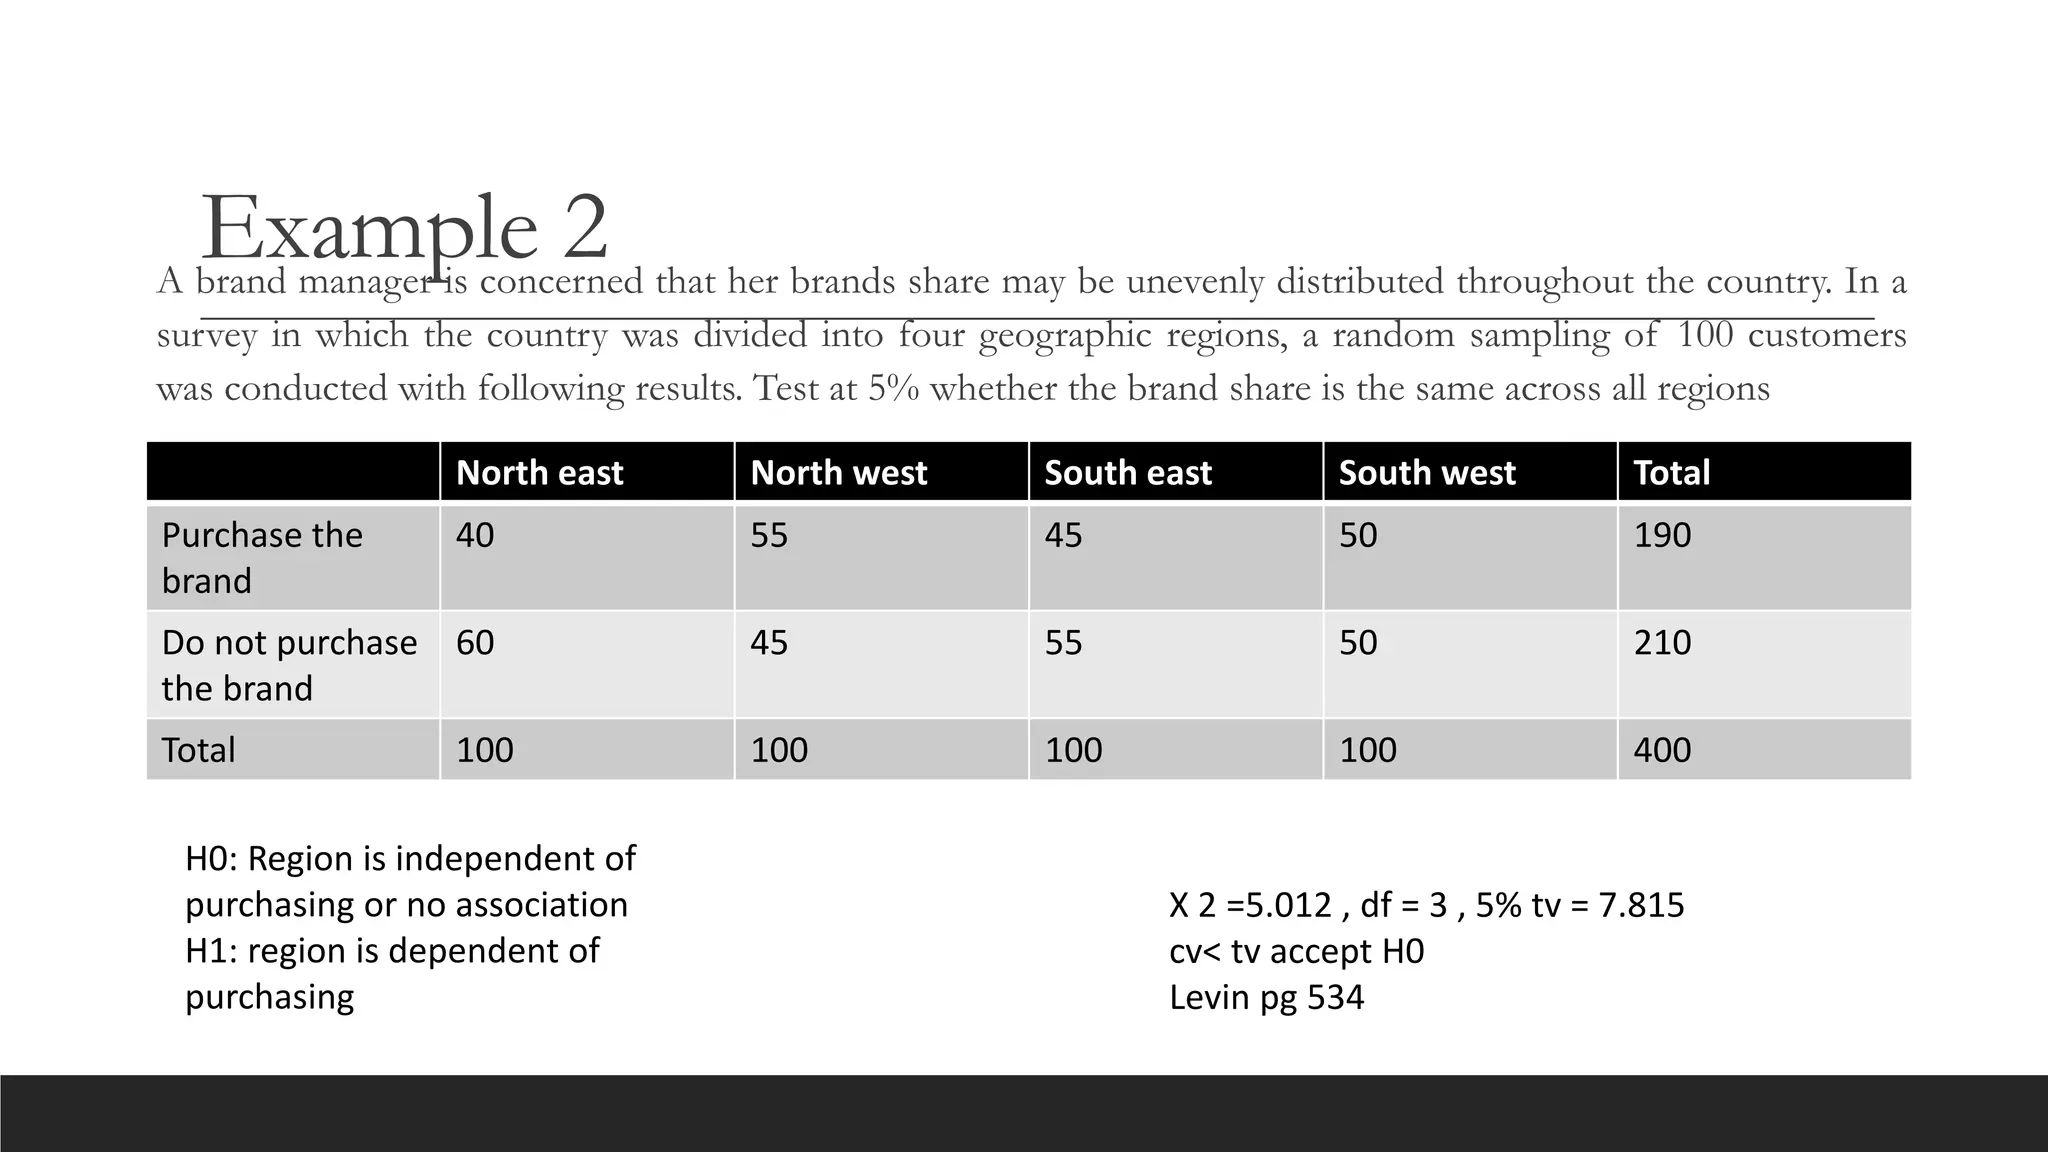
Example 2
A brandmanager is concerned that her brands share may be unevenly distributed throughout the country. In a
survey in which the country was divided into four geographic regions, a random sampling of 100 customers
was conducted with following results. Test at 5% whether the brand share is the same across all regions
X 2 =5.012 , df = 3 , 5% tv = 7.815
cv< tv accept H0
Levin pg 534
North east North west South east South west Total
Purchase the
brand
40 55 45 50 190
Do not purchase
the brand
60 45 55 50 210
Total 100 100 100 100 400
H0: Region is independent of
purchasing or no association
H1: region is dependent of
purchasing
25.
Case 3 :Testing equality
of three or more
proportions
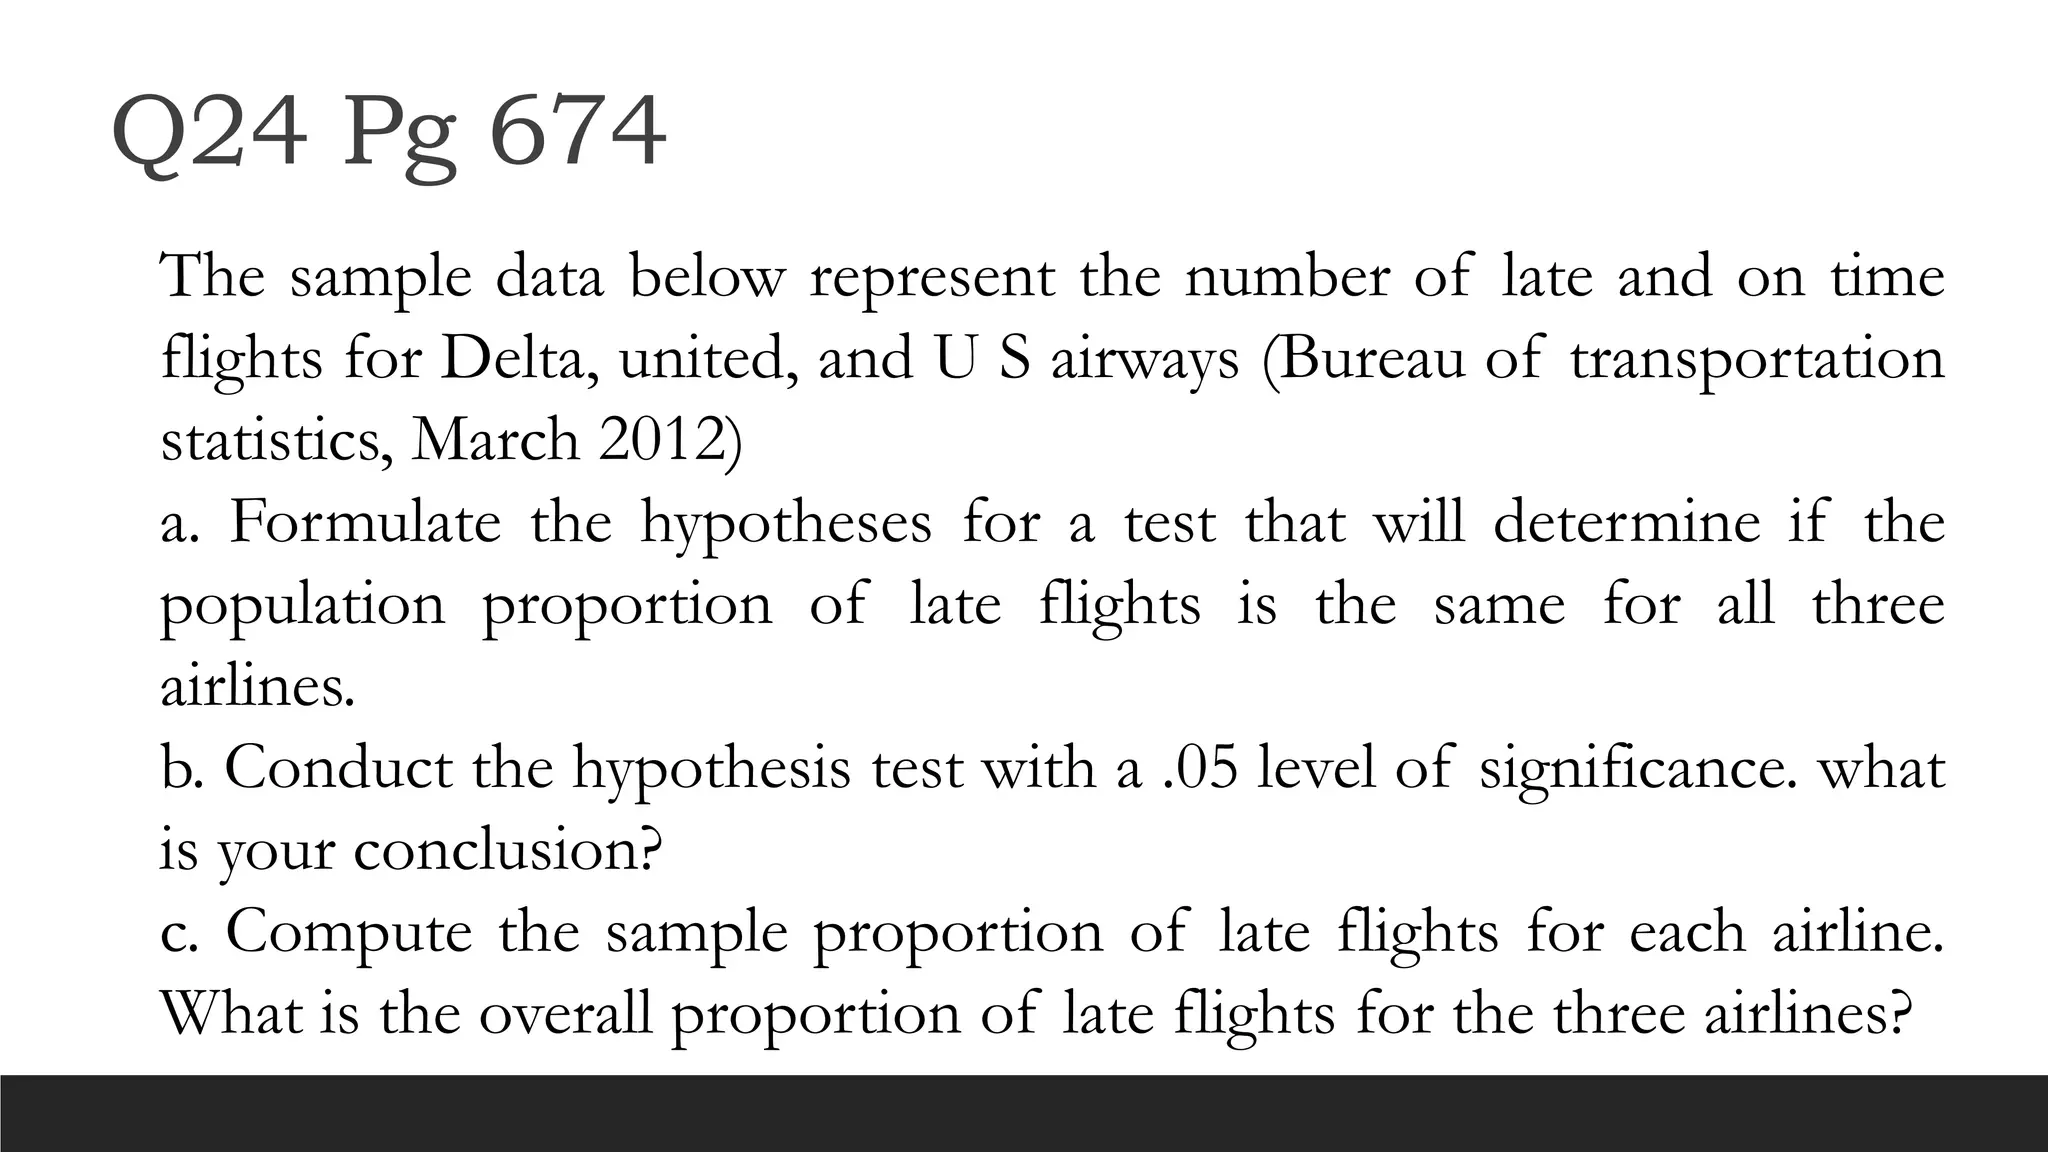
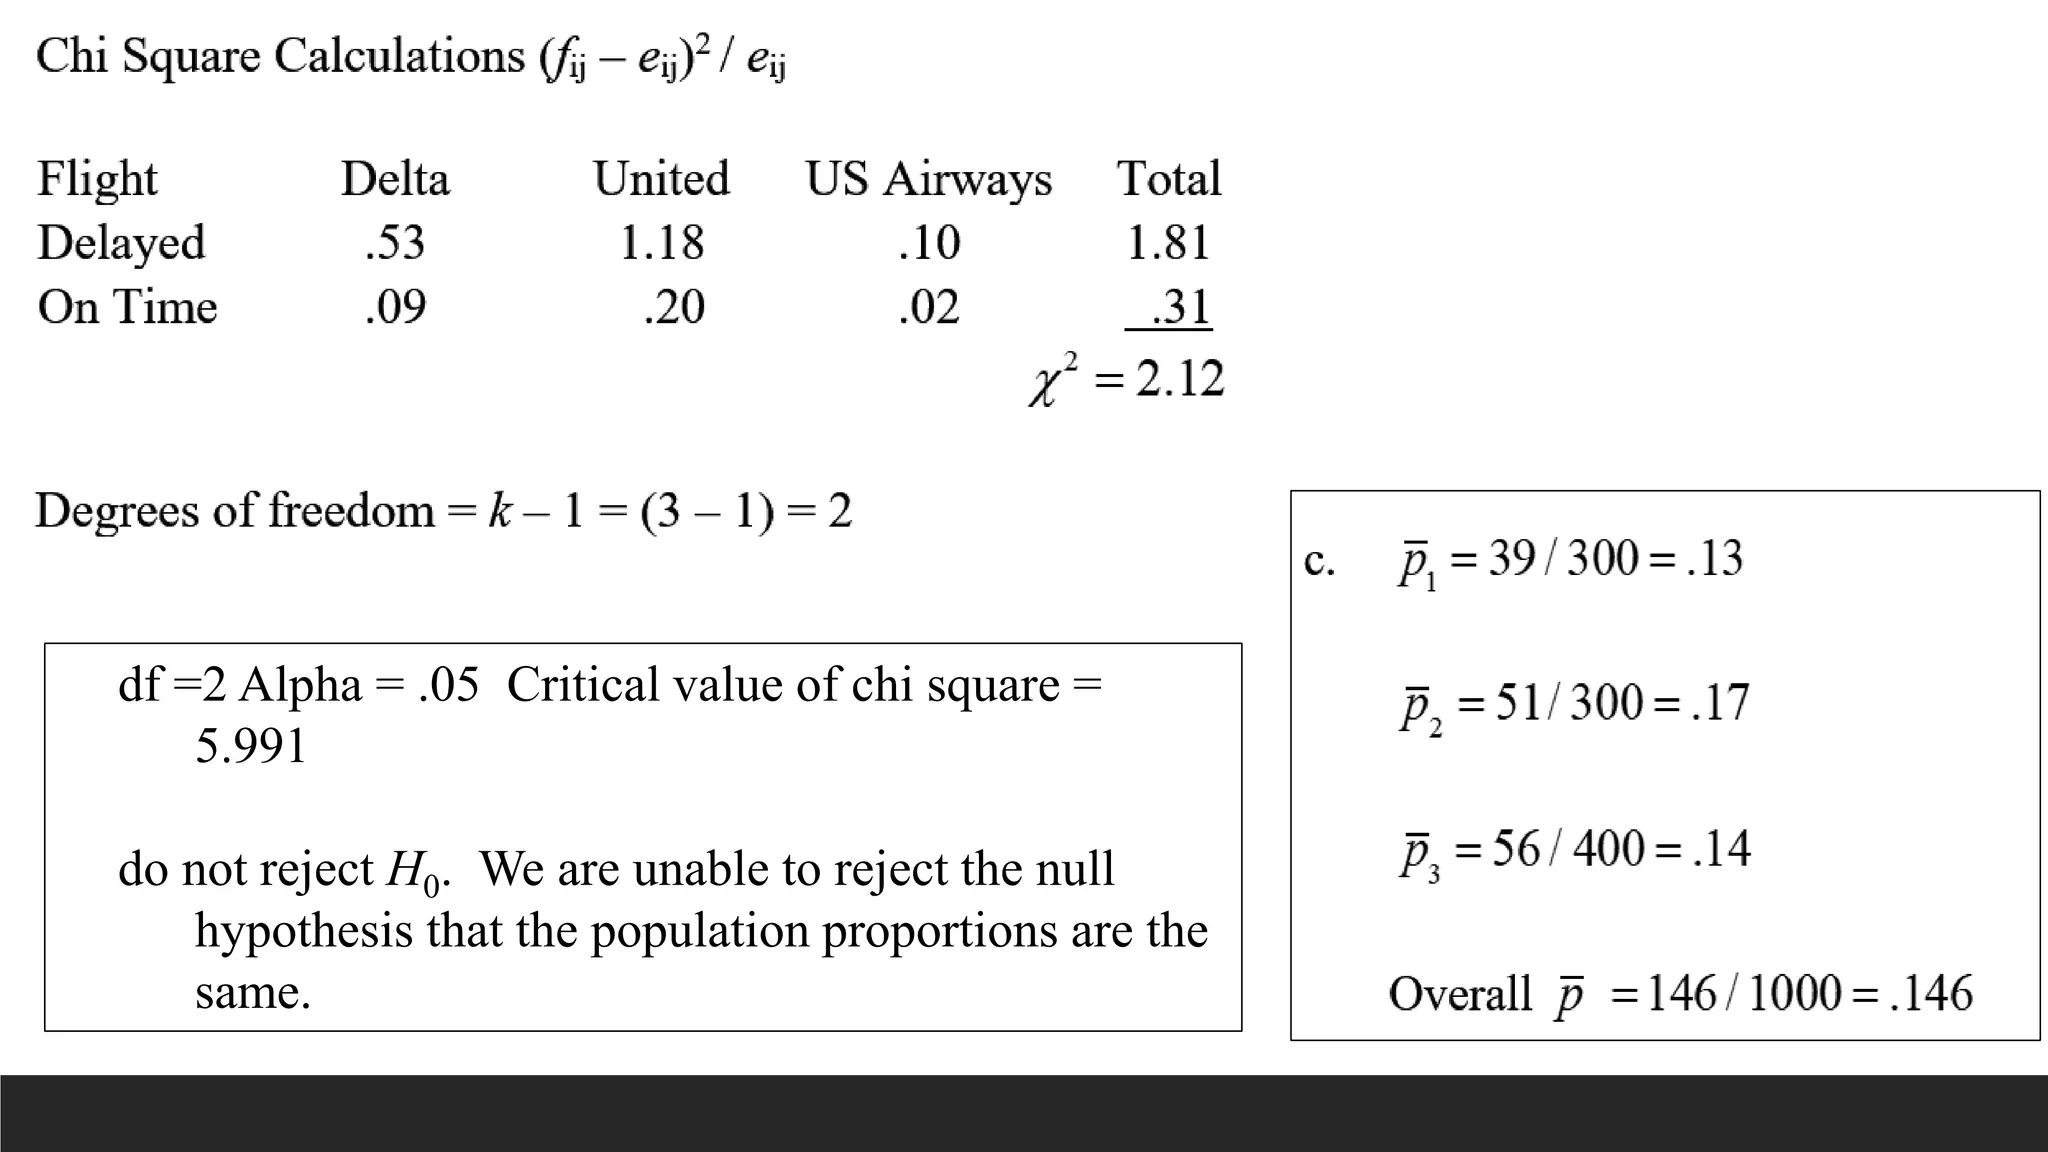
Q24 Pg 674
Thesample data below represent the number of late and on time
flights for Delta, united, and U S airways (Bureau of transportation
statistics, March 2012)
a. Formulate the hypotheses for a test that will determine if the
population proportion of late flights is the same for all three
airlines.
b. Conduct the hypothesis test with a .05 level of significance. what
is your conclusion?
c. Compute the sample proportion of late flights for each airline.
What is the overall proportion of late flights for the three airlines?
29.
df =2 Alpha= .05 Critical value of chi square =
5.991
do not reject H0. We are unable to reject the null
hypothesis that the population proportions are the
same.


![725Actual Session 126 (5) [Autosaved].pptx](https://cdn.slidesharecdn.com/ss_thumbnails/725actualsession1265autosaved-220908132926-94ed533e-thumbnail.jpg?width=640&height=640&fit=bounds)


