One Direction Do Physics
•
30 likes•9,489 views

This presentation is for my class to work through as teachers are on a series of PD days. It is based on a very bad One Direction joke cracked in a class about vectors.

Recommended
More Related Content
Viewers also liked
Viewers also liked (13)
Similar to One Direction Do Physics
Similar to One Direction Do Physics (20)
More from Stephen Taylor
More from Stephen Taylor (20)
Recently uploaded
Recently uploaded (20)
One Direction Do Physics
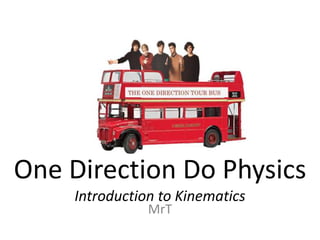
- 1. One Direction Do Physics Introduction to Kinematics MrT
- 2. Scalars vs Vectors Non-directional quantities Quantities with direction Distance Displacement How far an object travels along a path Position of an object in reference to an origin or previous position Speed Velocity Rate of change of the position of an Rate of change of the position of an object object, e.g. 20m/s in a given direction, e.g. 20m/s East “per unit time” Δd Average speed or velocity v= Δt Change in distance or displacement Change in time More scalars: More vectors: Time Acceleration Energy Force Mass Electric field Volume
- 3. This is a displacement-time graph for the One-Direction tour bus. • Did they really go in one direction? How do you know? • Calculate their velocity at 2s • State their velocity at 4s. • Calculate their velocity at 6.5s • Calculate their average velocity (over the whole journey) Displacement-time graph for the One Direction tour bus. displacement (m) 20 10 time (seconds)
- 4. This is a displacement-time graph for the One-Direction tour bus. • Did they really go in one direction? How do you know? • Calculate their velocity at 2s • State their velocity at 4s. • Calculate their velocity at 6.5s • Calculate their average velocity (over the whole journey) Displacement-time graph for the One Direction tour bus. displacement (m) 20 10 time (seconds)
- 5. This is a displacement-time graph for the One-Direction tour bus. • Did they really go in one direction? How do you know? • Calculate their velocity at 2s • State their velocity at 4s. • Calculate their velocity at 6.5s • Calculate their average velocity (over the whole journey) Displacement-time graph for the One Direction tour bus. movement back towards origin displacement (m) 20 (negative displacement) movement away from origin (positive displacement) Remember: Velocity is a vector (it has magnitude and direction). 10 time (seconds)
- 6. This is a displacement-time graph for the One-Direction tour bus. • Did they really go in one direction? How do you know? • Calculate their velocity at 2s • State their velocity at 4s. • Calculate their velocity at 6.5s • Calculate their average velocity (over the whole journey) Displacement-time graph for the One Direction tour bus. displacement (m) 20 10 time (seconds)
- 7. This is a displacement-time graph for the One-Direction tour bus. • Did they really go in one direction? How do you know? • Calculate their velocity at 2s • State their velocity at 4s. • Calculate their velocity at 6.5s • Calculate their average velocity (over the whole journey) Displacement-time graph for the One Direction tour bus. 25m constant motion, so we can easily find Δd and Δt. displacement (m) 20 Δd 15m 15m/s 10 v= Δt = 1s = (away) velocity is a vector, so you must include the direction! 1 second time (seconds)
- 8. This is a displacement-time graph for the One-Direction tour bus. • Did they really go in one direction? How do you know? • Calculate their velocity at 2s • State their velocity at 4s. • Calculate their velocity at 6.5s • Calculate their average velocity (over the whole journey) Displacement-time graph for the One Direction tour bus. displacement (m) 20 10 time (seconds)
- 9. This is a displacement-time graph for the One-Direction tour bus. • Did they really go in one direction? How do you know? • Calculate their velocity at 2s • State their velocity at 4s. • Calculate their velocity at 6.5s • Calculate their average velocity (over the whole journey) Displacement-time graph for the One Direction tour bus. No change in displacement over time displacement (m) 20 RESTING therefore: v = 0m/s 10 time (seconds)
- 10. This is a displacement-time graph for the One-Direction tour bus. • Did they really go in one direction? How do you know? • Calculate their velocity at 2s • State their velocity at 4s. • Calculate their velocity at 6.5s • Calculate their average velocity (over the whole journey) Displacement-time graph for the One Direction tour bus. displacement (m) 20 10 time (seconds)
- 11. This is a displacement-time graph for the One-Direction tour bus. • Did they really go in one direction? How do you know? • Calculate their velocity at 2s • State their velocity at 4s. • Calculate their velocity at 6.5s • Calculate their average velocity (over the whole journey) Displacement-time graph for the One Direction tour bus. constant motion, so we can easily find Δd and Δt. displacement (m) 20 Note: this time they’re moving closer to the sensor. Velocity will be negative. 10 time (seconds)
- 12. This is a displacement-time graph for the One-Direction tour bus. • Did they really go in one direction? How do you know? • Calculate their velocity at 2s • State their velocity at 4s. • Calculate their velocity at 6.5s • Calculate their average velocity (over the whole journey) Displacement-time graph for the One Direction tour bus. 25m displacement (m) 20 Δd -5m -10m/s 10 v= Δt = 0.5s = (or 10m/s towards) we’d determined that movement away was positive time (seconds) 0.5s
- 13. This is a displacement-time graph for the One-Direction tour bus. • Did they really go in one direction? How do you know? • Calculate their velocity at 2s • State their velocity at 4s. • Calculate their velocity at 6.5s • Calculate their average velocity (over the whole journey) Displacement-time graph for the One Direction tour bus. displacement (m) 20 10 time (seconds)
- 14. This is a displacement-time graph for the One-Direction tour bus. • Did they really go in one direction? How do you know? • Calculate their velocity at 2s • State their velocity at 4s. • Calculate their velocity at 6.5s • Calculate their average velocity (over the whole journey) Displacement-time graph for the One Direction tour bus. 20 17.5m displacement (m) 10 Δd 7.5m v= Δt = 10s =0.75m/s (away) time (seconds)
- 15. Velocity and Vectors Δd v= Velocity is a vector – it has direction. Δt We can use velocity vector diagrams to describe motion. The lengths of the arrows are magnitude – a longer arrow means + greater velocity and are to scale. The dots represent the object at consistent points in time. The direction of the arrow is important. Describe the motion in these velocity vector diagrams: origin Positive velocity, increasing velocity. + origin origin origin +
- 16. Velocity and Vectors Δd v= Velocity is a vector – it has direction. Δt We can use velocity vector diagrams to describe motion. The lengths of the arrows are magnitude – a longer arrow means + greater velocity and are to scale. The dots represent the object at Positive velocity, decreasing velocity. Negative velocity, increasing velocity. consistent points in time. The direction of the arrow is important. Describe the motion in these velocity vector diagrams: origin Positive velocity, increasing velocity. + + Negative velocity, increasing velocity. origin origin Object moves quickly away from origin Positive velocity, decreasing velocity. + origin, slows, turns and speeds up on return to origin.
- 17. The birds are angry that the pigs destroyed their Velocity and Vectors nests – but luckily they have spotted a new nesting site. However, short-winged and poorly adapted to flight, they need to use a slingshot to get there. Draw velocity vectors for each position of the angry bird to show its relative instantaneous velocity. Use the first vector as a guide. The flight takes 2.3s. Calculate: • vertical displacement of the bird. • average velocity (up) of the bird. • average velocity (right) of the bird. • average overall velocity (include direction and magnitude) 1.6m 55cm 7.5 m
- 18. Velocity and Vectors Draw velocity vectors for each position of the angry bird to show its relative instantaneous velocity. Use the first vector as a guide.
- 19. Velocity and Vectors Draw velocity vectors for each position of the angry bird to show its relative instantaneous velocity. Use the first vector as a guide. Remember that velocity vectors represent velocity – not distance. So it doesn’t matter if there is an object in the way – the velocity is the same until the moment of impact.
- 20. Velocity and Vectors One Direction got some new toys. They couldn’t point them in the same direction. Draw velocity vector diagrams for each of these karts. 10km/h 16km/h 8km/h 20km/h Use the known vector as the scale.
- 21. Velocity and Vectors One Direction got some new toys. They couldn’t point them in the same direction. Draw velocity vector diagrams for each of these karts. 10km/h 16km/h 8km/h 20km/h Use the known vector as the scale.
- 22. One of the boys was sent to bed. Three of the others had a kart race: origin 30 60 90 120 150 180 Which karts are experiencing acceleration? Find out here: http://www.physicsclassroom.com/mmedia/kinema/acceln.cfm Read through the Acceleration lesson at the Physics Classroom: Sketch distance – time graphs for each car (on the same axes) Distance What do the shapes of the lines tell us about the cars’ motion? Time
- 23. Describe the motion in these graphs. A B C v v v t t t D E F v d d t t t
- 24. If the tour bus keeps going at the same speed in One Direction: • They have constant velocity • They are not accelerating Δd v= Δt Change in distance or displacement Change in time If the tour bus is at rest, they have: • zero velocity • and zero acceleration Acceleration is a vector: it has magnitude and direction.
- 25. Acceleration is a vector: it has magnitude and direction. We usually think of acceleration as • ‘speeding up’ These are more appropriate descriptors of • ‘slowing down’. changes in speed than in velocity. has direction! Instead, think of acceleration as: • ‘positive’ acceleration is same direction as velocity • ‘negative’ acceleration is opposite velocity Stop here and work through the page on acceleration at: http://www.physicsclassroom.com/Class/1DKin/U1L1e.cfm
- 26. Acceleration Change in velocity Δv a= Δt = acceleration final velocity – initial velocity (m/s) Time (s) Change in time m/s/s “Metres per second per second” On the next pages, complete the tables and sketch the graphs before you skip onto the solutions.
- 27. Acceleration a = 3m/s/s Time (s) Velocity (m/s) Velocity (ms-1) 0 0 1 2 3 0 4 0 1 2 3 4 formula Time (s)
- 28. Acceleration a = 3m/s/s 12 Time (s) Velocity (m/s) 9 Velocity (m/s) 0 0 6 1 3 2 6 3 3 9 0 4 12 0 1 2 3 4 formula Time (s)
- 29. Acceleration a = 3m/s/s 12 Time (s) Velocity (m/s) 9 Velocity (m/s) 0 0 6 1 3 2 6 3 3 9 0 4 12 0 1 2 3 4 Time (s) formula v = 3t The velocity – time graph is linear as it is constant acceleration. This means it is increasing its velocity by the same amount each time. What would the distance – time graph look like?
- 30. Acceleration a = 3m/s/s 12 A car accelerates at a constant rate of 3m/s/s. Time (s) Velocity Calculate its instantaneous velocity at 7.5s: 9 a. in m/s (m/s) Velocity (ms-1) 0 0 6 b. in km/h 1 3 2 6 3 Calculate the time taken to reach its 3 9 maximum velocity of 216km/h. 0 4 12 0 1 2 3 4 formula v = 3t Time (s)
- 31. Acceleration a = 3m/s/s 12 Time (s) Velocity Displace- (m/s) ment (m) 30 9 0 Velocity (m/s) Displacement (m) 1 6 18 2 3 9 3 3 4 0 0 1 2 3 4 Time (s) formula Determine the velocity and displacement of the object each second. Plot the results on the graph. Compare the shapes of the two graphs.
- 32. Acceleration a = 3m/s/s 12 Time (s) Velocity Displace- (m/s) ment (m) 30 9 0 0 Velocity (m/s) Displacement (m) 1 3 6 18 2 6 3 9 3 9 3 4 12 0 0 1 2 3 4 Time (s) formula v = 3t The displacement – time graph is curved as it is constant acceleration – the rate of change of displacement increases. This means it is increasing its velocity by the same amount each time.
- 33. Acceleration a = 3m/s/s 12 Time (s) Velocity Displace- (m/s) ment (m) 30 9 0 0 0 Velocity (m/s) Displacement (m) 1 3 3 6 18 2 6 9 3 9 3 9 18 3 4 12 30 0 0 1 2 3 4 Time (s) formula v = 3t The displacement – time graph is curved as it is constant acceleration – the rate of change of displacement increases. This means it is increasing its velocity by the same amount each time.
- 34. Acceleration a = -2m/s/s Time (s) Velocity (ms-1) Velocity (m/s) 0 10 1 2 3 0 4 0 1 2 3 4 Time (s) formula
- 35. Acceleration a = -2m/s/s Time (s) Velocity (ms-1) Velocity (m/s) 0 10 1 8 2 6 3 4 0 4 2 0 1 2 3 4 Time (s) formula
- 36. Acceleration In this example, acceleration is constant. Determine the acceleration, plot the velocity over time and deduce the formula. a = ___m/s/s Velocity (m/s) Time (s) Velocity Explain: what does this tell us about (ms-1) acceleration? 0 6 1 3.5 2 0 3 0 1 Time (s) 2 3 4 4 formula
- 37. Acceleration a = 2km/h/s Time (s) Velocity (kmh-1) Velocity (km/h) 0 10 1 2 3 0 4 0 1 2 3 4 Time (s) formula
- 38. Acceleration a = 2km/h/s 18 Time (s) Velocity (kmh-1) Velocity (km/h) 0 10 1 10 2 3 4 0 0 1 2 3 4 formula Time (s)
- 39. Describe the journey of the One Direction tour bus. 20 D E velocity (m/s) C 10 B F A 1 2 3 4 5 6 7 8 9 10 time (s) Just as velocity is the rate of change of position of an object, acceleration is the rate of change in velocity. You can use the same methods to calculate acceleration from a graph.
- 40. Negative acceleration is opposite to velocity. The tour bus is headed for a cliff! • What is the velocity of the bus after 3s? • Does it stop in time? v = 20m/s vector diagrams can be used (to scale) to a = -2m/s/s represent velocity and acceleration. 100m
- 41. Negative acceleration is opposite to velocity. The tour bus is headed for a cliff! • What is the velocity of the bus after 3s? • Does it stop in time? v = 20m/s The bus starts at 20m/s and accelerates at - a = -2m/s/s 2m/s/s. • After 1s it is going at 18m/s 100m • After 2s is is going at 16m/s • After 3s it is going at 14m/s. What is the formula?
- 42. Negative acceleration is opposite to velocity. The tour bus is headed for a cliff! • What is the velocity of the bus after 3s? • Does it stop in time? v = 20m/s The bus starts at 20m/s and accelerates at - a = -2m/s/s 2m/s/s. • After 1s it is going at 18m/s 100m • After 2s is is going at 16m/s • After 3s it is going at 14m/s. What is the formula? v = 20 – 2t
- 43. Negative acceleration is opposite to velocity. The tour bus is headed for a cliff! • What is the velocity of the bus after 3s? • Does it stop in time? v = 20 – 2t t (s) v (m/s) d (cumulative, m) v = 20m/s a = -2m/s/s 0 20 0 100m 1 18 20 2 38 3 4 5 6 7 8
- 44. Negative acceleration is opposite to velocity. The tour bus is headed for a cliff! • What is the velocity of the bus after 3s? • Does it stop in time? v = 20 – 2t t (s) v (m/s) d (cumulative, m) v = 20m/s a = -2m/s/s 0 20 0 100m 1 18 20 2 16 38 3 14 54 4 12 68 5 10 80 6 8 90 7 6 98 8 4 102!
- 45. Acceleration due to gravity is 9.8m/s/s (downwards). Luckily the boys jump clear as the bus goes over the cliff. What is the velocity of the bus after: • 2s? • 5s? a = 9.8m/s/s Find out: what is terminal velocity?
- 46. Acceleration is a vector: it has magnitude and direction.
- 47. Acceleration is a vector: it has magnitude and direction. Did someone say New Directions? Any change in direction is a change in velocity and is therefore an acceleration.
- 48. Acceleration is a vector: it has magnitude and direction. Did someone say New Directions? Any change in direction is a change in velocity and is therefore an acceleration. How is it possible for an object moving at constant speed to experience acceleration, but not an object moving at constant velocity?
- 49. How is it possible for an object moving at constant speed to experience acceleration, but not an object moving at constant velocity? Image: Moon from northern hemisphere: http://en.wikipedia.org/wiki/Moon
- 50. Challenge Question: How far did the One Direction tour bus travel in 10 seconds? 20 velocity (m/s) 10 1 2 3 4 5 6 7 8 9 10 time (s)
- 51. Challenge Question: When can an object experience acceleration but have a velocity of zero?
- 52. Exit Ticket Take one minute to answer all three. I got it! • I don’t get it! • One of your own •
- 53. That’s what makes Physics beautiful! THE ONE DIRECTION TOUR BUS Images adapted from http://www.fanpop.com/spots/one-direction/images/28558025/title & http://goo.gl/zJnql
- 54. TOUR BUS NEW DIRECTIONS Images adapted from http://newspaper.li/new-directions/& http://www.vectis.co.uk/
- 56. For more resources. Please consider a donation to charity via Biology4Good. Click here for more information about Biology4Good charity donations. This is a Creative Commons presentation. It may be linked and embedded but not sold or re-hosted.