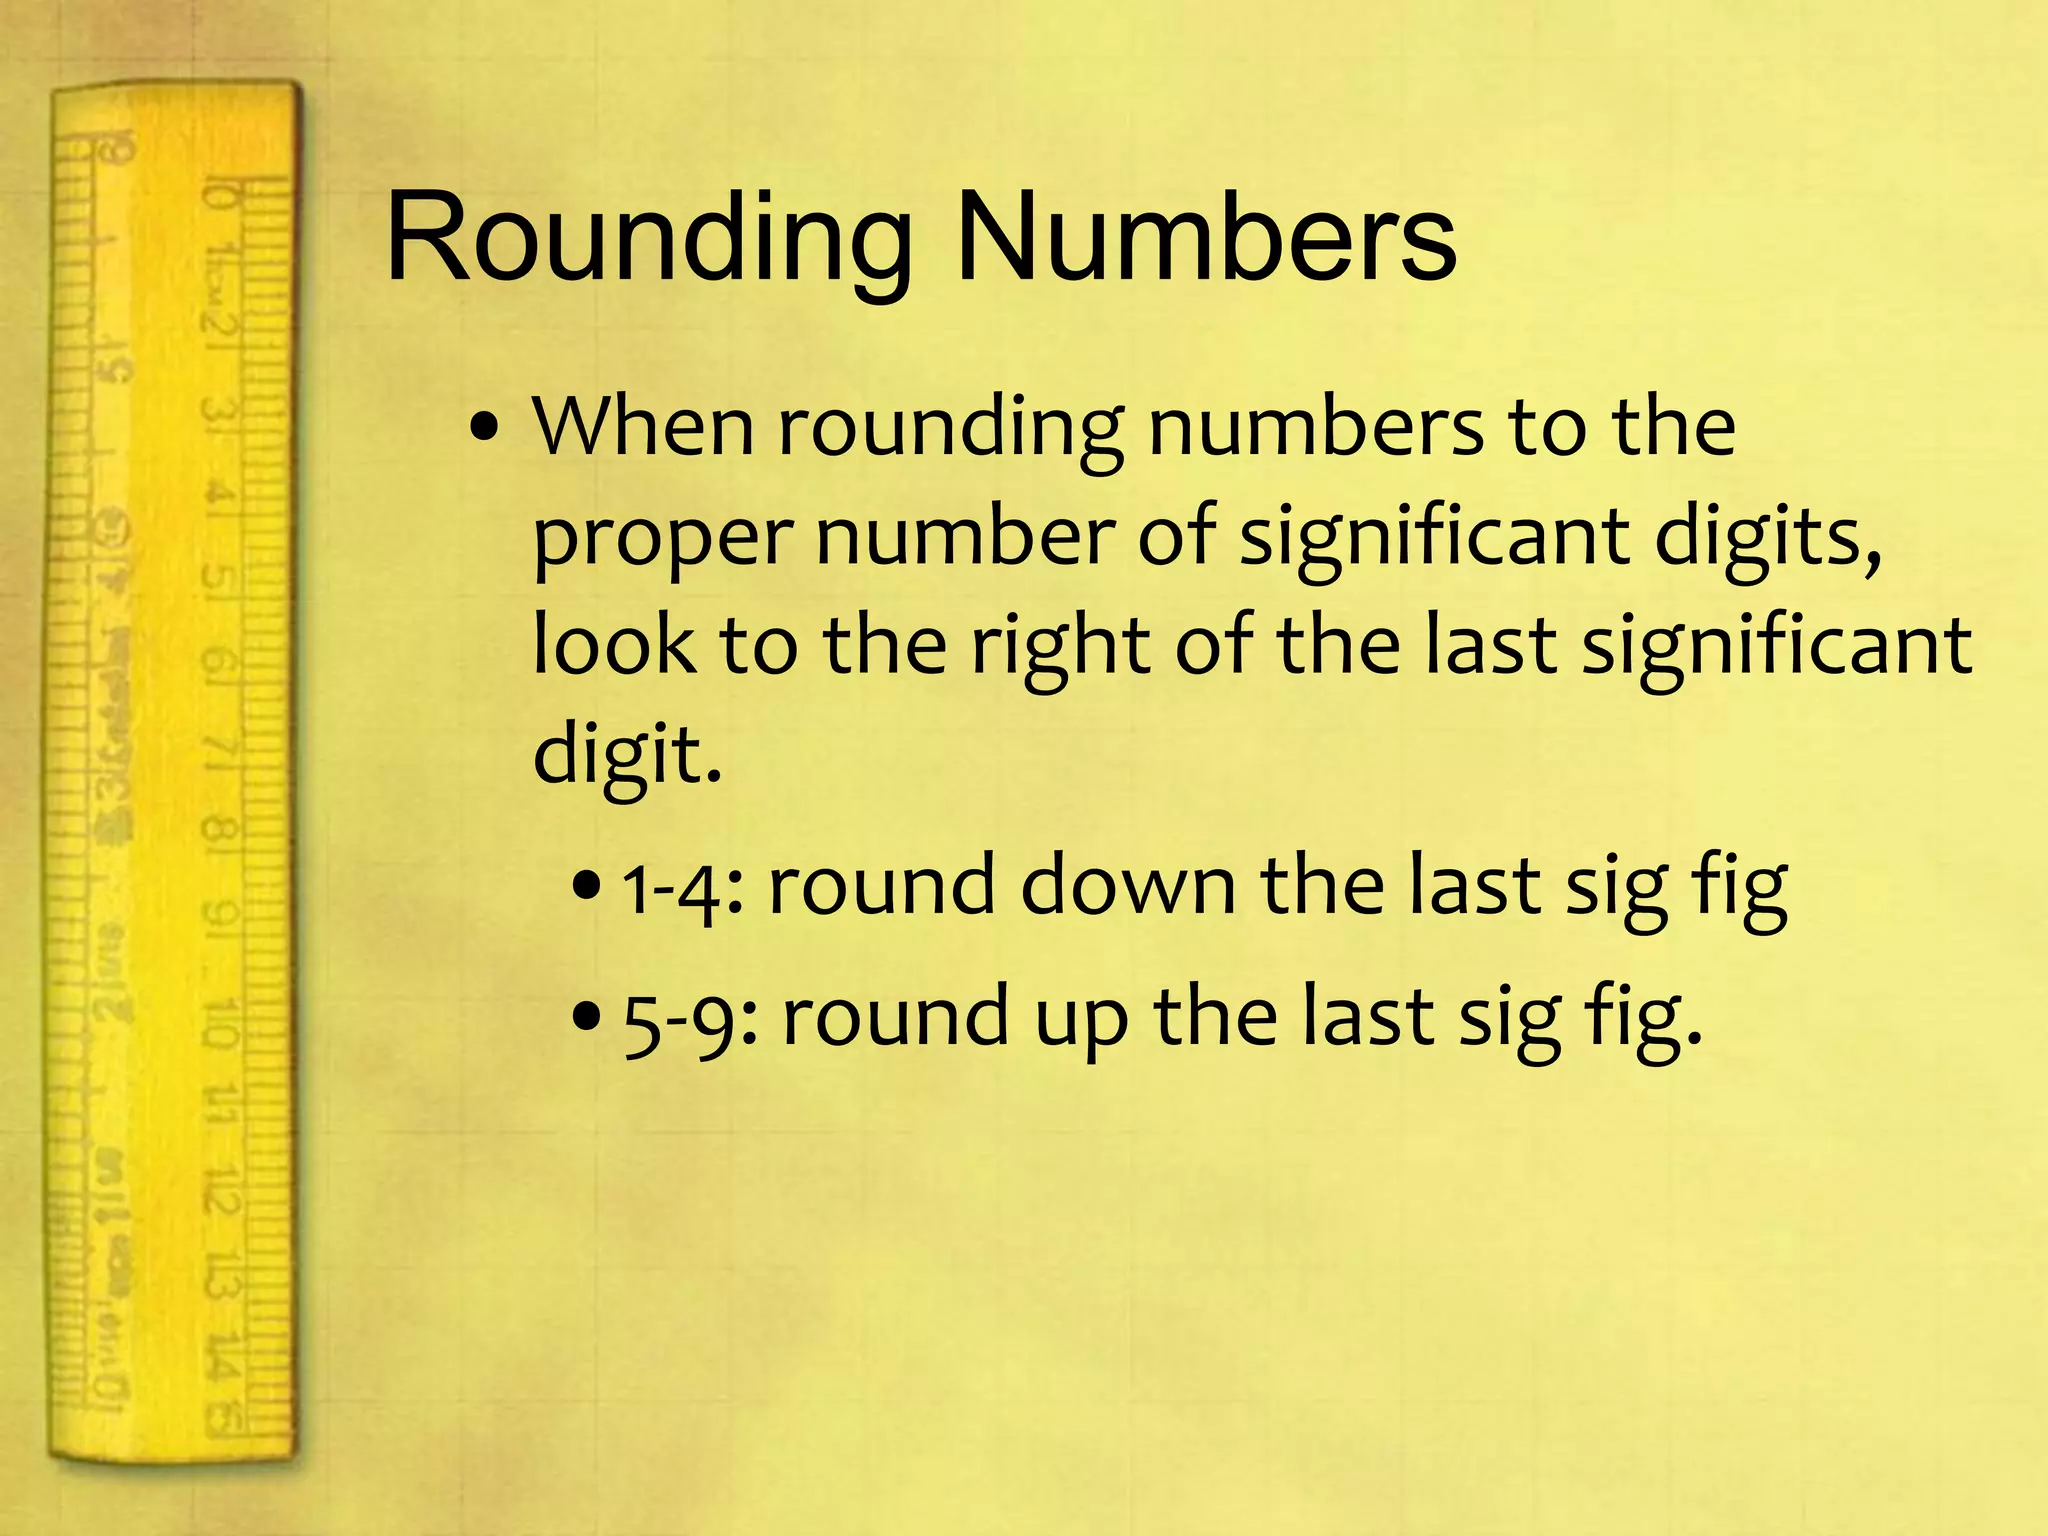
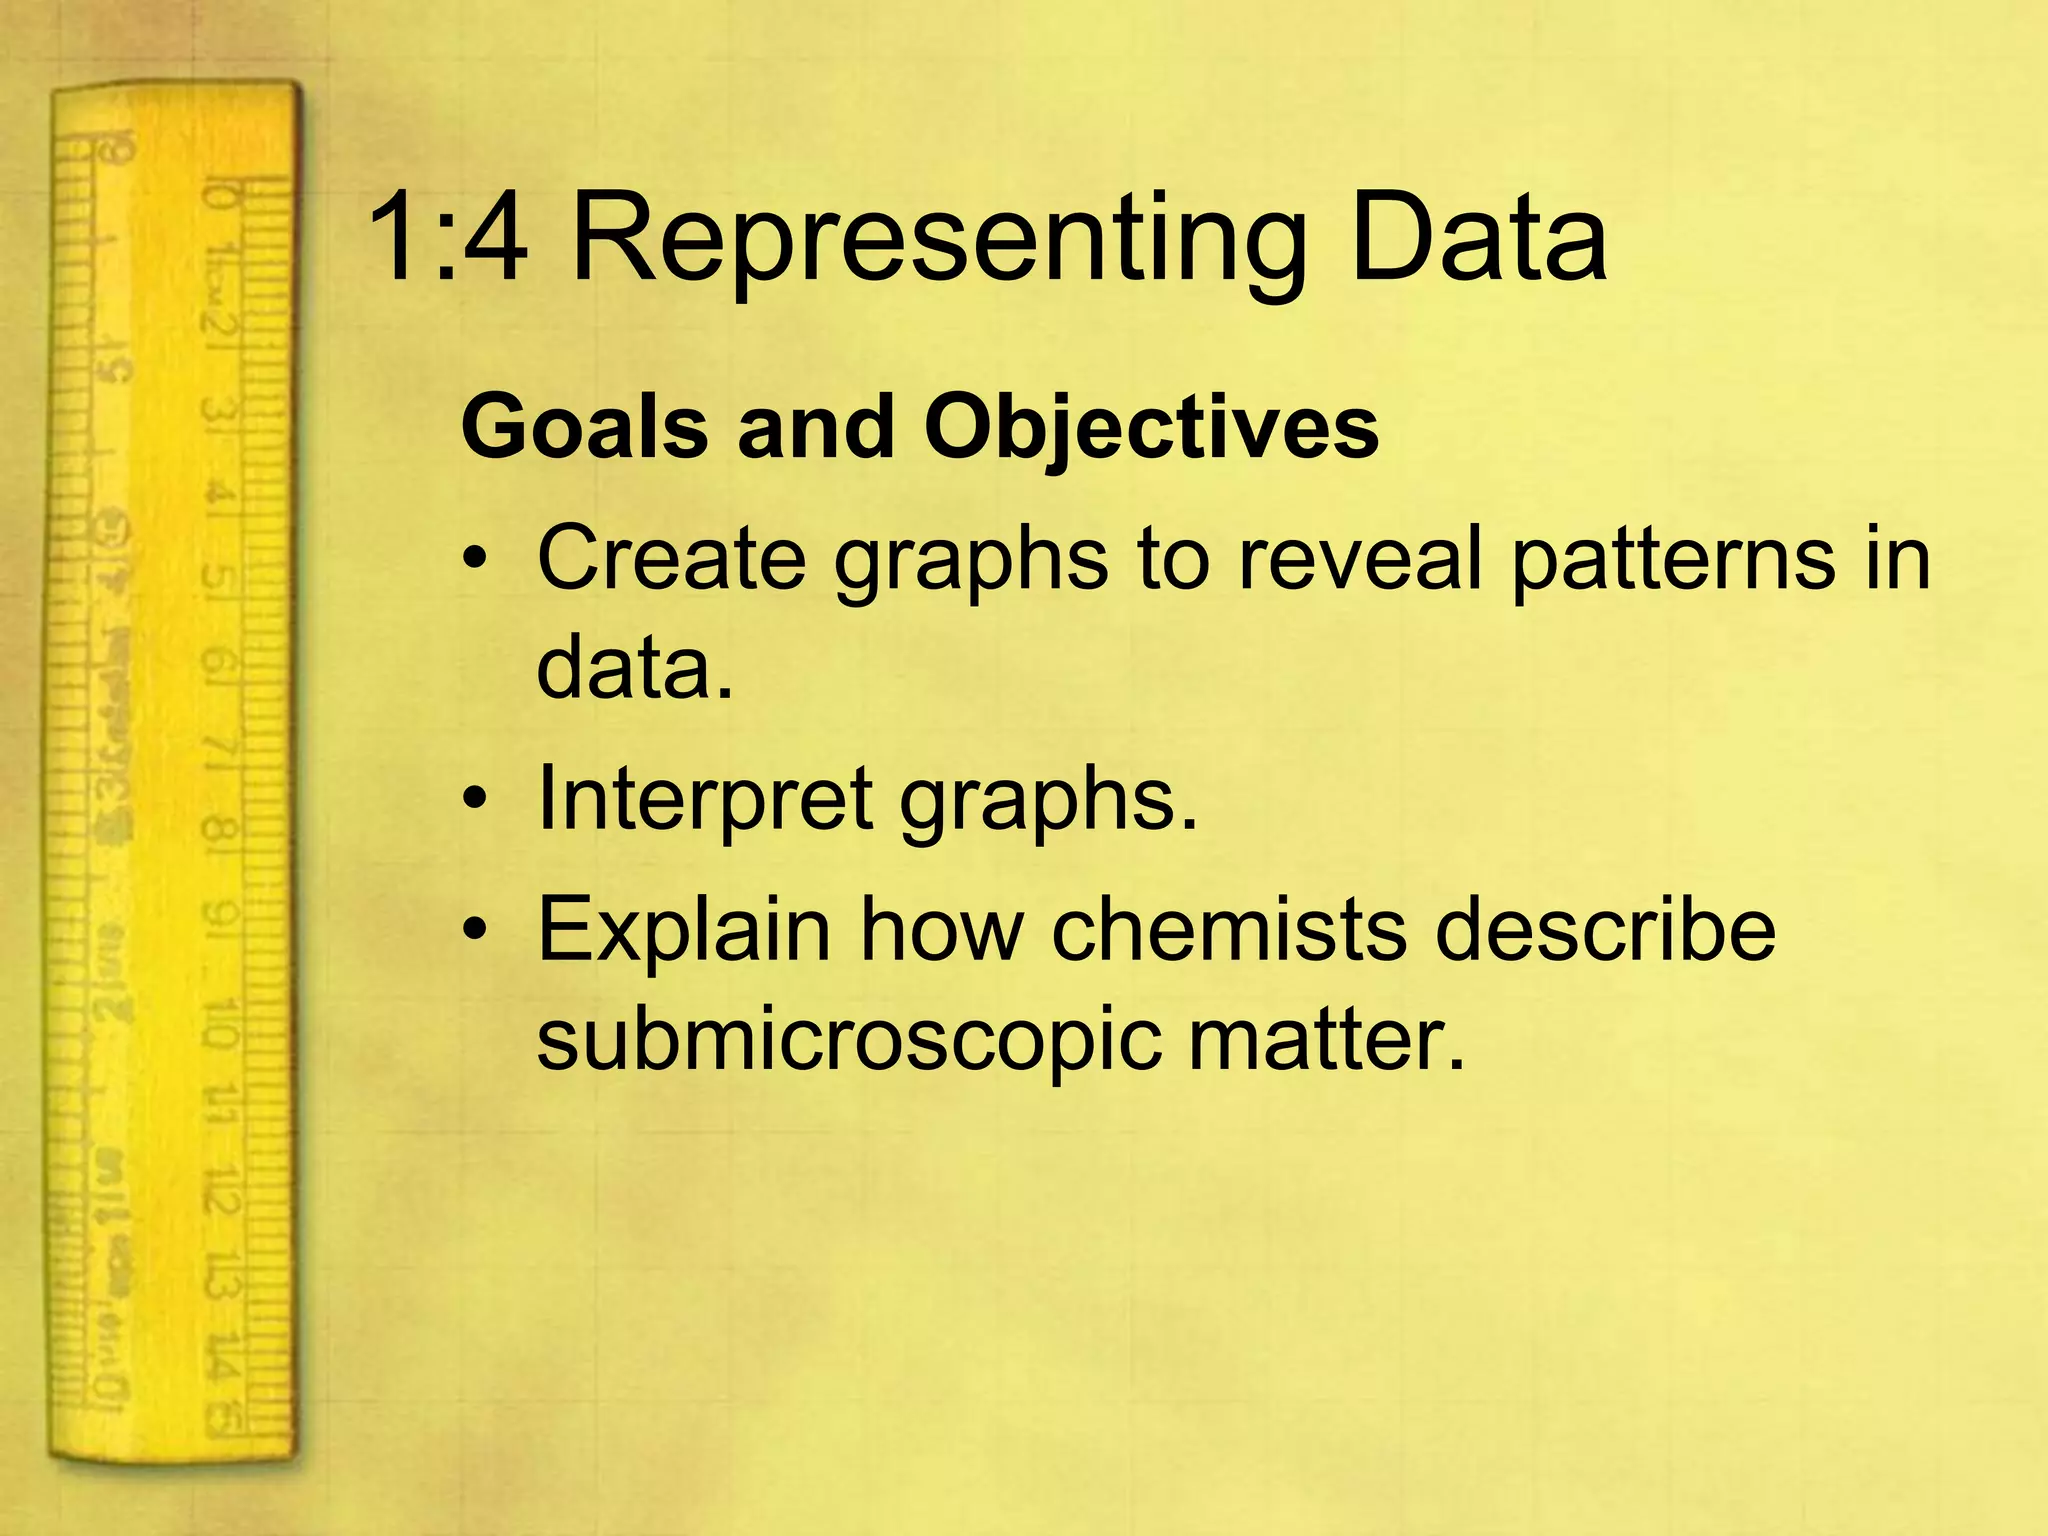
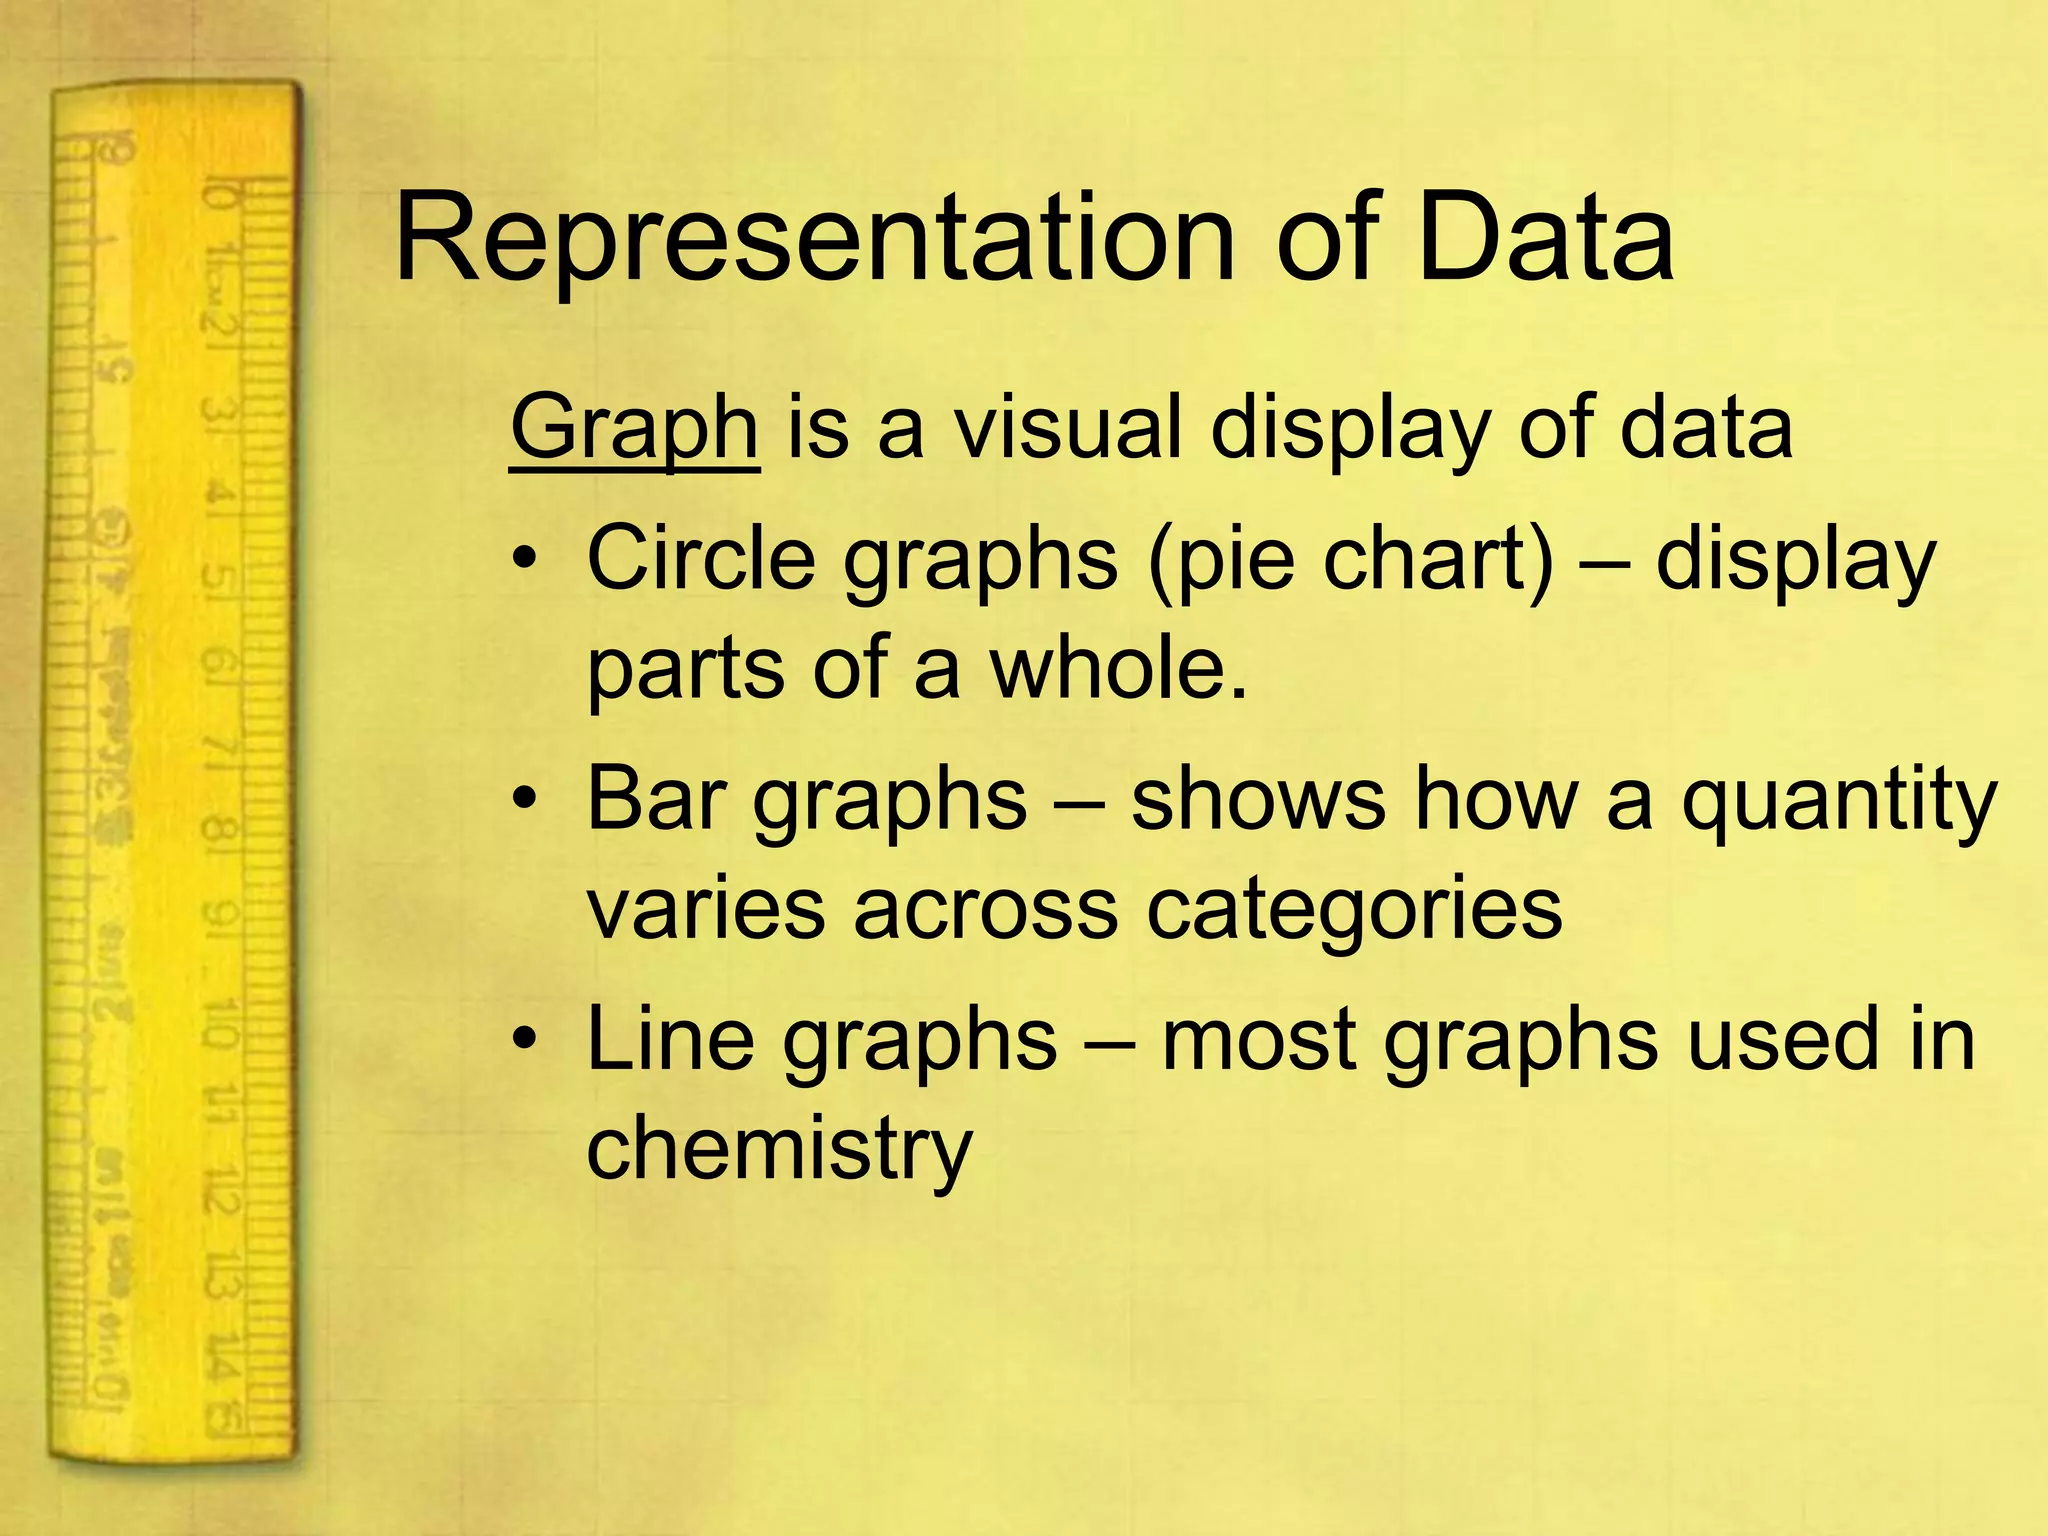
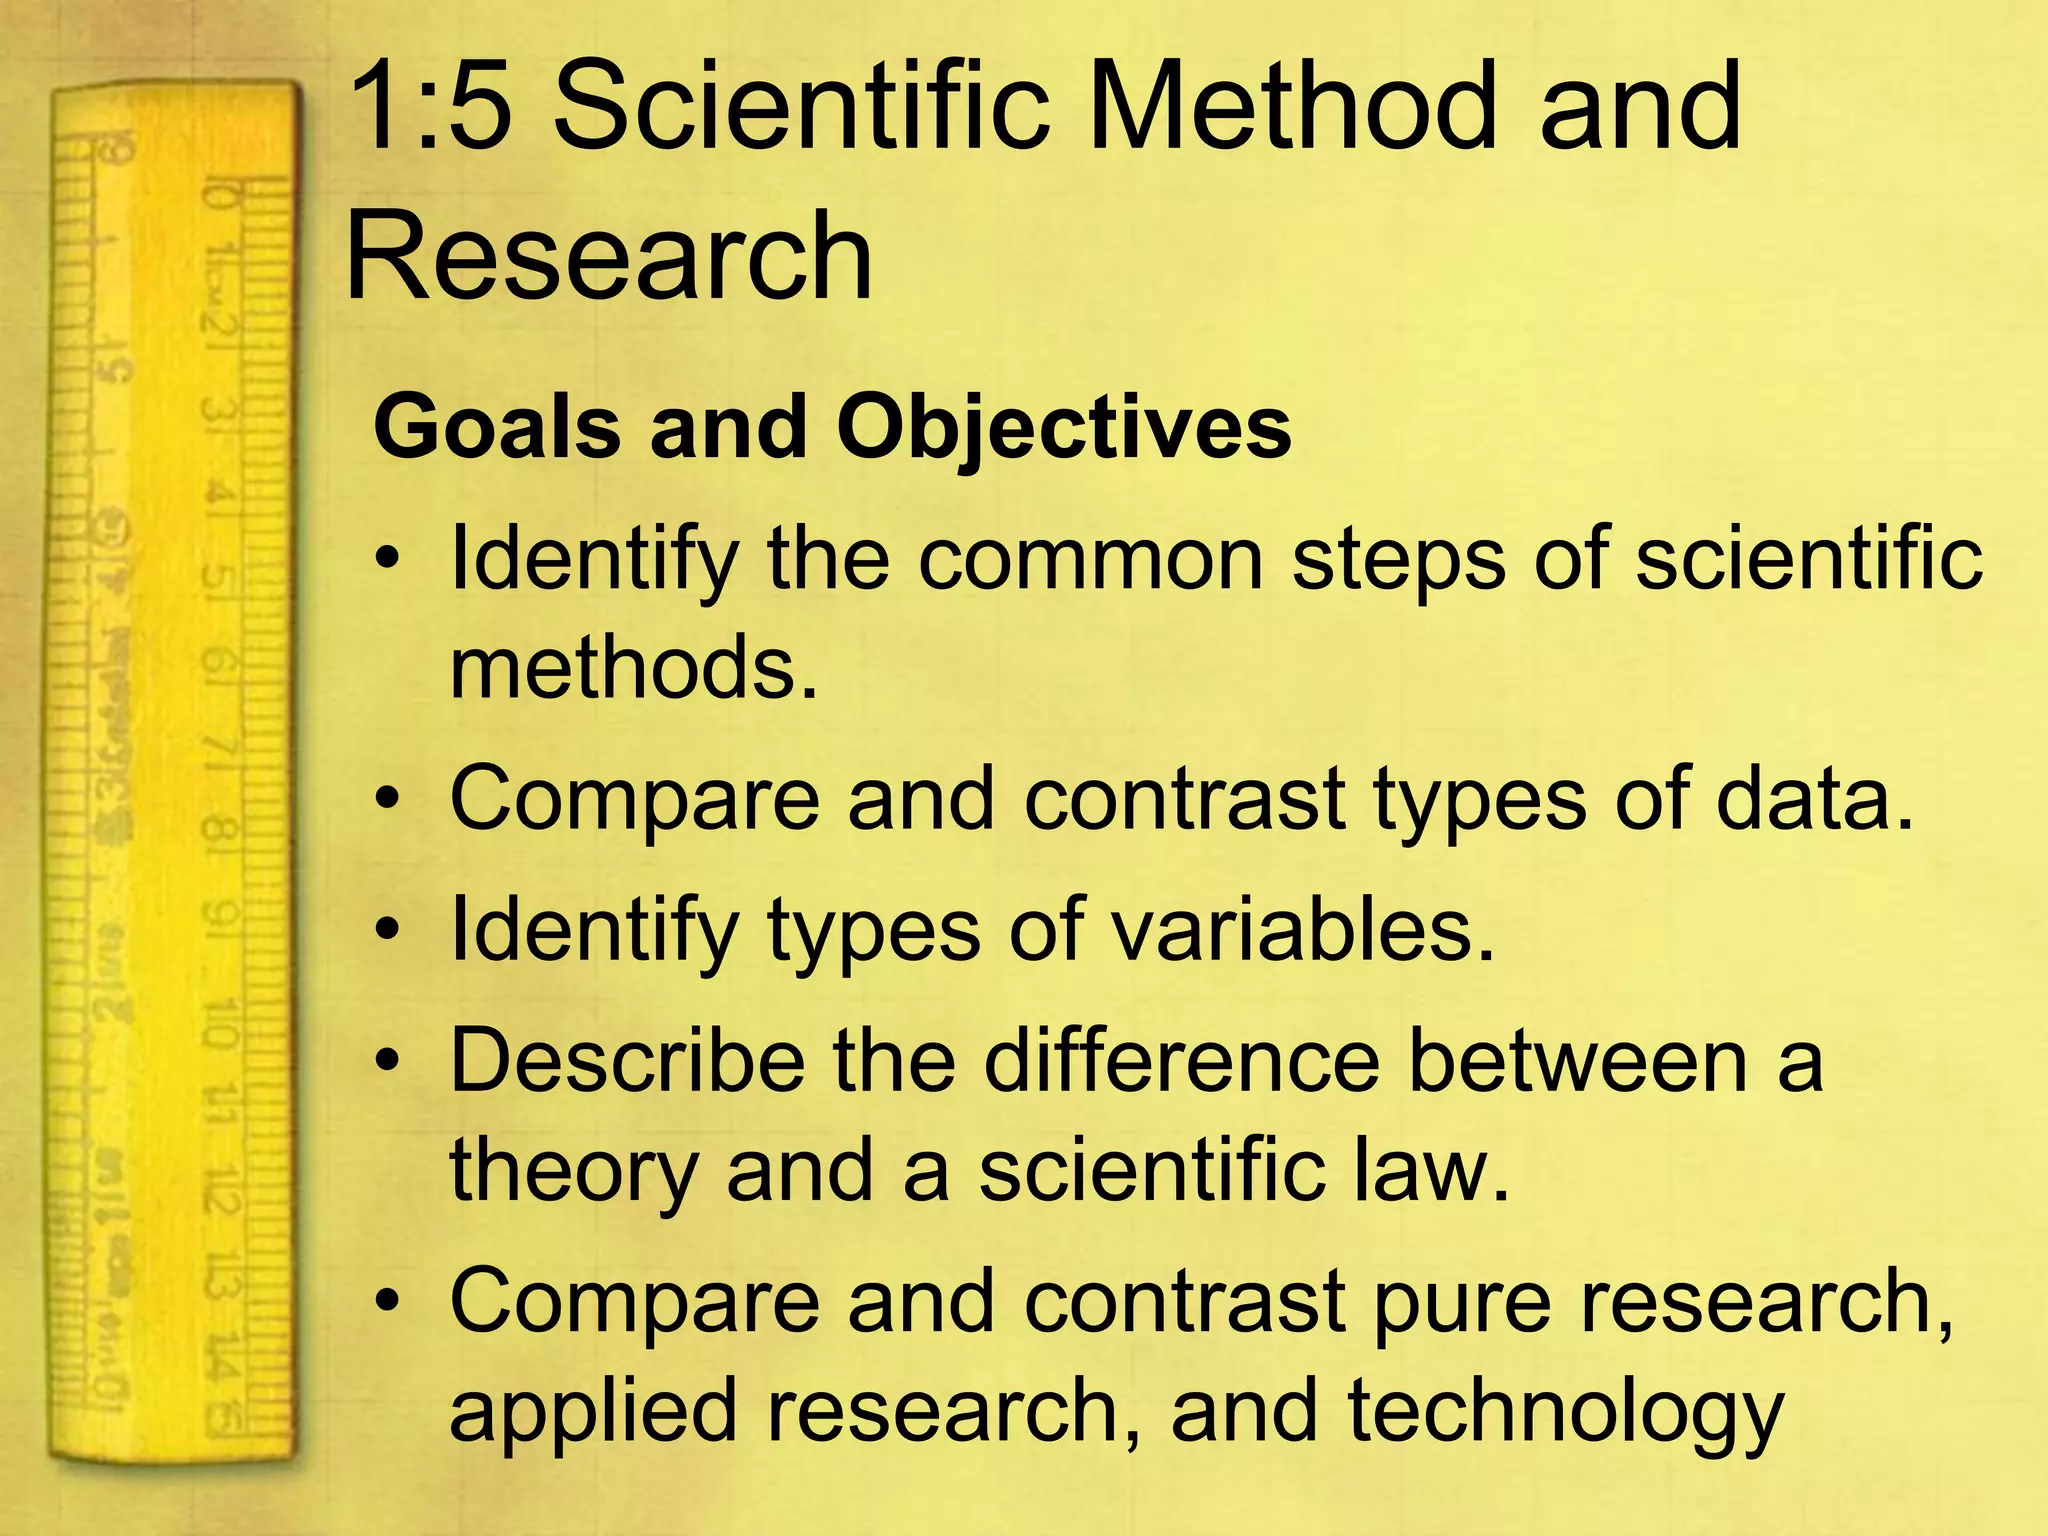
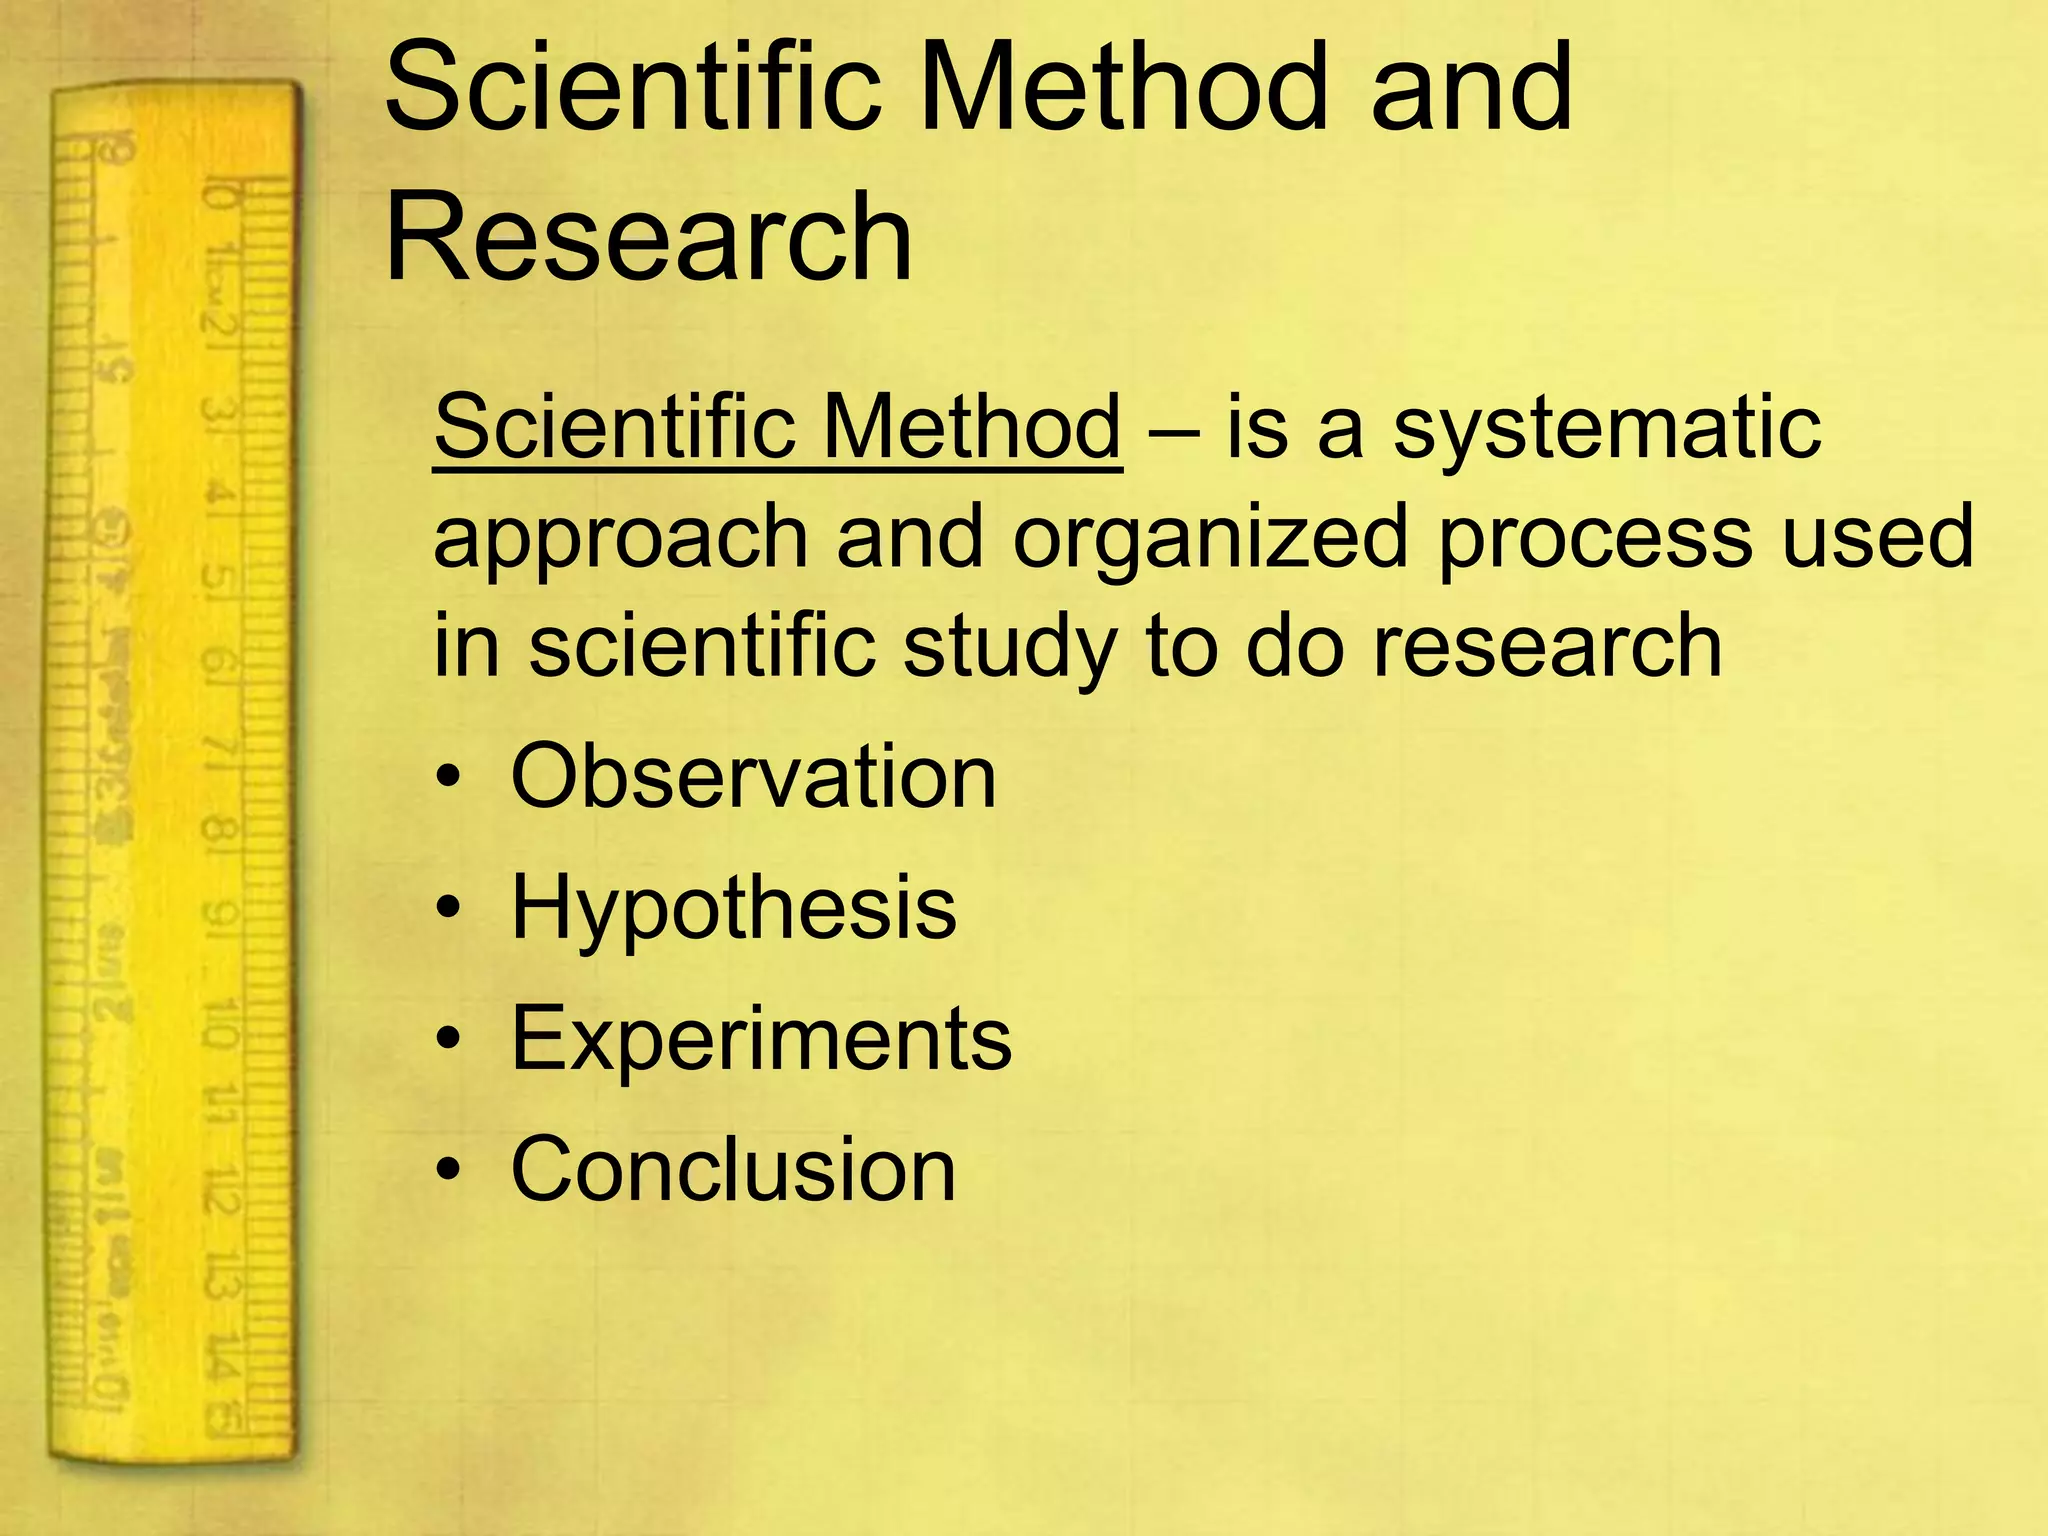
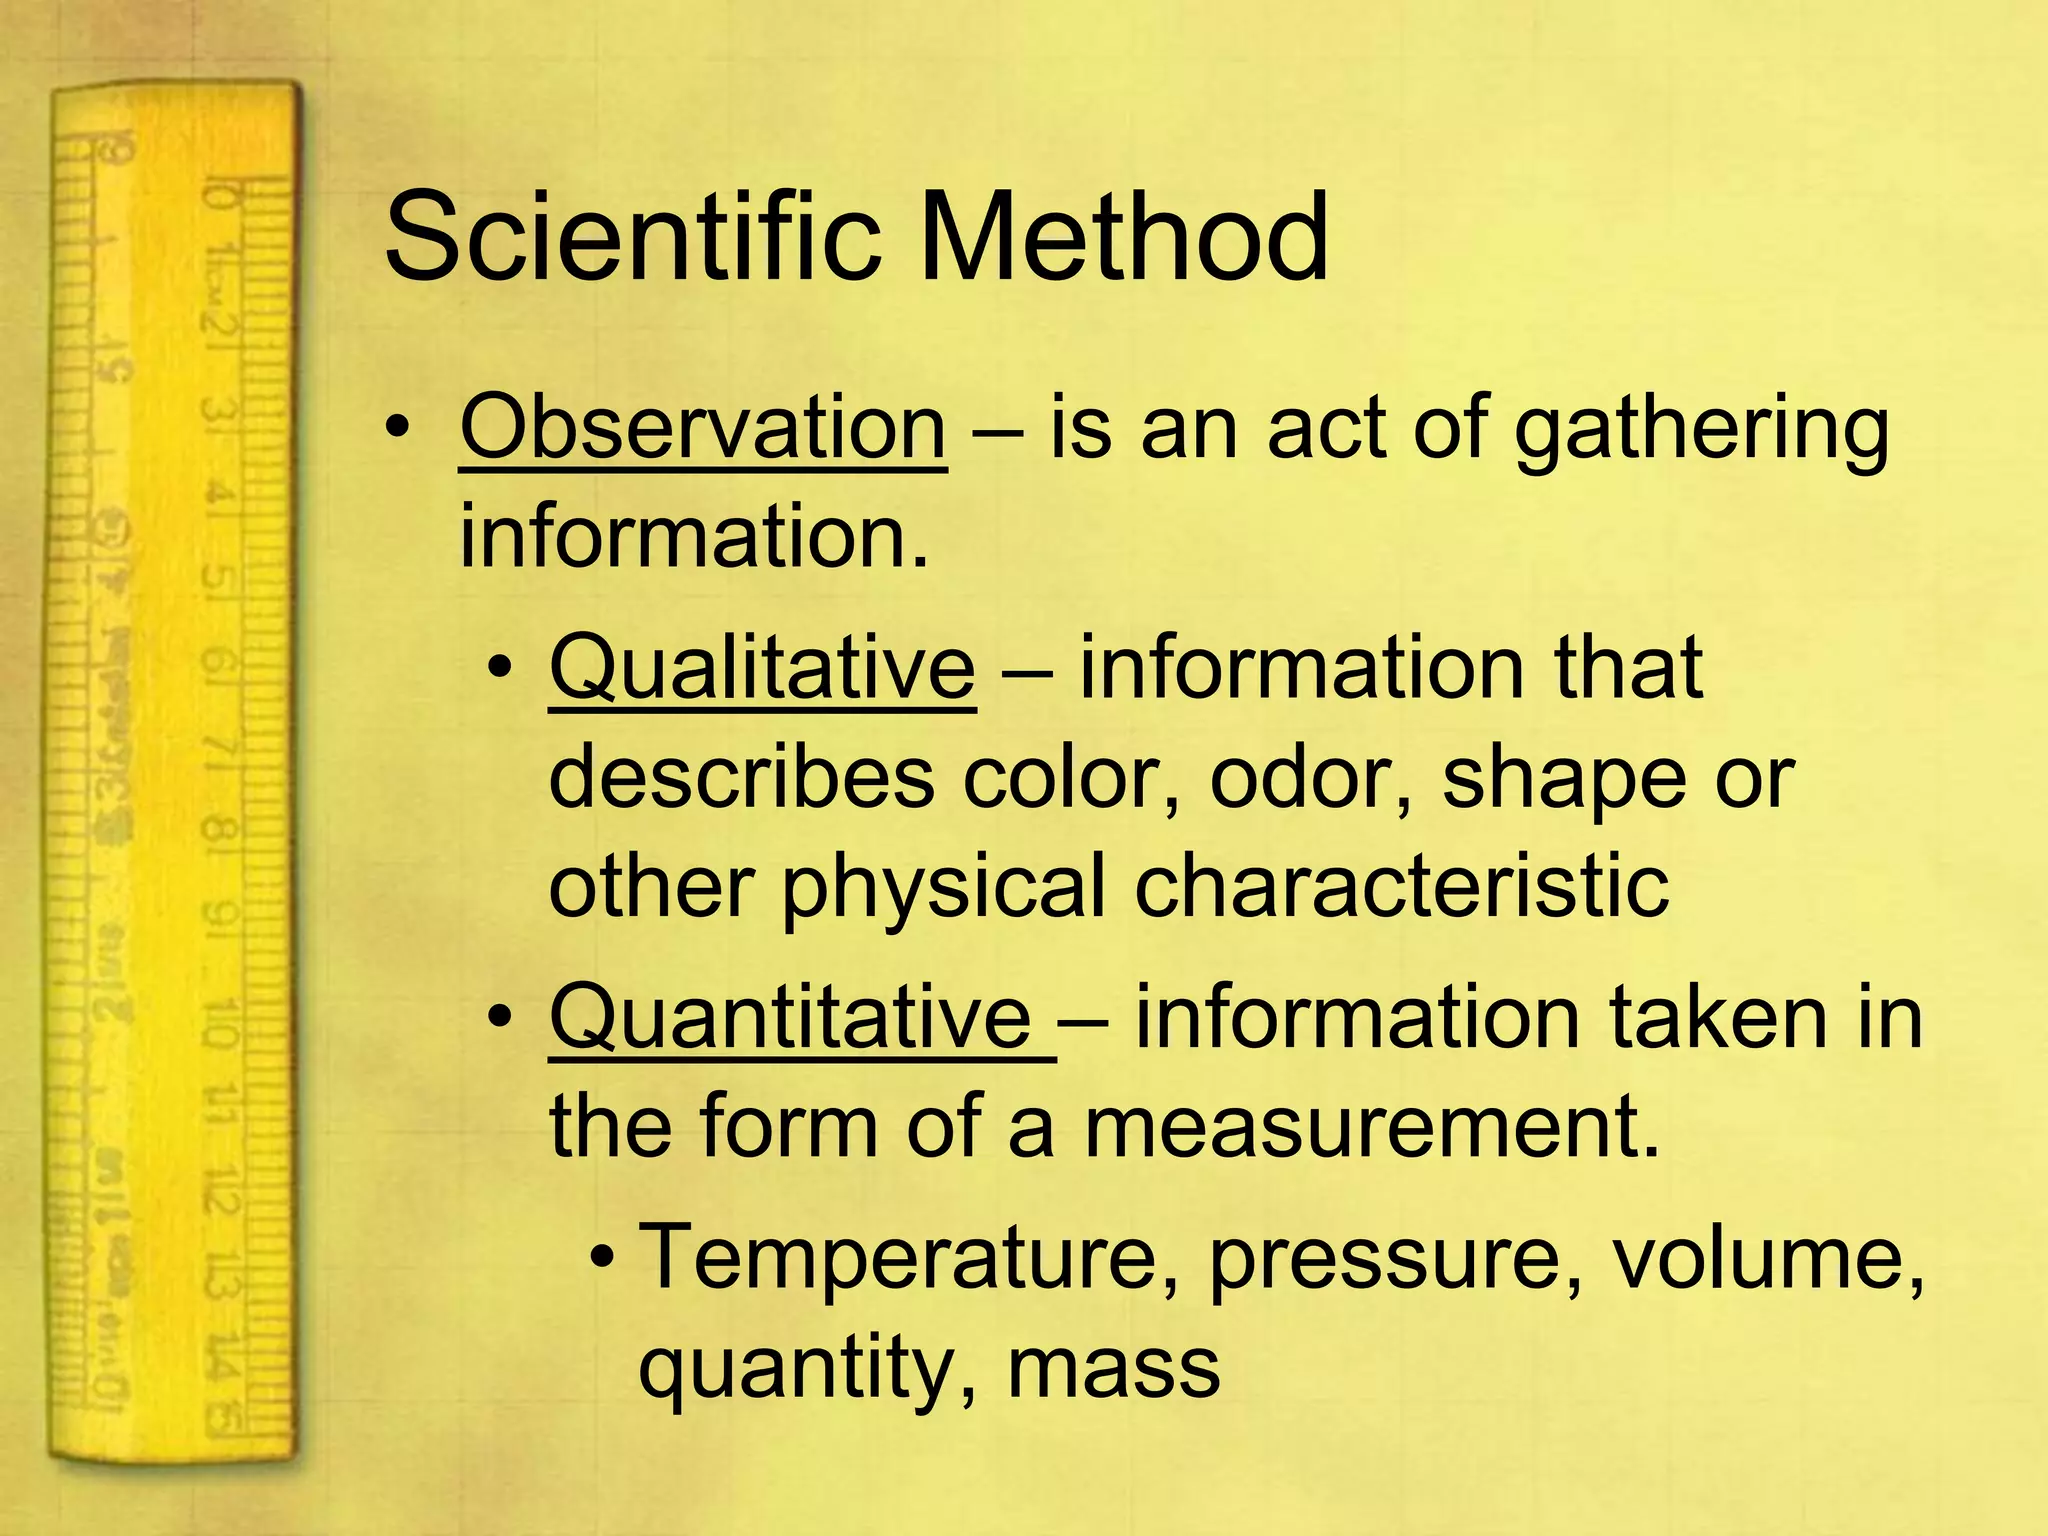
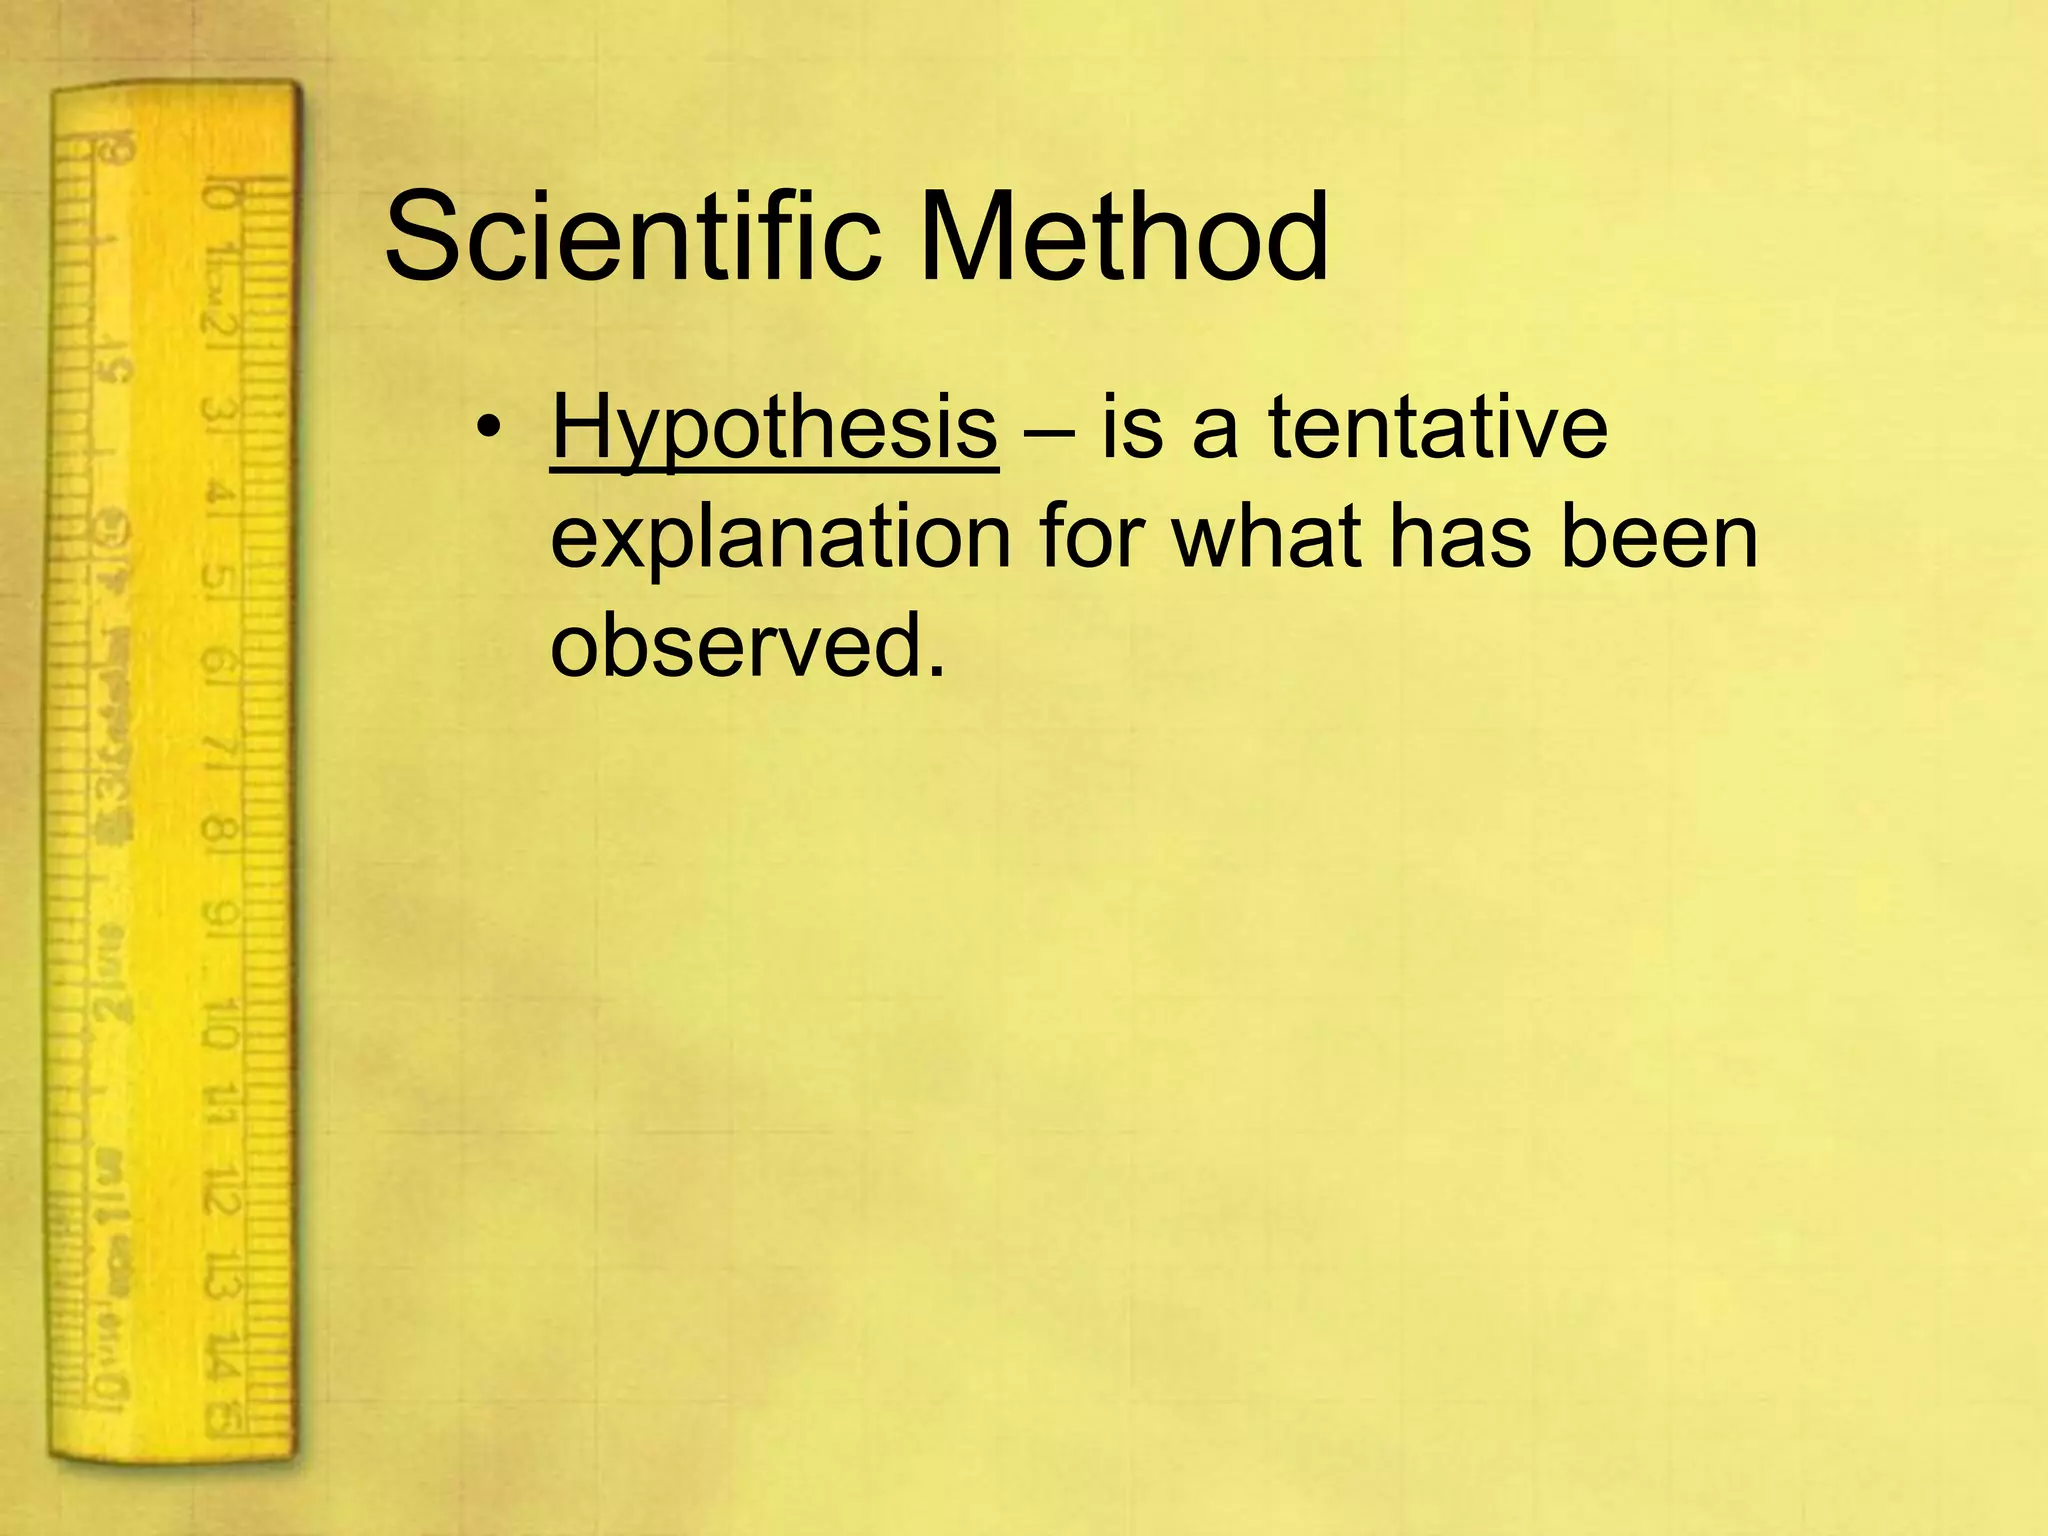
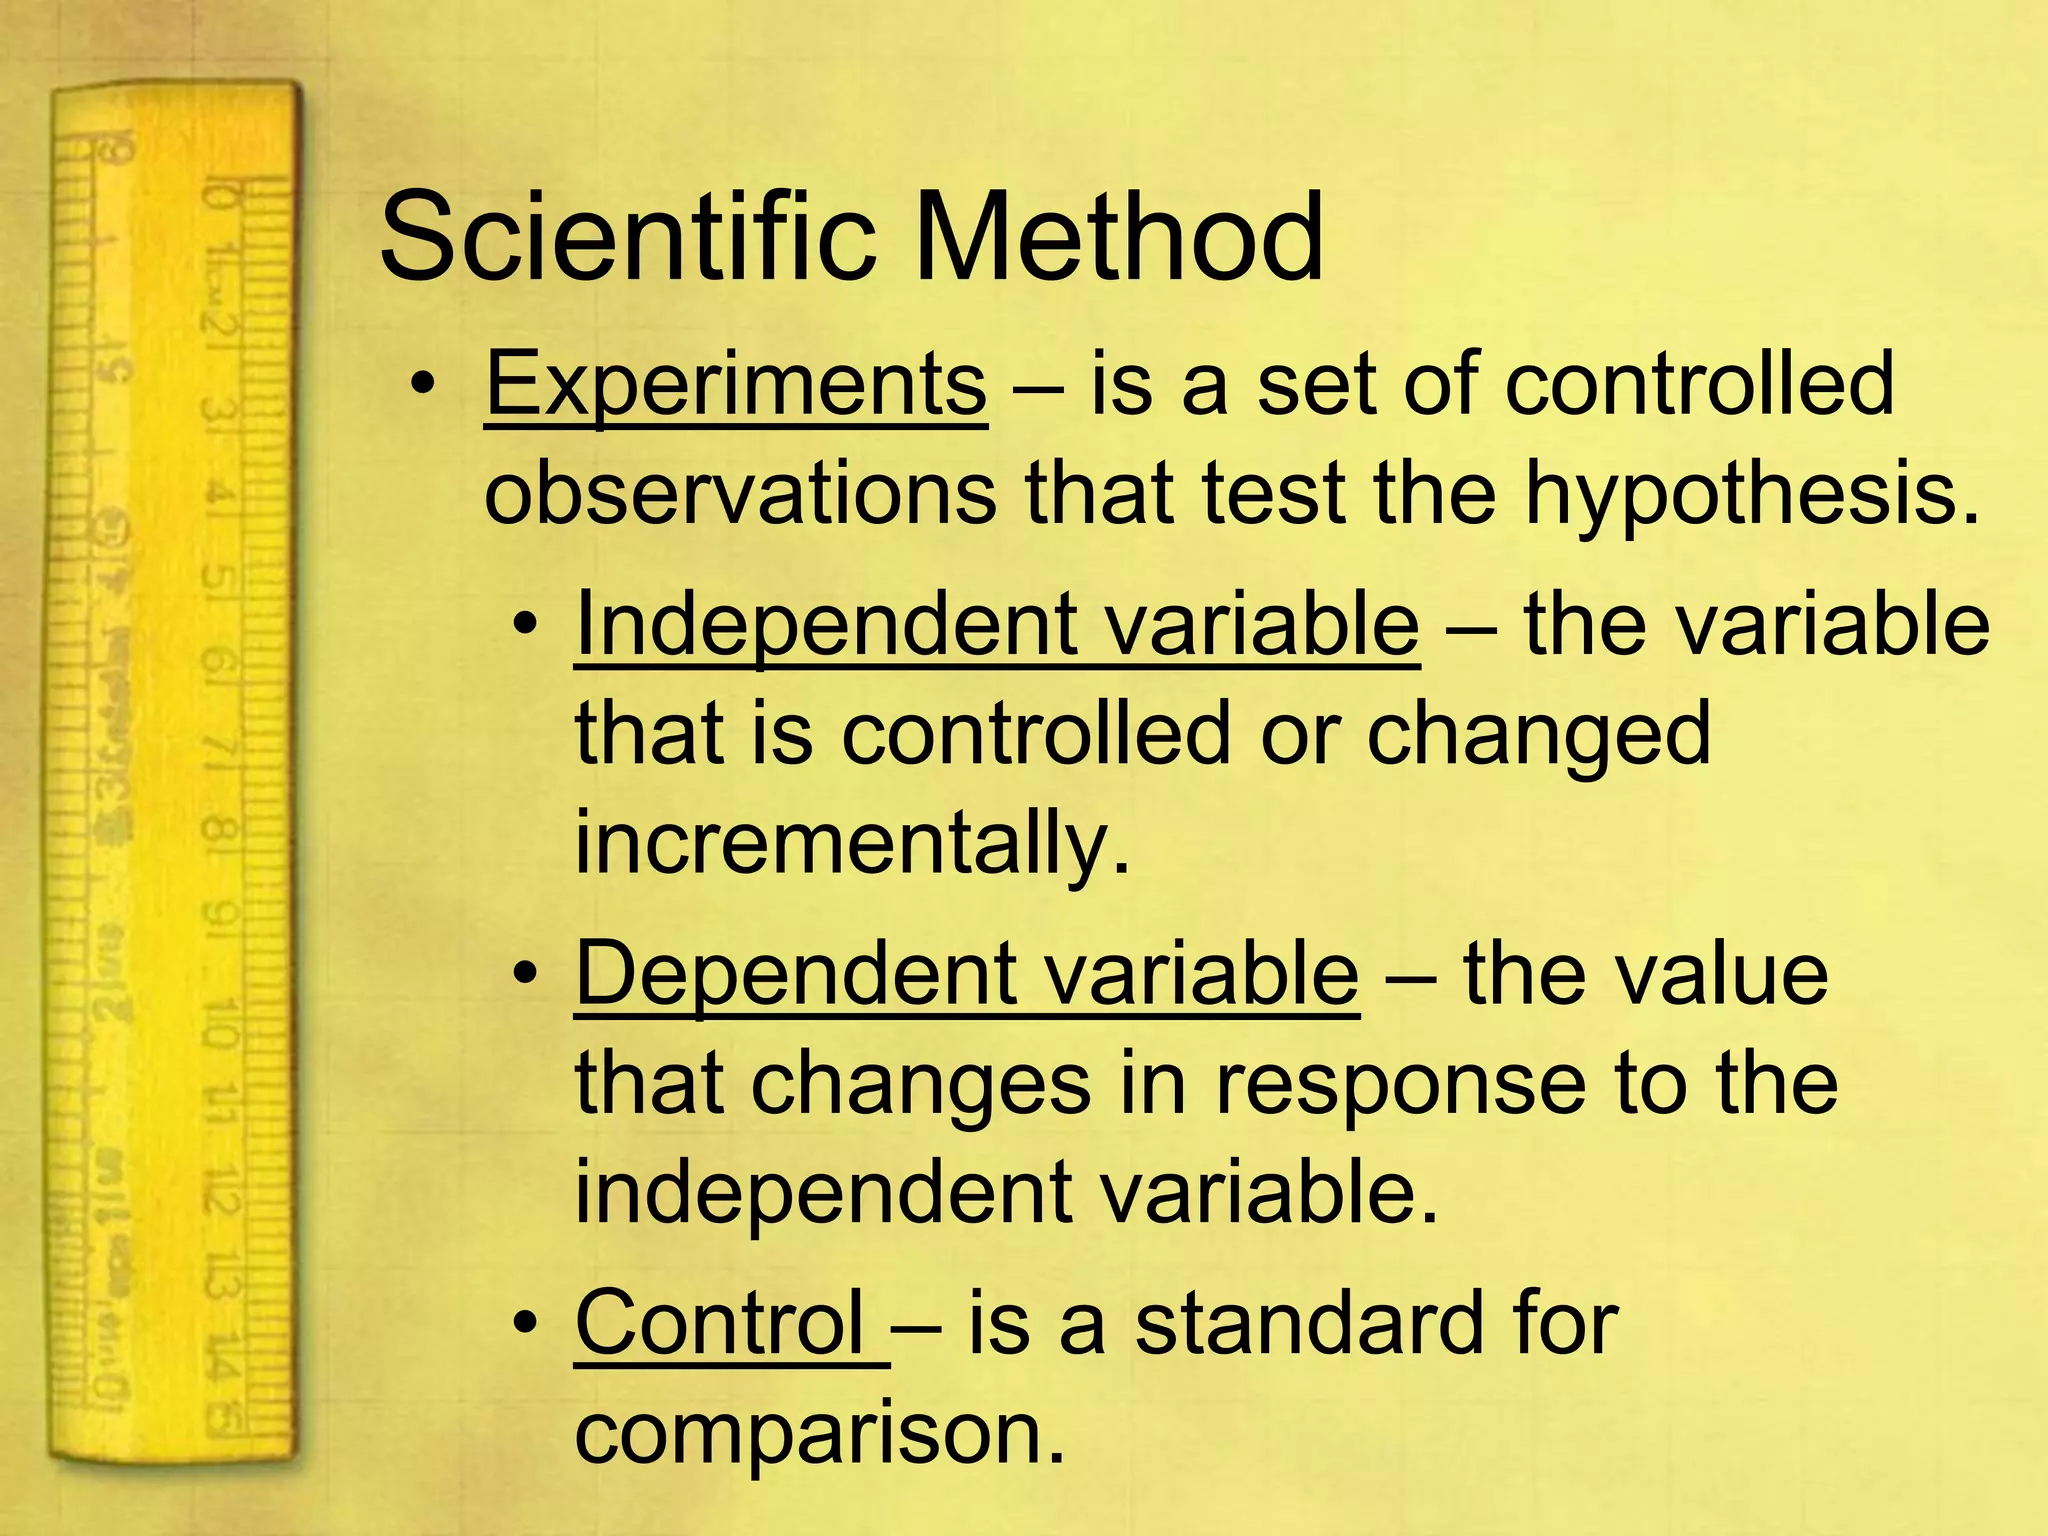
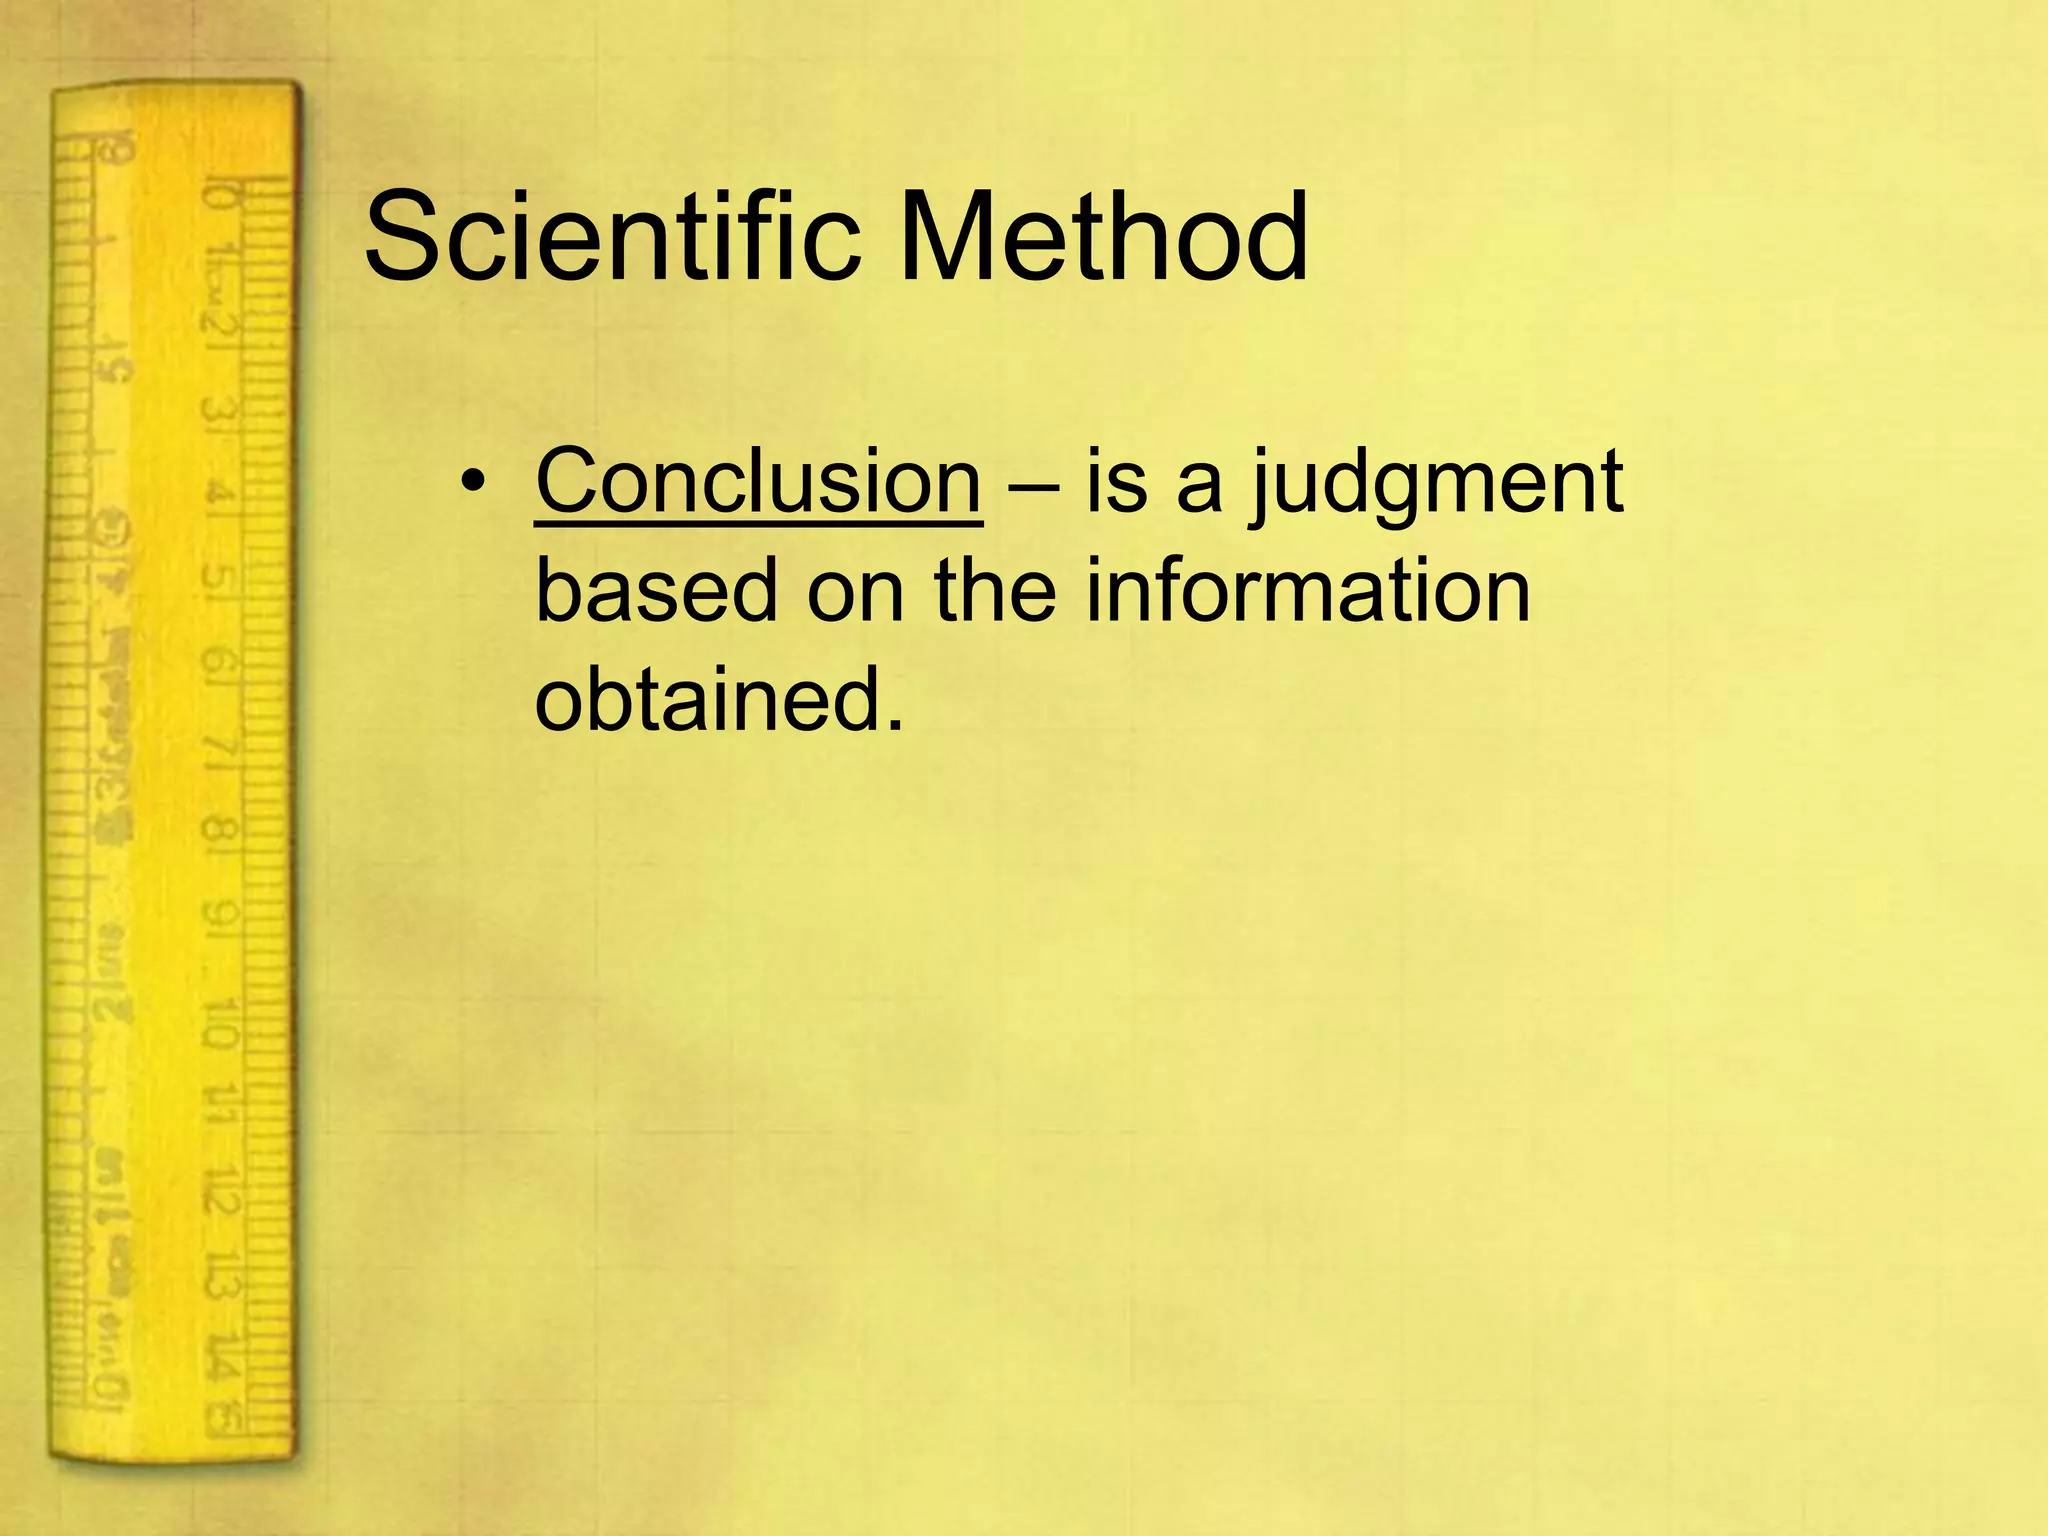
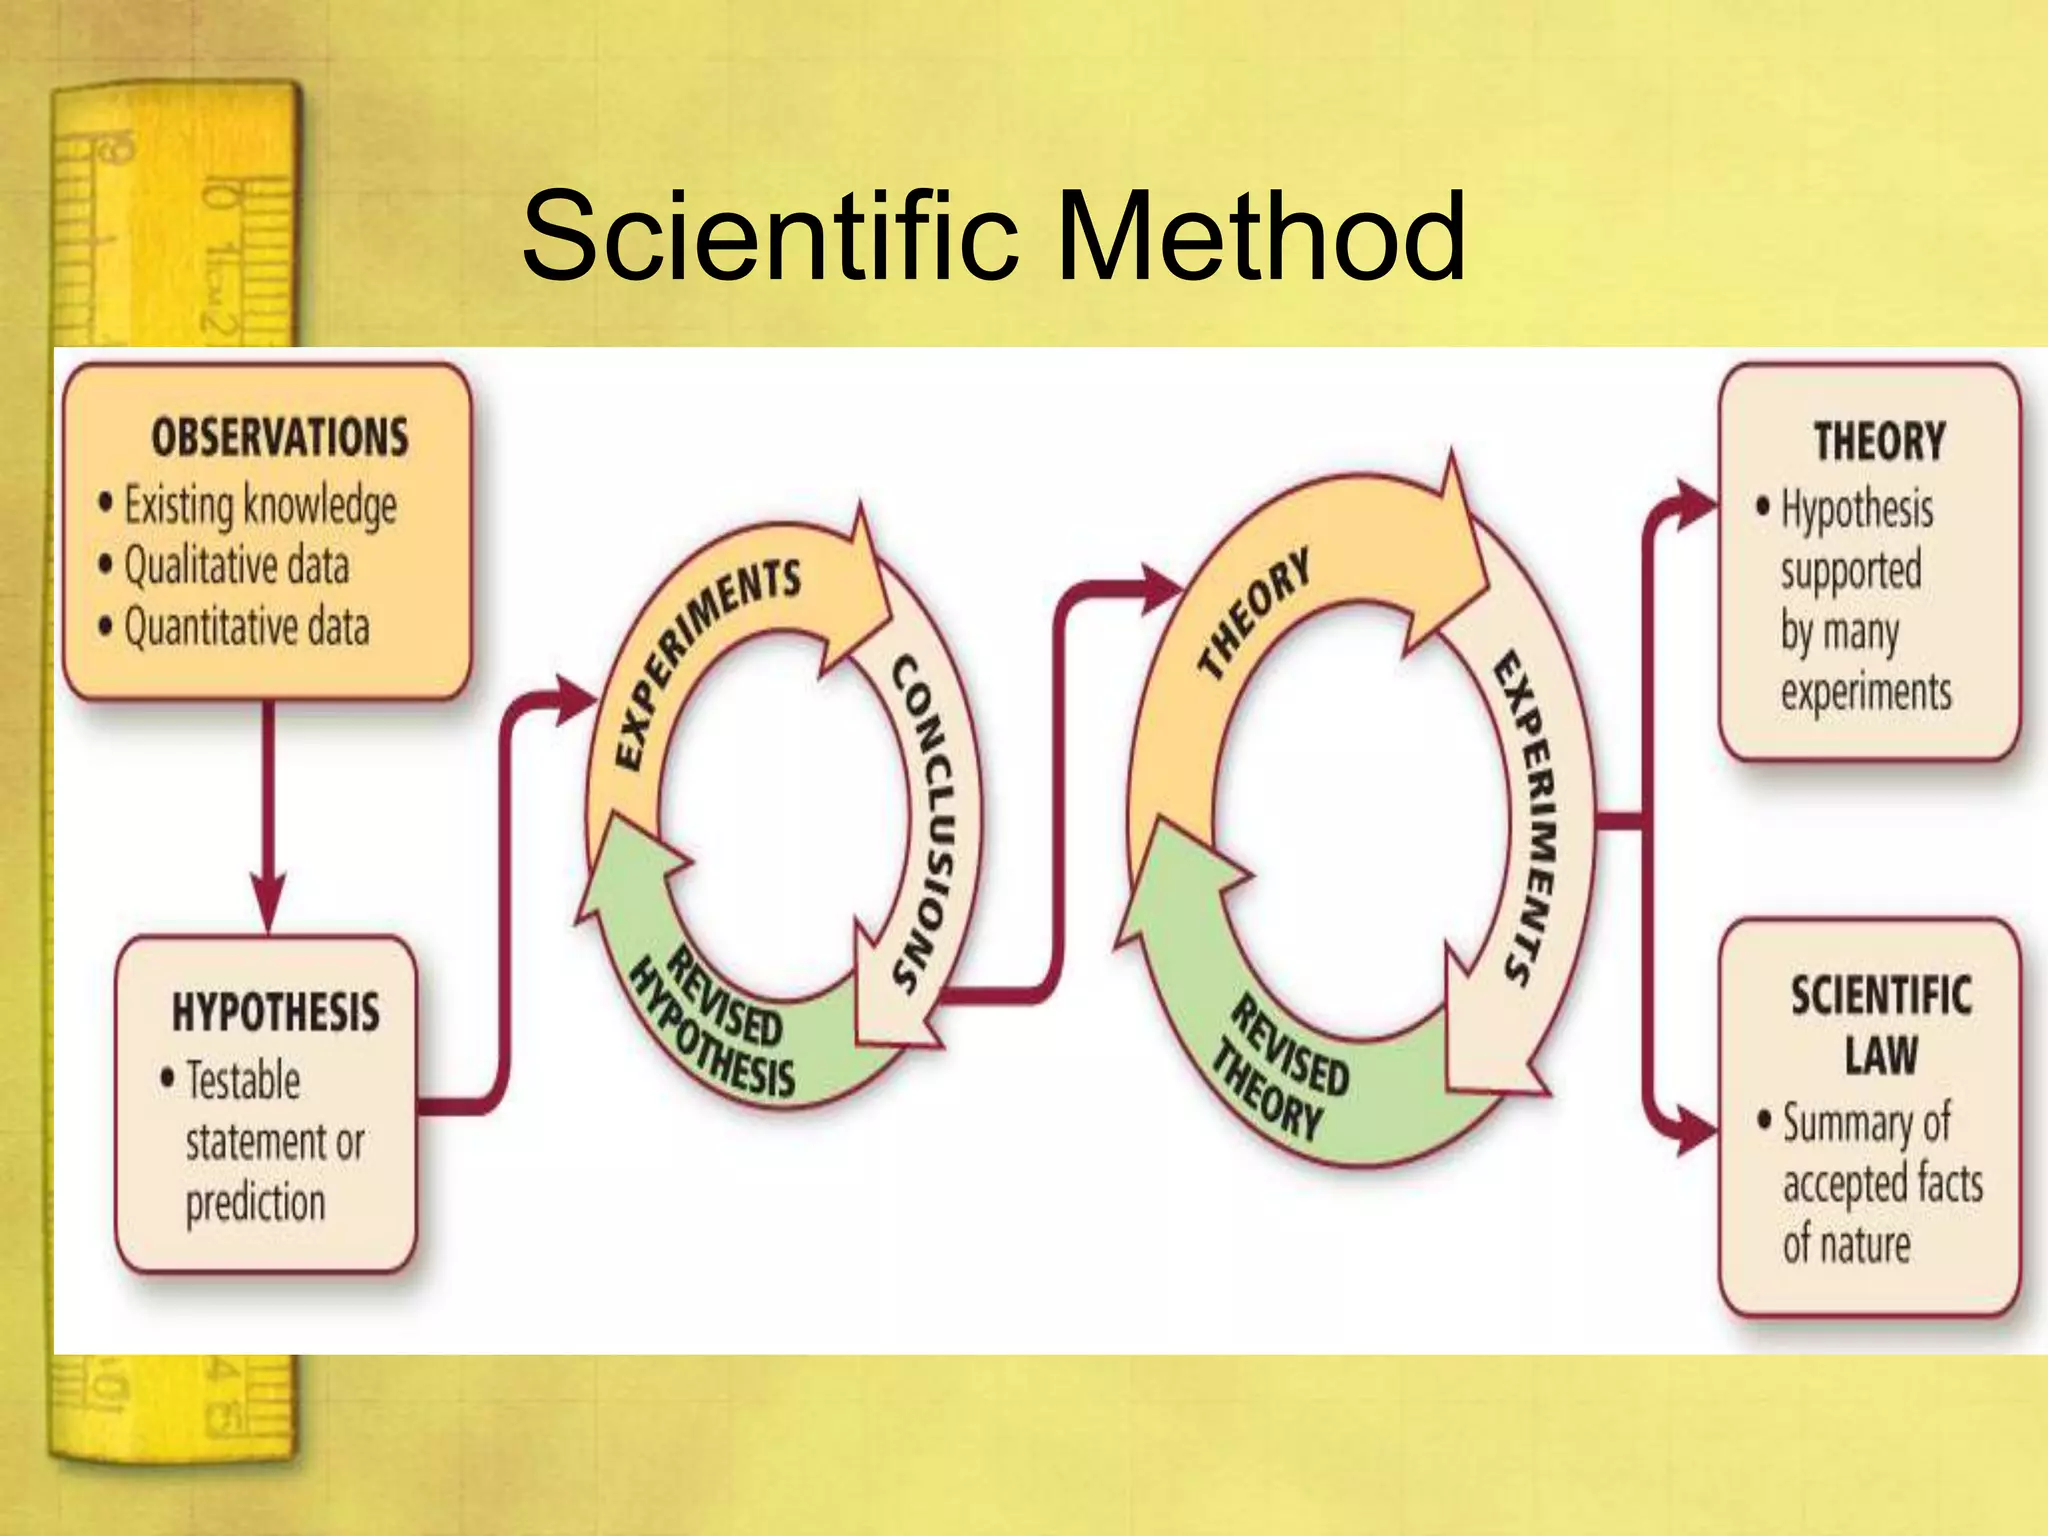
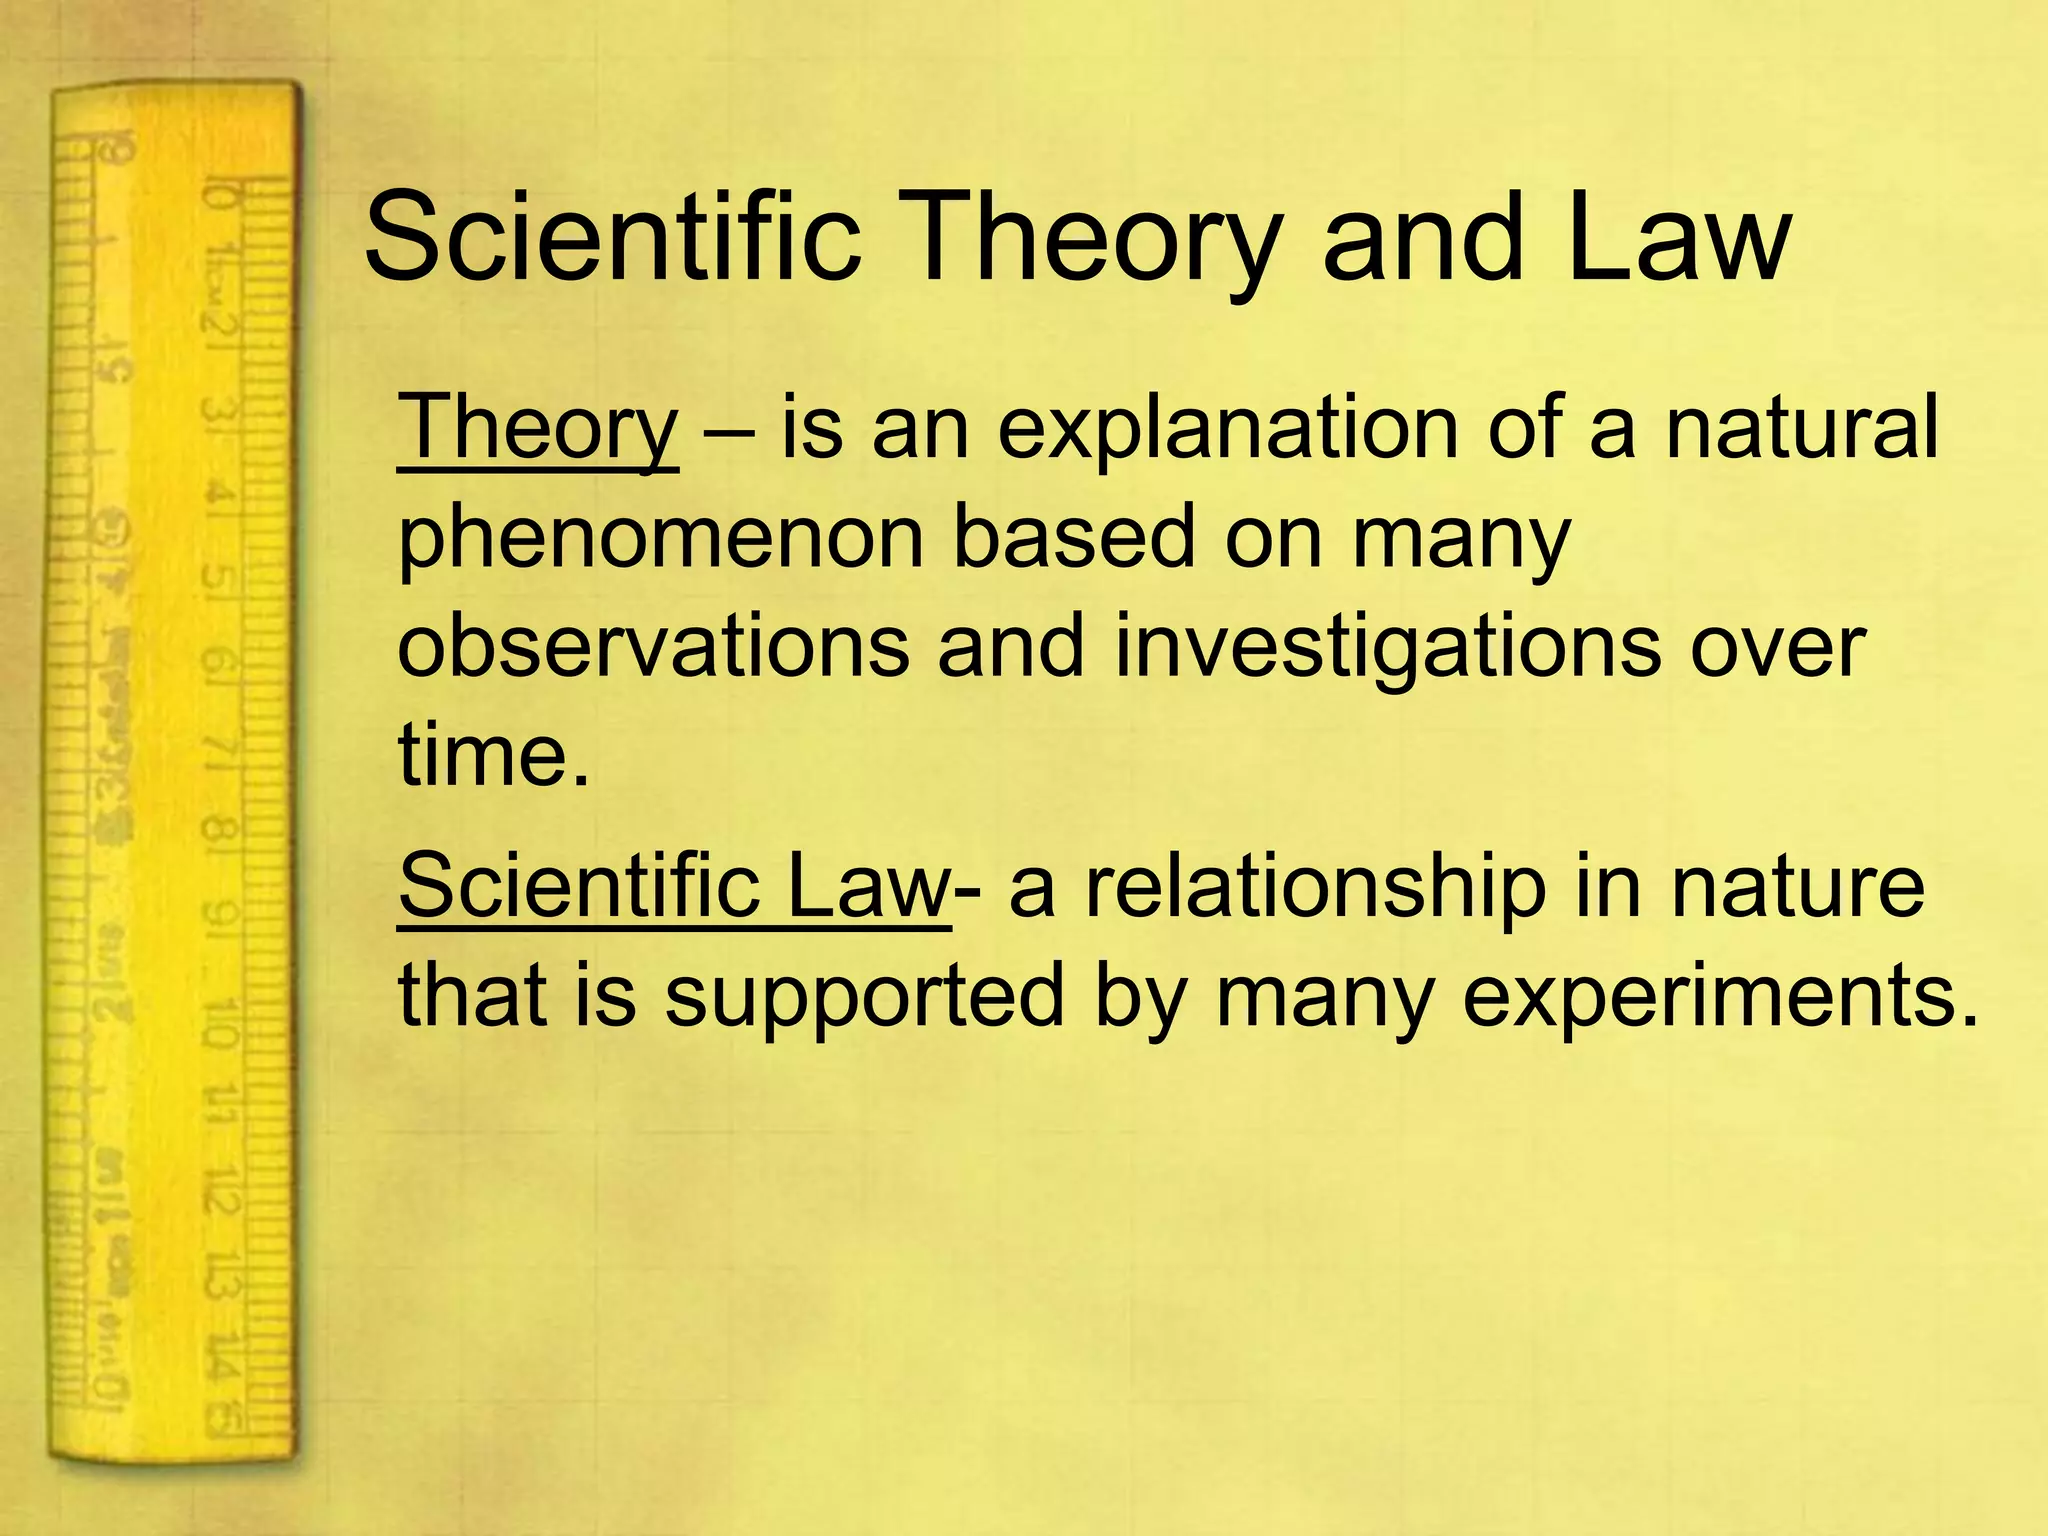
What is data and what can it tell us?Chemistry: Unit 1
What is data?
What can data tell us?
SkillsMetric Conversions
Dimensional Analysis
Graphing
Scientific Notation
Data Pattern Recognition
Calculations with Significant Figures1:1 Units and MeasurementsGoals and Objectives:Define SI base units for time, length, mass, and temperature.Explain how adding a prefix changes a unit.Compare the derived units for volume and density.
Units and MeasurementsBase unit – is a defined unit in a system of measurement that is based on an object.
SI Units
PrefixesObjective: Explain how adding a prefix changes a unit.How important are prefixes?
SI Unit Prefixes
Units and MeasurementsKelvin – The SI unit for temperature.  Based on Absolute Zero.Kelvin – Celsius Conversion EquationK = °C  +  273
Derived UnitDerived unit – a unit that is defined by a combination of base units.Examples:g/mlcm3m/s2
Derived UnitLiter – the SI unit for volume.1L = dm31ml = 1cm3
DensityDensity – is a physical property of matter and is defined a s the amount of mass per unit volume.D = m/v
Practice ProblemsCALM: Unit 1:1End 1:1
1:2 Scientific NotationGoals and Objectives:Express numbers in scientific notation.Convert between units using dimensional analysis.
Scientific NotationScientific notation – a method that conveniently restates a number without changing its value.Coefficient – is the first number in scientific notation. (1-10)Exponent – the multiplier of the coefficient by the power of 10.
Scientific NotationExample
Adding and Subtracting Scientific NotationExponents must be the same. Convert if necessary.Coefficients are added or subtracted.Change exponent to simplify answer.
Adding and Subtracting Scientific NotationExample
Multiplication and Division using Scientific NotationExponents do not need to be the same.Multiply or divide coefficientsWhen multiplying, add exponentsWhen dividing, subtract exponents. (divisor from dividend)
Multiplication and Division using Scientific NotationExample
Dimensional AnalysisDimensional Analysis – is a systematic approach to problem solving that uses conversion factors to move, or convert, from one unit to another.Example
Conversion FactorConversion Factor - Is a ratio of equivalent values having different units.Examples:1000m / 1km1 hr / 3600s 1 ml / 1 cm3
Practice ProblemsCALM: Unit 1:2End 1:2
1:3 Uncertainty in DataGoals and Objectives:Define and compare accuracy and precision.Describe the accuracy of experimental data using error and percent errorApply rules for significant figures to express uncertainty in measured and calculated values.
Uncertainty in DataAccuracy – is how close a measure value is to an accepted value.Precision - Is how close a series of measurements are to one another. The amount of uncertainty in a measurementMore precise = less uncertainty
Precision in MeasurementsWhen measuring any item, write all digits that are confirmed and one estimated digit.Example
ErrorError is the difference between an experimental value and an accepted value.Error = experimental value – accepted valueExample
Percent ErrorPercent error expresses error as a percentage of the accepted valuePercent error =
Significant FiguresRules for Significant DigitsNonzero digits are always significant.Zeroes are sometimes significant, and sometimes they are not.Zeroes at the beginning of a number (used just to position the decimal point) are never significant.Zeroes between nonzero digits are always significant.Zeroes at the end of a number that contains a decimal point are always significant.Zeroes at the end of a number that does not contain a decimal point may or may not be significant.Scientific notation is used to clarify these numbers.
Significant FiguresRules for Significant DigitsExact numbers can be considered as having an unlimited number of significant figures.  In addition and subtraction, the number of significant digits in the answer is determined by the least precise number in the calculation.The number of significant figures to the right of the decimal in the answer cannot exceed any of those in the calculation.In multiplication and division, the answer cannot have more significant digits than any number in the calculation.
Significant FiguresExamples
Rounding NumbersWhen rounding numbers to the proper number of significant digits, look to the right of the last significant digit.  1-4: round down the last sig fig5-9: round up the last sig fig.
Rounding NumbersExamples:54.3654 to 4 sig figs:To 3 sig figs:To 2 sig figs:To 1 sig fig:
Practice ProblemsCALM: 1:3
1:4 Representing DataGoals and ObjectivesCreate graphs to reveal patterns in data.Interpret graphs.Explain how chemists describe submicroscopic matter.
Representation of DataGraph is a visual display of dataCircle graphs (pie chart) – display parts of a whole.Bar graphs – shows how a quantity varies across categoriesLine graphs – most graphs used in chemistry
Rules for Good GraphingRules for Good Graphing on Paper:All graphs should be on graph paper. Identify the independent and dependent variables in your data.The independent variable is plotted on the horizontal axis (x-axis) and the dependent variable is plotted on the vertical axis (y-axis).Determine the range of the independent variable to be plotted. Spread the data out as much as possible.  Let each division on the graph paper stand for a convenient unit.  This usually means units that are multiples of 2, 5 or 10…etc.
Rules for Good GraphingRules for Good Graphing on Paper:Number and label the horizontal axis.   The label should include units.Repeat steps 2. through 4. for the dependent variable.Plot the data points on the graph.Draw the best-fit straight or smooth curve line that passes through as many points as possible.  Do not use a series of straight-line segments to connect the dots.  Give the graph a title that clearly tells what the graph represents (y vs. x values).
Rules for Good GraphingRules for Good Graphing on the Computer:From the insert menu on the Microsoft word program choose insert chart.Identify the independent and dependent variables in your data.The independent variable is plotted on the horizontal axis (x-axis) and the dependent variable is plotted on the vertical axis (y-axis).Insert data in the excel window that opens.  Be sure to pay attention to the excel column vs. graph axes location.Through the toolbox menu, give the graph a title that clearly tells what the graph represents. (y vs. x  variable). Through the toolbox menu, give the axes in the graph labels that include units.
Representing DataLinear relationship – variables are proportionally relatedLine of best-fit is a straight line but is not perfectly horizontal or vertical.
Representing DataSlope – is equal to the change in y divided by the change in xRise/runΔy/Δx
Representing DataInterpolation – the reading of a value from any point that falls between recorded data pointsWhen points on a line graph are connected, the data is considered to be continuous.
Representing DataExtrapolation – the process of estimating values beyond the plotted points.The line of best fit is extended beyond the scope of the data
Representing DataModel – is a visual, verbal or mathematical explanation of experimental data.  Example
Practice ProblemsNo homeworkEnd 1:4
1:5 Scientific Method and ResearchGoals and ObjectivesIdentify the common steps of scientific methods.Compare and contrast types of data.Identify types of variables.Describe the difference between a theory and a scientific law.Compare and contrast pure research, applied research, and technology
Scientific Method and ResearchScientific Method – is a systematic approach and organized process used in scientific study to do researchObservationHypothesisExperimentsConclusion
Scientific MethodObservation – is an act of gathering information.Qualitative – information that describes color, odor, shape or other physical characteristicQuantitative – information taken in the form of a measurement.Temperature, pressure, volume, quantity, mass
Scientific MethodHypothesis – is a tentative explanation for what has been observed.
Scientific MethodExperiments – is a set of controlled observations that test the hypothesis.Independent variable – the variable that is controlled or changed incrementally.Dependent variable – the value that changes in response to the independent variable. Control – is a standard for comparison.
Scientific MethodConclusion – is a judgment based on the information obtained.
Scientific Method
Scientific Theory and LawTheory – is an explanation of a natural phenomenon based on many observations and investigations over time.  Scientific Law- a relationship in nature that is supported by many experiments.
Scientific ResearchPure research – is done to gain knowledge for the sake of knowledge itself.Applied research – is research undertaken to solve a specific problem

Chem unit 1 presentation

  • 1.
    What is dataand what can it tell us?Chemistry: Unit 1
  • 2.
  • 3.
  • 4.
  • 5.
  • 6.
  • 7.
  • 8.
  • 9.
    Calculations with SignificantFigures1:1 Units and MeasurementsGoals and Objectives:Define SI base units for time, length, mass, and temperature.Explain how adding a prefix changes a unit.Compare the derived units for volume and density.
  • 10.
    Units and MeasurementsBaseunit – is a defined unit in a system of measurement that is based on an object.
  • 11.
  • 12.
    PrefixesObjective: Explain howadding a prefix changes a unit.How important are prefixes?
  • 13.
  • 14.
    Units and MeasurementsKelvin– The SI unit for temperature. Based on Absolute Zero.Kelvin – Celsius Conversion EquationK = °C + 273
  • 15.
    Derived UnitDerived unit– a unit that is defined by a combination of base units.Examples:g/mlcm3m/s2
  • 16.
    Derived UnitLiter –the SI unit for volume.1L = dm31ml = 1cm3
  • 17.
    DensityDensity – isa physical property of matter and is defined a s the amount of mass per unit volume.D = m/v
  • 18.
  • 19.
    1:2 Scientific NotationGoalsand Objectives:Express numbers in scientific notation.Convert between units using dimensional analysis.
  • 20.
    Scientific NotationScientific notation– a method that conveniently restates a number without changing its value.Coefficient – is the first number in scientific notation. (1-10)Exponent – the multiplier of the coefficient by the power of 10.
  • 21.
  • 22.
    Adding and SubtractingScientific NotationExponents must be the same. Convert if necessary.Coefficients are added or subtracted.Change exponent to simplify answer.
  • 23.
    Adding and SubtractingScientific NotationExample
  • 24.
    Multiplication and Divisionusing Scientific NotationExponents do not need to be the same.Multiply or divide coefficientsWhen multiplying, add exponentsWhen dividing, subtract exponents. (divisor from dividend)
  • 25.
    Multiplication and Divisionusing Scientific NotationExample
  • 26.
    Dimensional AnalysisDimensional Analysis– is a systematic approach to problem solving that uses conversion factors to move, or convert, from one unit to another.Example
  • 27.
    Conversion FactorConversion Factor- Is a ratio of equivalent values having different units.Examples:1000m / 1km1 hr / 3600s 1 ml / 1 cm3
  • 28.
  • 29.
    1:3 Uncertainty inDataGoals and Objectives:Define and compare accuracy and precision.Describe the accuracy of experimental data using error and percent errorApply rules for significant figures to express uncertainty in measured and calculated values.
  • 30.
    Uncertainty in DataAccuracy– is how close a measure value is to an accepted value.Precision - Is how close a series of measurements are to one another. The amount of uncertainty in a measurementMore precise = less uncertainty
  • 31.
    Precision in MeasurementsWhenmeasuring any item, write all digits that are confirmed and one estimated digit.Example
  • 32.
    ErrorError is thedifference between an experimental value and an accepted value.Error = experimental value – accepted valueExample
  • 33.
    Percent ErrorPercent errorexpresses error as a percentage of the accepted valuePercent error =
  • 34.
    Significant FiguresRules forSignificant DigitsNonzero digits are always significant.Zeroes are sometimes significant, and sometimes they are not.Zeroes at the beginning of a number (used just to position the decimal point) are never significant.Zeroes between nonzero digits are always significant.Zeroes at the end of a number that contains a decimal point are always significant.Zeroes at the end of a number that does not contain a decimal point may or may not be significant.Scientific notation is used to clarify these numbers.
  • 35.
    Significant FiguresRules forSignificant DigitsExact numbers can be considered as having an unlimited number of significant figures. In addition and subtraction, the number of significant digits in the answer is determined by the least precise number in the calculation.The number of significant figures to the right of the decimal in the answer cannot exceed any of those in the calculation.In multiplication and division, the answer cannot have more significant digits than any number in the calculation.
  • 36.
  • 37.
    Rounding NumbersWhen roundingnumbers to the proper number of significant digits, look to the right of the last significant digit. 1-4: round down the last sig fig5-9: round up the last sig fig.
  • 38.
    Rounding NumbersExamples:54.3654 to4 sig figs:To 3 sig figs:To 2 sig figs:To 1 sig fig:
  • 39.
  • 40.
    1:4 Representing DataGoalsand ObjectivesCreate graphs to reveal patterns in data.Interpret graphs.Explain how chemists describe submicroscopic matter.
  • 41.
    Representation of DataGraphis a visual display of dataCircle graphs (pie chart) – display parts of a whole.Bar graphs – shows how a quantity varies across categoriesLine graphs – most graphs used in chemistry
  • 42.
    Rules for GoodGraphingRules for Good Graphing on Paper:All graphs should be on graph paper. Identify the independent and dependent variables in your data.The independent variable is plotted on the horizontal axis (x-axis) and the dependent variable is plotted on the vertical axis (y-axis).Determine the range of the independent variable to be plotted. Spread the data out as much as possible. Let each division on the graph paper stand for a convenient unit. This usually means units that are multiples of 2, 5 or 10…etc.
  • 43.
    Rules for GoodGraphingRules for Good Graphing on Paper:Number and label the horizontal axis. The label should include units.Repeat steps 2. through 4. for the dependent variable.Plot the data points on the graph.Draw the best-fit straight or smooth curve line that passes through as many points as possible. Do not use a series of straight-line segments to connect the dots. Give the graph a title that clearly tells what the graph represents (y vs. x values).
  • 44.
    Rules for GoodGraphingRules for Good Graphing on the Computer:From the insert menu on the Microsoft word program choose insert chart.Identify the independent and dependent variables in your data.The independent variable is plotted on the horizontal axis (x-axis) and the dependent variable is plotted on the vertical axis (y-axis).Insert data in the excel window that opens. Be sure to pay attention to the excel column vs. graph axes location.Through the toolbox menu, give the graph a title that clearly tells what the graph represents. (y vs. x variable). Through the toolbox menu, give the axes in the graph labels that include units.
  • 45.
    Representing DataLinear relationship– variables are proportionally relatedLine of best-fit is a straight line but is not perfectly horizontal or vertical.
  • 46.
    Representing DataSlope –is equal to the change in y divided by the change in xRise/runΔy/Δx
  • 47.
    Representing DataInterpolation –the reading of a value from any point that falls between recorded data pointsWhen points on a line graph are connected, the data is considered to be continuous.
  • 48.
    Representing DataExtrapolation –the process of estimating values beyond the plotted points.The line of best fit is extended beyond the scope of the data
  • 49.
    Representing DataModel –is a visual, verbal or mathematical explanation of experimental data. Example
  • 50.
  • 51.
    1:5 Scientific Methodand ResearchGoals and ObjectivesIdentify the common steps of scientific methods.Compare and contrast types of data.Identify types of variables.Describe the difference between a theory and a scientific law.Compare and contrast pure research, applied research, and technology
  • 52.
    Scientific Method andResearchScientific Method – is a systematic approach and organized process used in scientific study to do researchObservationHypothesisExperimentsConclusion
  • 53.
    Scientific MethodObservation –is an act of gathering information.Qualitative – information that describes color, odor, shape or other physical characteristicQuantitative – information taken in the form of a measurement.Temperature, pressure, volume, quantity, mass
  • 54.
    Scientific MethodHypothesis –is a tentative explanation for what has been observed.
  • 55.
    Scientific MethodExperiments –is a set of controlled observations that test the hypothesis.Independent variable – the variable that is controlled or changed incrementally.Dependent variable – the value that changes in response to the independent variable. Control – is a standard for comparison.
  • 56.
    Scientific MethodConclusion –is a judgment based on the information obtained.
  • 57.
  • 58.
    Scientific Theory andLawTheory – is an explanation of a natural phenomenon based on many observations and investigations over time. Scientific Law- a relationship in nature that is supported by many experiments.
  • 59.
    Scientific ResearchPure research– is done to gain knowledge for the sake of knowledge itself.Applied research – is research undertaken to solve a specific problem
  • 60.
  • 61.
  • 62.
  • 63.