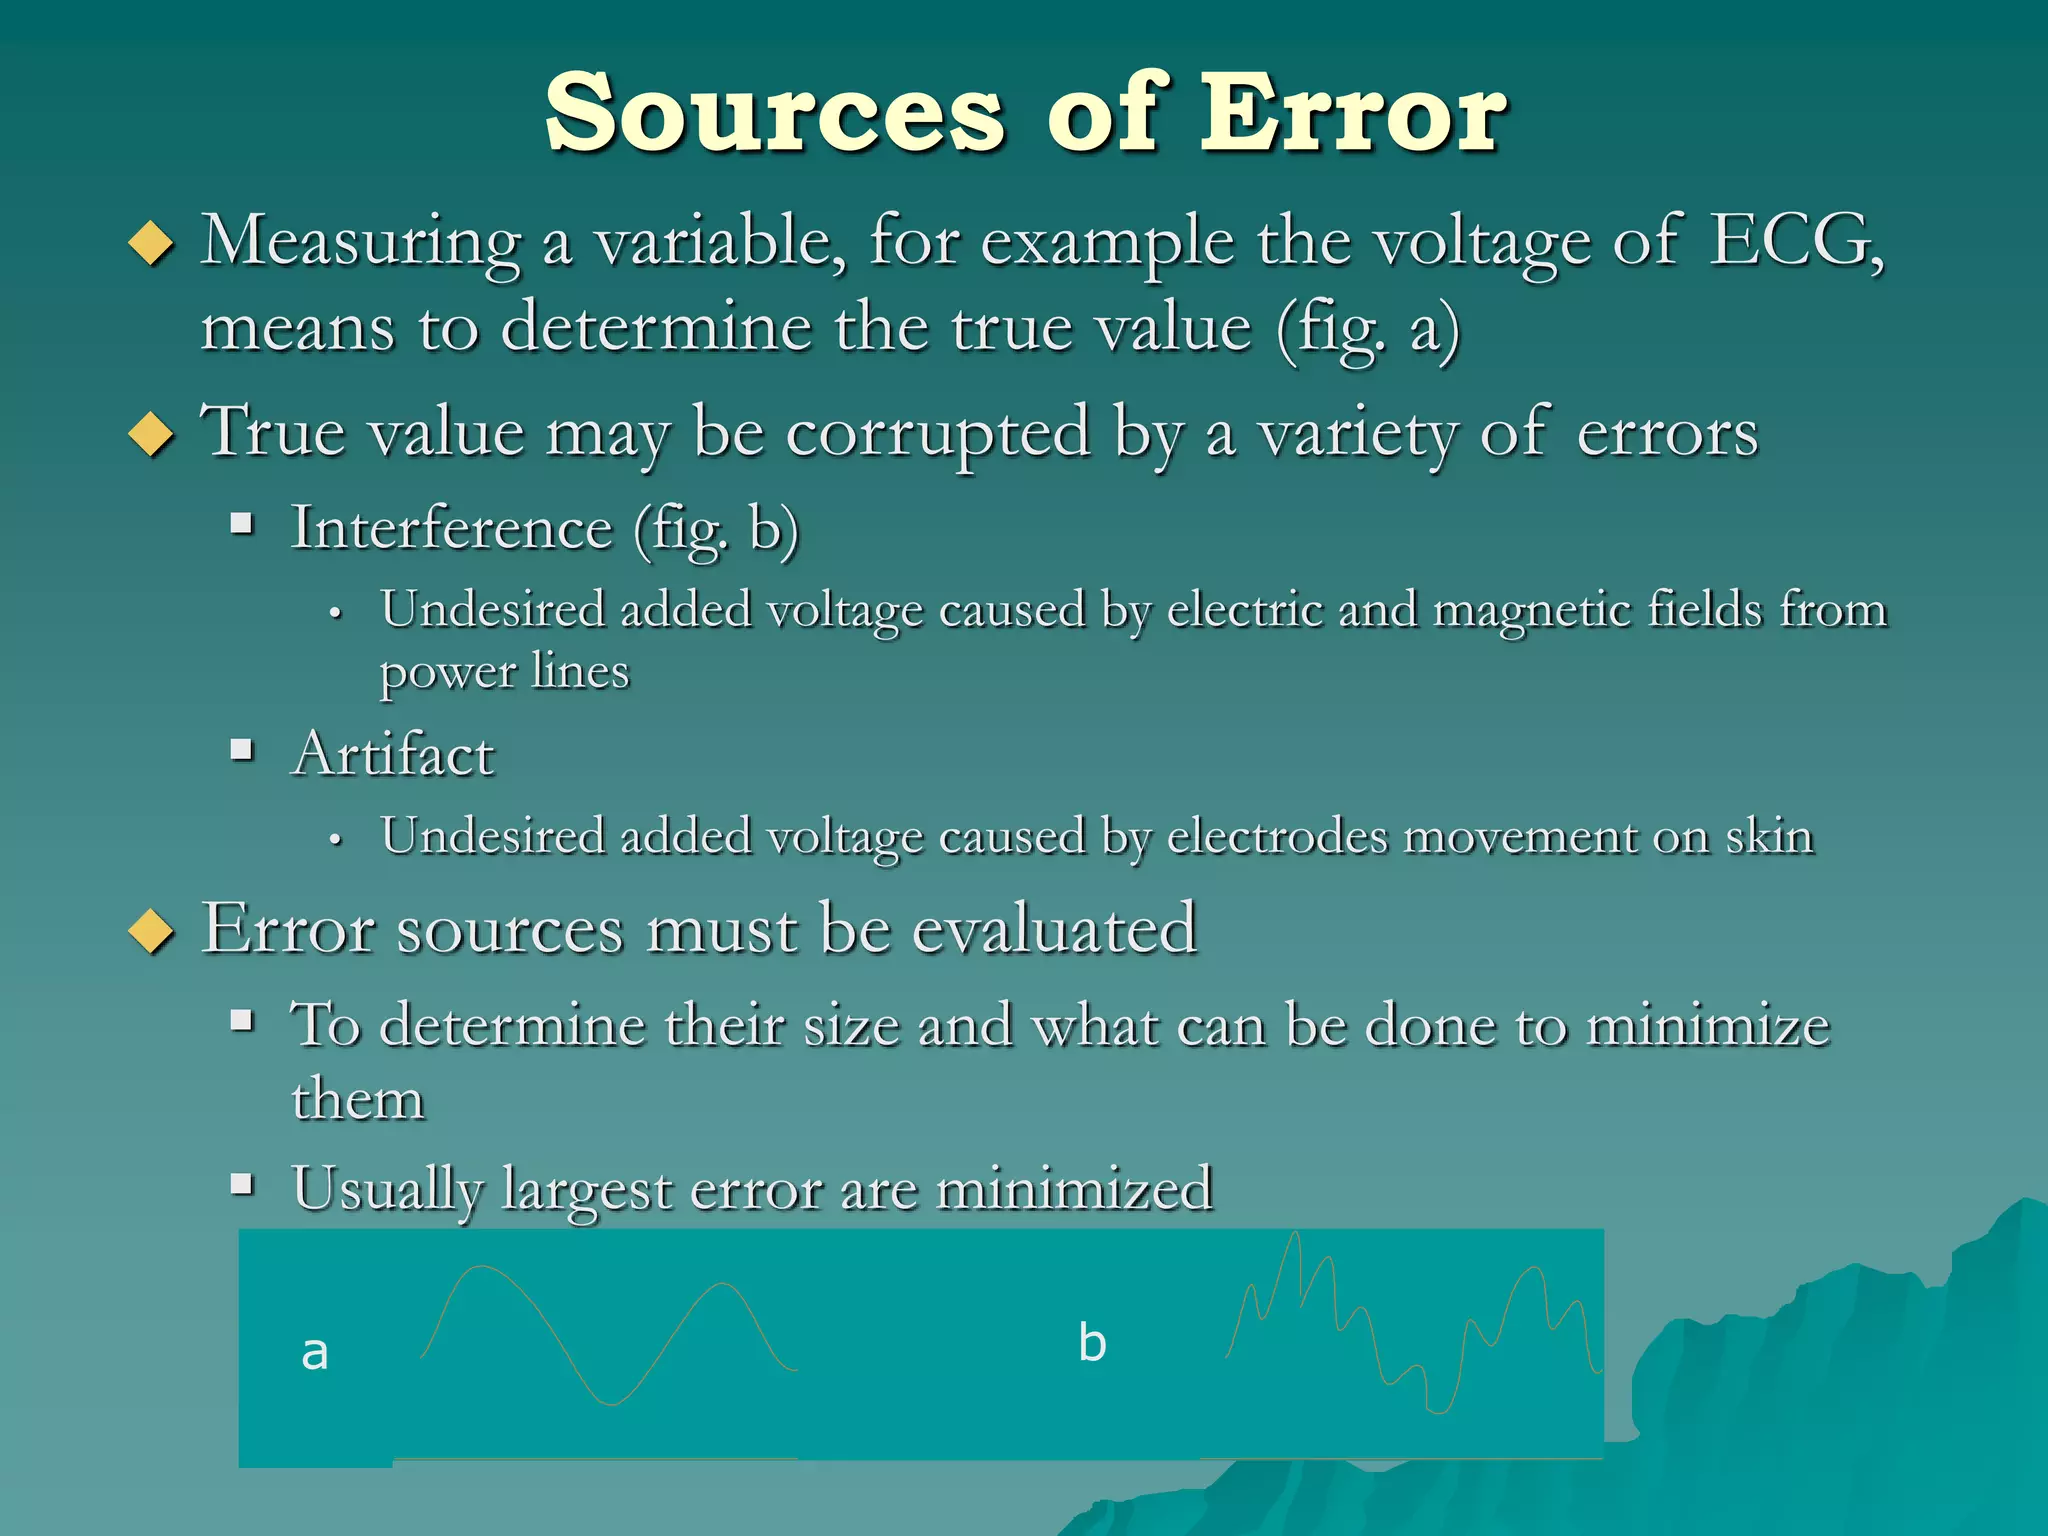
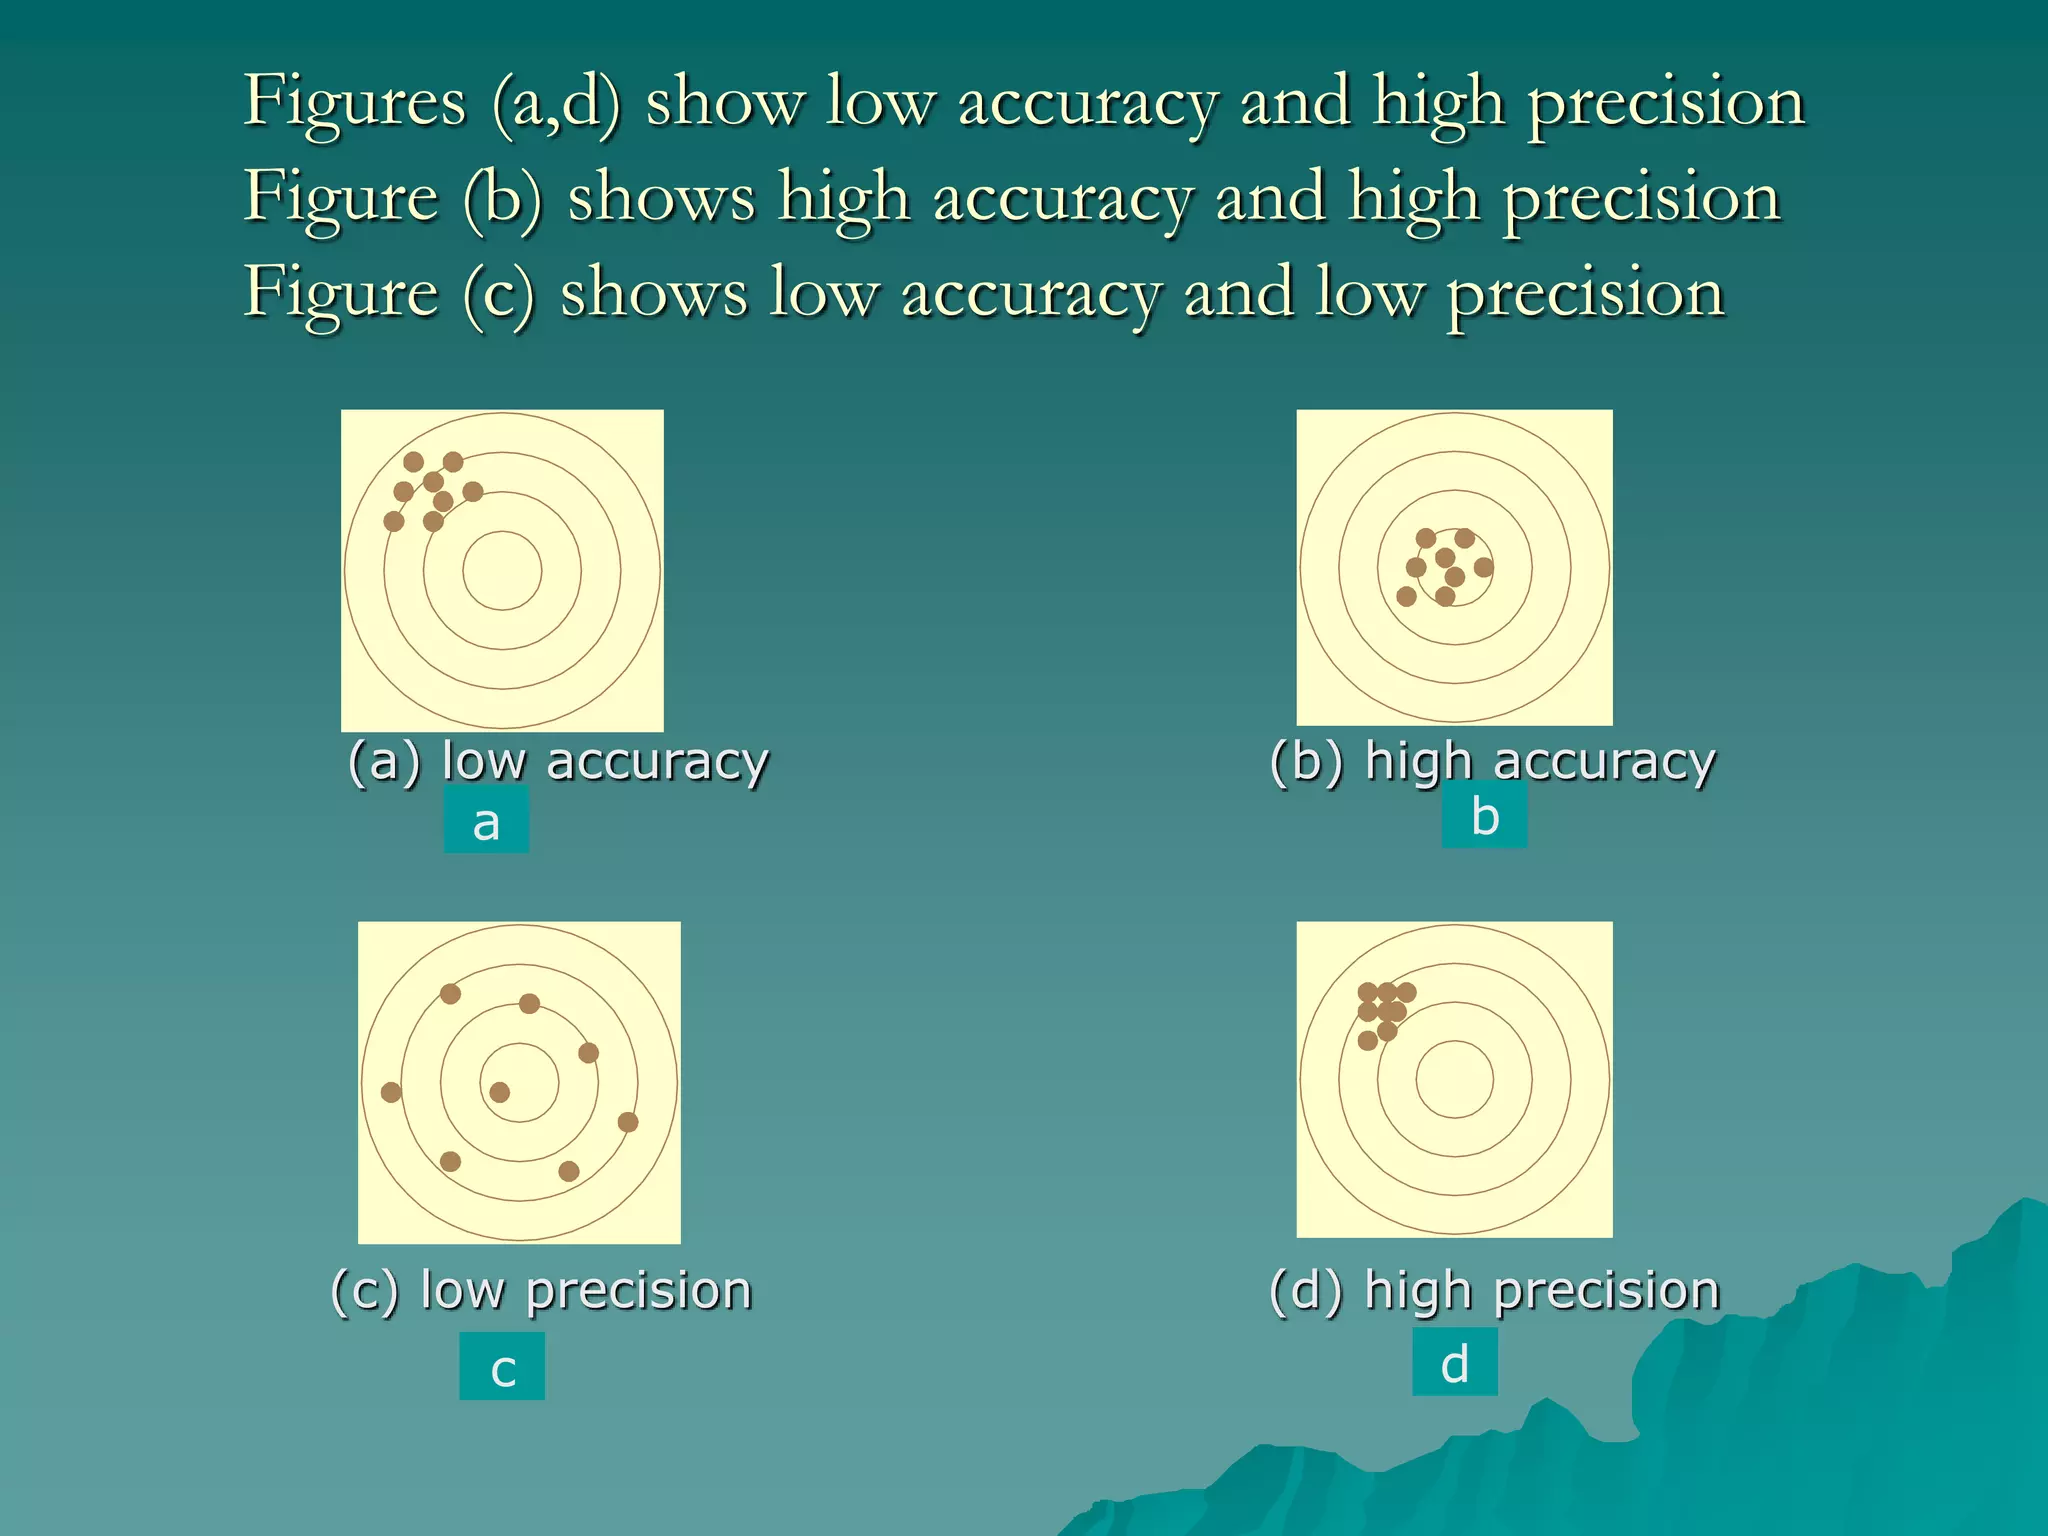
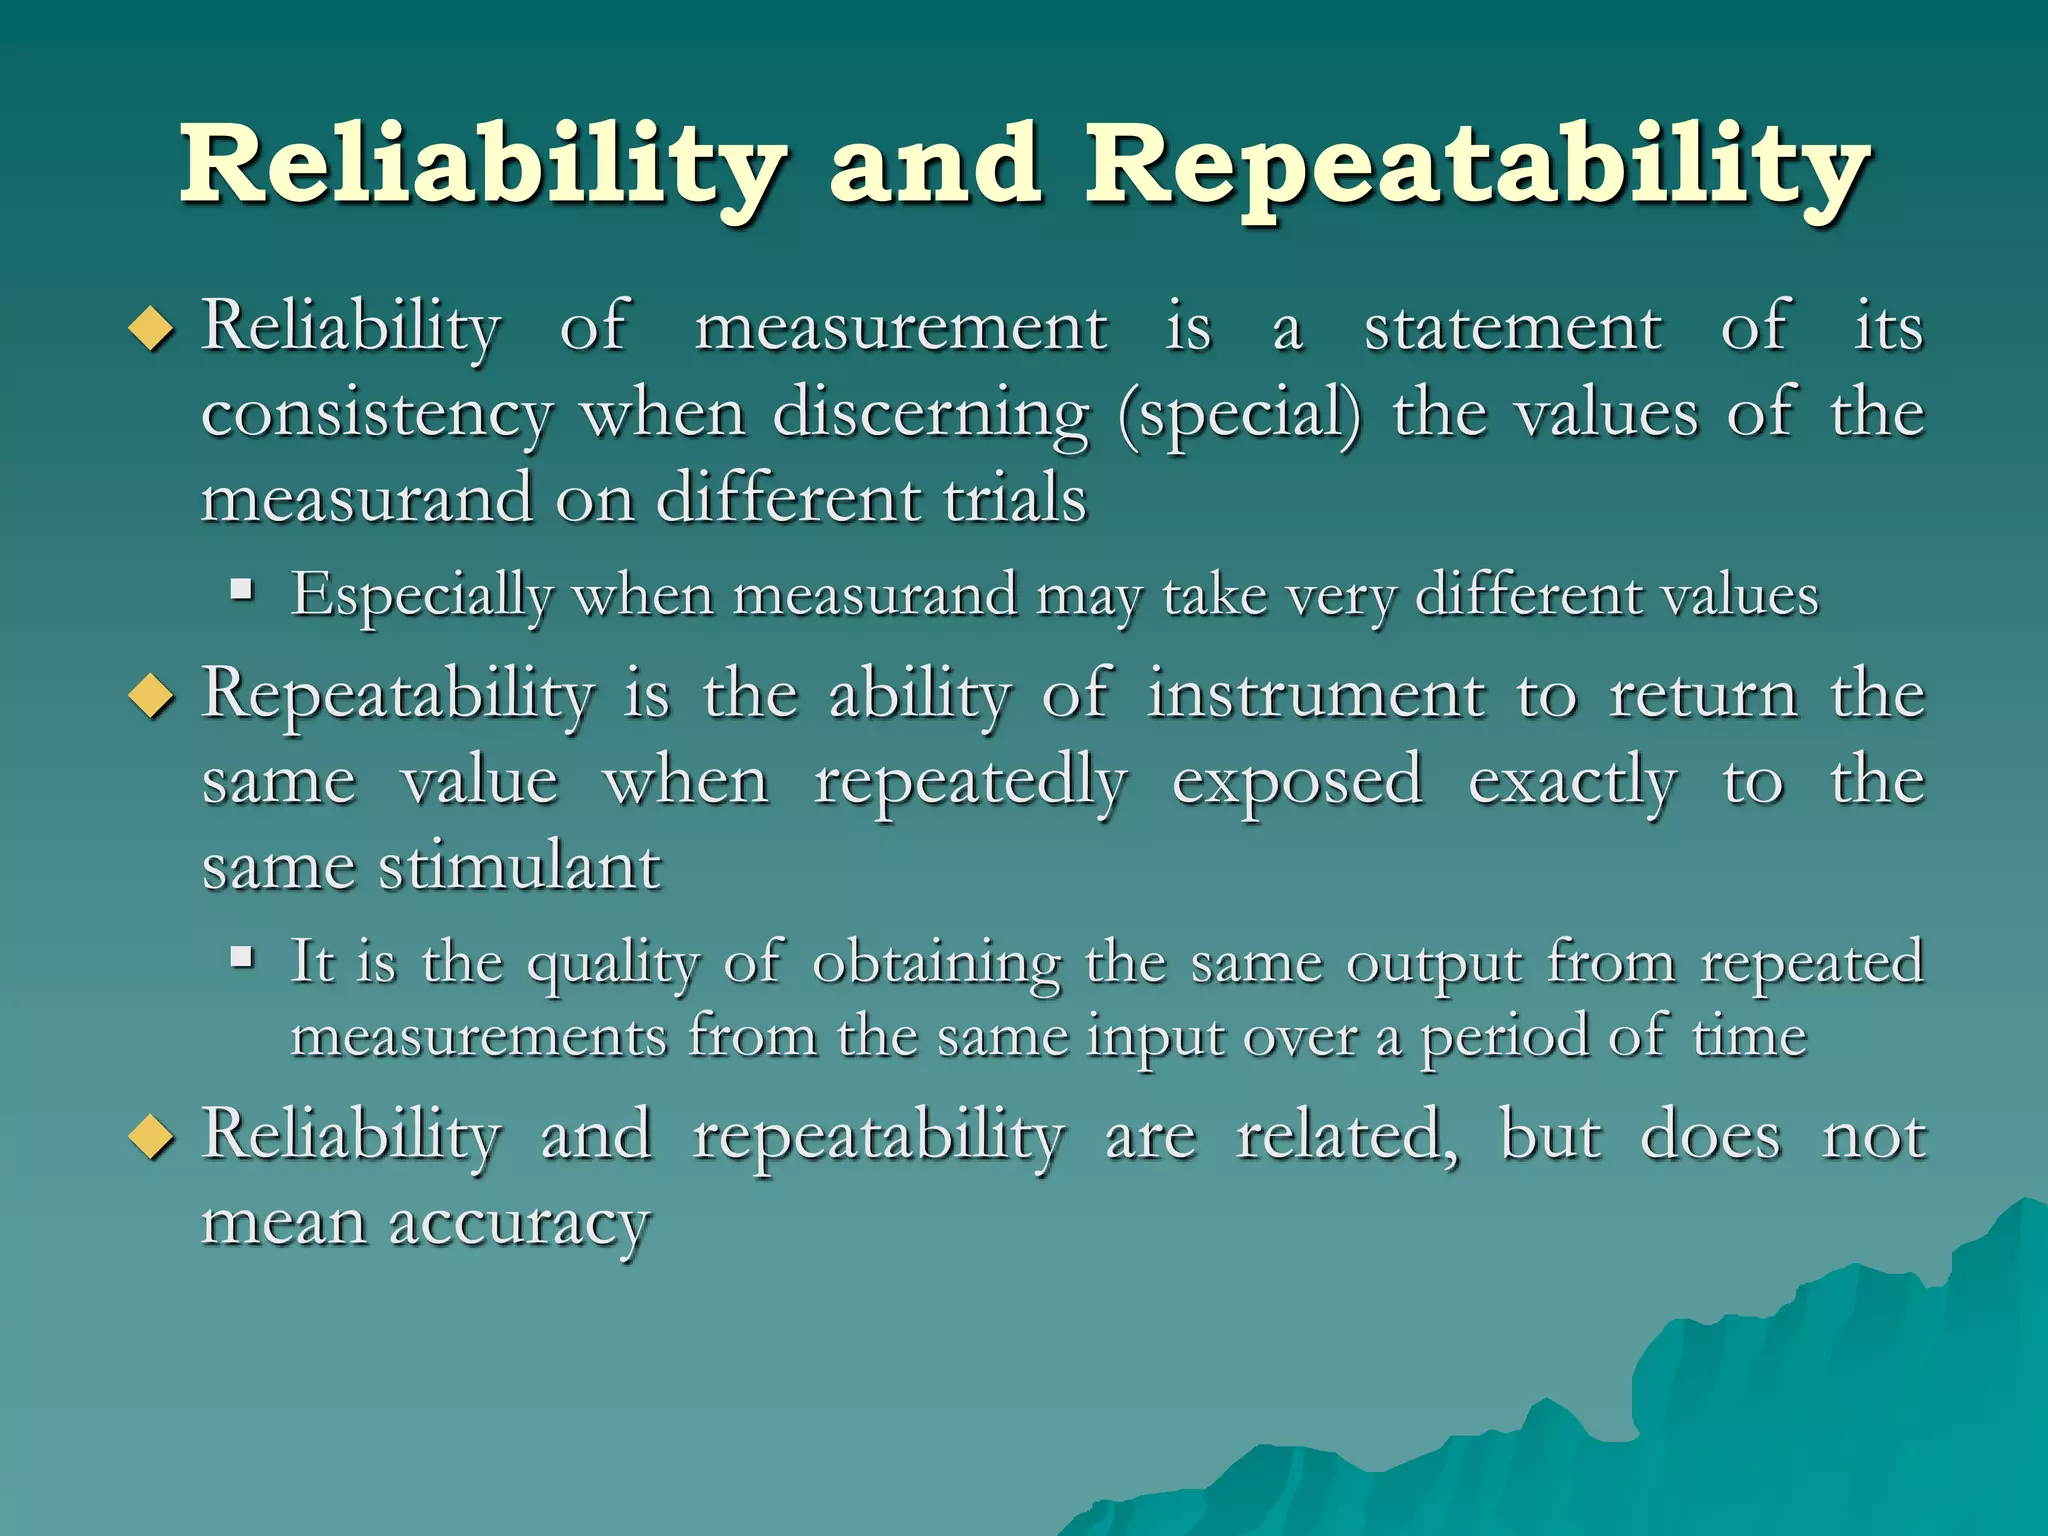
Categories of
Measurements
MEASUREMENTS
Measurements are made to fulfill any or all of
several different goals:
 Obtain information about a physical
phenomenon;
 Assign a value to some fundamental
constant;
 Record trends in, or control, some process;
 Correlate behavior of a phenomenon with
other parameters in order to obtain insight
into their relationships.
Measurement Data Classes
 The data that results from measurements can be
divided into two major classes
 Those classes are each divided into two
subclasses. The major divisions include
 Qualitative data and Quantitative data.
Qualitative Data
 This type of data is non-numerical or
categorical in nature
 Qualitative data can be further broken into two
subgroups:
 Nominal data
 Ordinal data
Quantitative Data
 Quantitative data is that which naturally results
in some number to represent the factor
 Quantitative data can be further divided into
two subclasses:
 Interval data
 Ratio data
Categories of Measurements
Three general categories of
measurements
 Direct
 Indirect
 Null
Direct Measurements
 Made by holding the measurand up to some calibrated
standard and comparing the two
 Meter stick ruler
 Directly measurement of arterial, venous, and cardiac
blood pressures
 Accurate
 Very invasive
A Typical System for Measuring Cardiac Pressures
Indirect Measurements
 Made by measuring something other than actual measurand
 Considered best regarding measurement accuracy
 Often used when direct measurements are either difficult or
dangerous
 Ex. Temperature measurement of a metal melting furnace ( Oven)
 Related to the interior temperature by a certain factor
 The most common example of an indirect measurement is the way
human blood pressure (BP) is measured
 Does not actually measure BP
 Measure cuff pressure
Indirect Measurement of
Blood Pressure
Pr
es
sur
e/
m
m
Hg
Null Measurements
 Made by
 Comparing a calibrated source to an unknown measurand
 Adjusting either of them until the difference between them is
zero
 Ex.
 An electrical potentiometer
 Differential voltmeter
 Bridge is such an instrument
 Galvanometer is an instrument for detecting and measuring
small electric currents
Unknown
Voltage Source
Adjustable
Potentiometer
Vx Vref
Zero-center Galvanometer
Factors in Making
Measurement
Goodness of measurements involves several
concepts that must be understood.
Some of the more significant of these are
 error,
 validity,
 reliability,
 repeatability,
 accuracy,
 precision,
 resolution.
Error
 All measurements contain a certain degree of error
 Error in medical measurements mostly refers to normal
random variation
 Measurements are made
 Repeatedly (some parameter unchanging )
 Successively (if different instruments or instrument operators are used to make
successive measurements
• Different instruments
• Different operators
 Results tend to cluster around central value, called true
or expected (xo)
 Measured value (xi) will deviate from xo by a certain amount
∆x, which is the error term
Sources of Error
 Measuring a variable, for example the voltage of ECG,
means to determine the true value (fig. a)
 True value may be corrupted by a variety of errors
 Interference (fig. b)
• Undesired added voltage caused by electric and magnetic fields from
power lines
 Artifact
• Undesired added voltage caused by electrodes movement on skin
 Error sources must be evaluated
 To determine their size and what can be done to minimize
them
 Usually largest error are minimized
a b
MEASUREMENT ERRORS
 There are four general categories of
error:
 Theoretical error
 Static error
 Dynamic error
 Instrument insertion error
Accuracy and Precision
 Accuracy of a measurement
 Refers to
• The freedom from error
• The degree of conformity between the measurand and the standard (fig. a,b)
 Calculated as the difference between the true and the measured values
divided by the true value
 Precision
 is the quality of obtaining the same output from repeated measurements
(fig. c,d)
 Refers to the exactness of successive measurements
• Considered as the degree of refinement of the instrument
 Accuracy and precision are often confused and used as the same
 They are not so
 Precise measurement has a small standard deviation and variance under
repeated trials
• Standard deviation of the measurement is a good indication of its precision
 Accuracy of measurements is indicated by the closeness to the central
valve (the mean)
Figures (a,d) show low accuracy and high precision
Figure (b) shows high accuracy and high precision
Figure (c) shows low accuracy and low precision
(a) low accuracy (b) high accuracy
(c) low precision (d) high precision
a b
c d
Validity
Validity of a measurement is
 A statement of how well instrument
actually measures what it intends to
measure
 Determined by the extent to which
measurement is true for some
circumstance or condition or a range of
circumstances or conditions
Reliability and Repeatability
 Reliability of measurement is a statement of its
consistency when discerning (special) the values of the
measurand on different trials
 Especially when measurand may take very different values
 Repeatability is the ability of instrument to return the
same value when repeatedly exposed exactly to the
same stimulant
 It is the quality of obtaining the same output from repeated
measurements from the same input over a period of time
 Reliability and repeatability are related, but does not
mean accuracy
Resolution
 Refers to the degree to which measurand can be broken
into identifiable adjacent parts
 Defined as the smallest incremental quantity that can be
reliably measured
 Examples
• A voltmeter with a larger number of digits has a higher resolution
than one with fewer digits
• A speedometer with more tick marks between each numbered speed
has a higher resolution than one with no tick marks
 For digital electronic measuring instruments
 Resolution is set to the number of bits used in the data word
 An 8-bits voltmeter reads a range for 0 – 10 V has a
resolution of
10/(28 – 1) = 10/255 = 0.039 V or 39 mV per bit
 High resolution does not imply high accuracy, but high
resolution implies high precision
Conclusion
Obtaining highest possible precision,
repeatability, and accuracy is a major
goal in bioinstrumentation design

Biomedical categories of measurements

  • 1.
  • 2.
    MEASUREMENTS Measurements are madeto fulfill any or all of several different goals:  Obtain information about a physical phenomenon;  Assign a value to some fundamental constant;  Record trends in, or control, some process;  Correlate behavior of a phenomenon with other parameters in order to obtain insight into their relationships.
  • 3.
    Measurement Data Classes The data that results from measurements can be divided into two major classes  Those classes are each divided into two subclasses. The major divisions include  Qualitative data and Quantitative data.
  • 4.
    Qualitative Data  Thistype of data is non-numerical or categorical in nature  Qualitative data can be further broken into two subgroups:  Nominal data  Ordinal data
  • 5.
    Quantitative Data  Quantitativedata is that which naturally results in some number to represent the factor  Quantitative data can be further divided into two subclasses:  Interval data  Ratio data
  • 6.
    Categories of Measurements Threegeneral categories of measurements  Direct  Indirect  Null
  • 7.
    Direct Measurements  Madeby holding the measurand up to some calibrated standard and comparing the two  Meter stick ruler  Directly measurement of arterial, venous, and cardiac blood pressures  Accurate  Very invasive A Typical System for Measuring Cardiac Pressures
  • 8.
    Indirect Measurements  Madeby measuring something other than actual measurand  Considered best regarding measurement accuracy  Often used when direct measurements are either difficult or dangerous  Ex. Temperature measurement of a metal melting furnace ( Oven)  Related to the interior temperature by a certain factor  The most common example of an indirect measurement is the way human blood pressure (BP) is measured  Does not actually measure BP  Measure cuff pressure
  • 9.
    Indirect Measurement of BloodPressure Pr es sur e/ m m Hg
  • 10.
    Null Measurements  Madeby  Comparing a calibrated source to an unknown measurand  Adjusting either of them until the difference between them is zero  Ex.  An electrical potentiometer  Differential voltmeter  Bridge is such an instrument
  • 11.
     Galvanometer isan instrument for detecting and measuring small electric currents Unknown Voltage Source Adjustable Potentiometer Vx Vref Zero-center Galvanometer
  • 12.
    Factors in Making Measurement Goodnessof measurements involves several concepts that must be understood. Some of the more significant of these are  error,  validity,  reliability,  repeatability,  accuracy,  precision,  resolution.
  • 13.
    Error  All measurementscontain a certain degree of error  Error in medical measurements mostly refers to normal random variation  Measurements are made  Repeatedly (some parameter unchanging )  Successively (if different instruments or instrument operators are used to make successive measurements • Different instruments • Different operators  Results tend to cluster around central value, called true or expected (xo)  Measured value (xi) will deviate from xo by a certain amount ∆x, which is the error term
  • 14.
    Sources of Error Measuring a variable, for example the voltage of ECG, means to determine the true value (fig. a)  True value may be corrupted by a variety of errors  Interference (fig. b) • Undesired added voltage caused by electric and magnetic fields from power lines  Artifact • Undesired added voltage caused by electrodes movement on skin  Error sources must be evaluated  To determine their size and what can be done to minimize them  Usually largest error are minimized a b
  • 15.
    MEASUREMENT ERRORS  Thereare four general categories of error:  Theoretical error  Static error  Dynamic error  Instrument insertion error
  • 16.
    Accuracy and Precision Accuracy of a measurement  Refers to • The freedom from error • The degree of conformity between the measurand and the standard (fig. a,b)  Calculated as the difference between the true and the measured values divided by the true value  Precision  is the quality of obtaining the same output from repeated measurements (fig. c,d)  Refers to the exactness of successive measurements • Considered as the degree of refinement of the instrument  Accuracy and precision are often confused and used as the same  They are not so  Precise measurement has a small standard deviation and variance under repeated trials • Standard deviation of the measurement is a good indication of its precision  Accuracy of measurements is indicated by the closeness to the central valve (the mean)
  • 17.
    Figures (a,d) showlow accuracy and high precision Figure (b) shows high accuracy and high precision Figure (c) shows low accuracy and low precision (a) low accuracy (b) high accuracy (c) low precision (d) high precision a b c d
  • 18.
    Validity Validity of ameasurement is  A statement of how well instrument actually measures what it intends to measure  Determined by the extent to which measurement is true for some circumstance or condition or a range of circumstances or conditions
  • 19.
    Reliability and Repeatability Reliability of measurement is a statement of its consistency when discerning (special) the values of the measurand on different trials  Especially when measurand may take very different values  Repeatability is the ability of instrument to return the same value when repeatedly exposed exactly to the same stimulant  It is the quality of obtaining the same output from repeated measurements from the same input over a period of time  Reliability and repeatability are related, but does not mean accuracy
  • 20.
    Resolution  Refers tothe degree to which measurand can be broken into identifiable adjacent parts  Defined as the smallest incremental quantity that can be reliably measured  Examples • A voltmeter with a larger number of digits has a higher resolution than one with fewer digits • A speedometer with more tick marks between each numbered speed has a higher resolution than one with no tick marks  For digital electronic measuring instruments  Resolution is set to the number of bits used in the data word  An 8-bits voltmeter reads a range for 0 – 10 V has a resolution of 10/(28 – 1) = 10/255 = 0.039 V or 39 mV per bit  High resolution does not imply high accuracy, but high resolution implies high precision
  • 21.
    Conclusion Obtaining highest possibleprecision, repeatability, and accuracy is a major goal in bioinstrumentation design