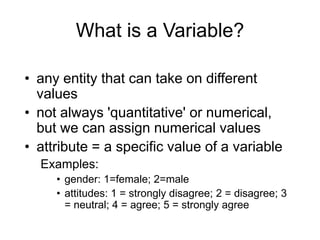
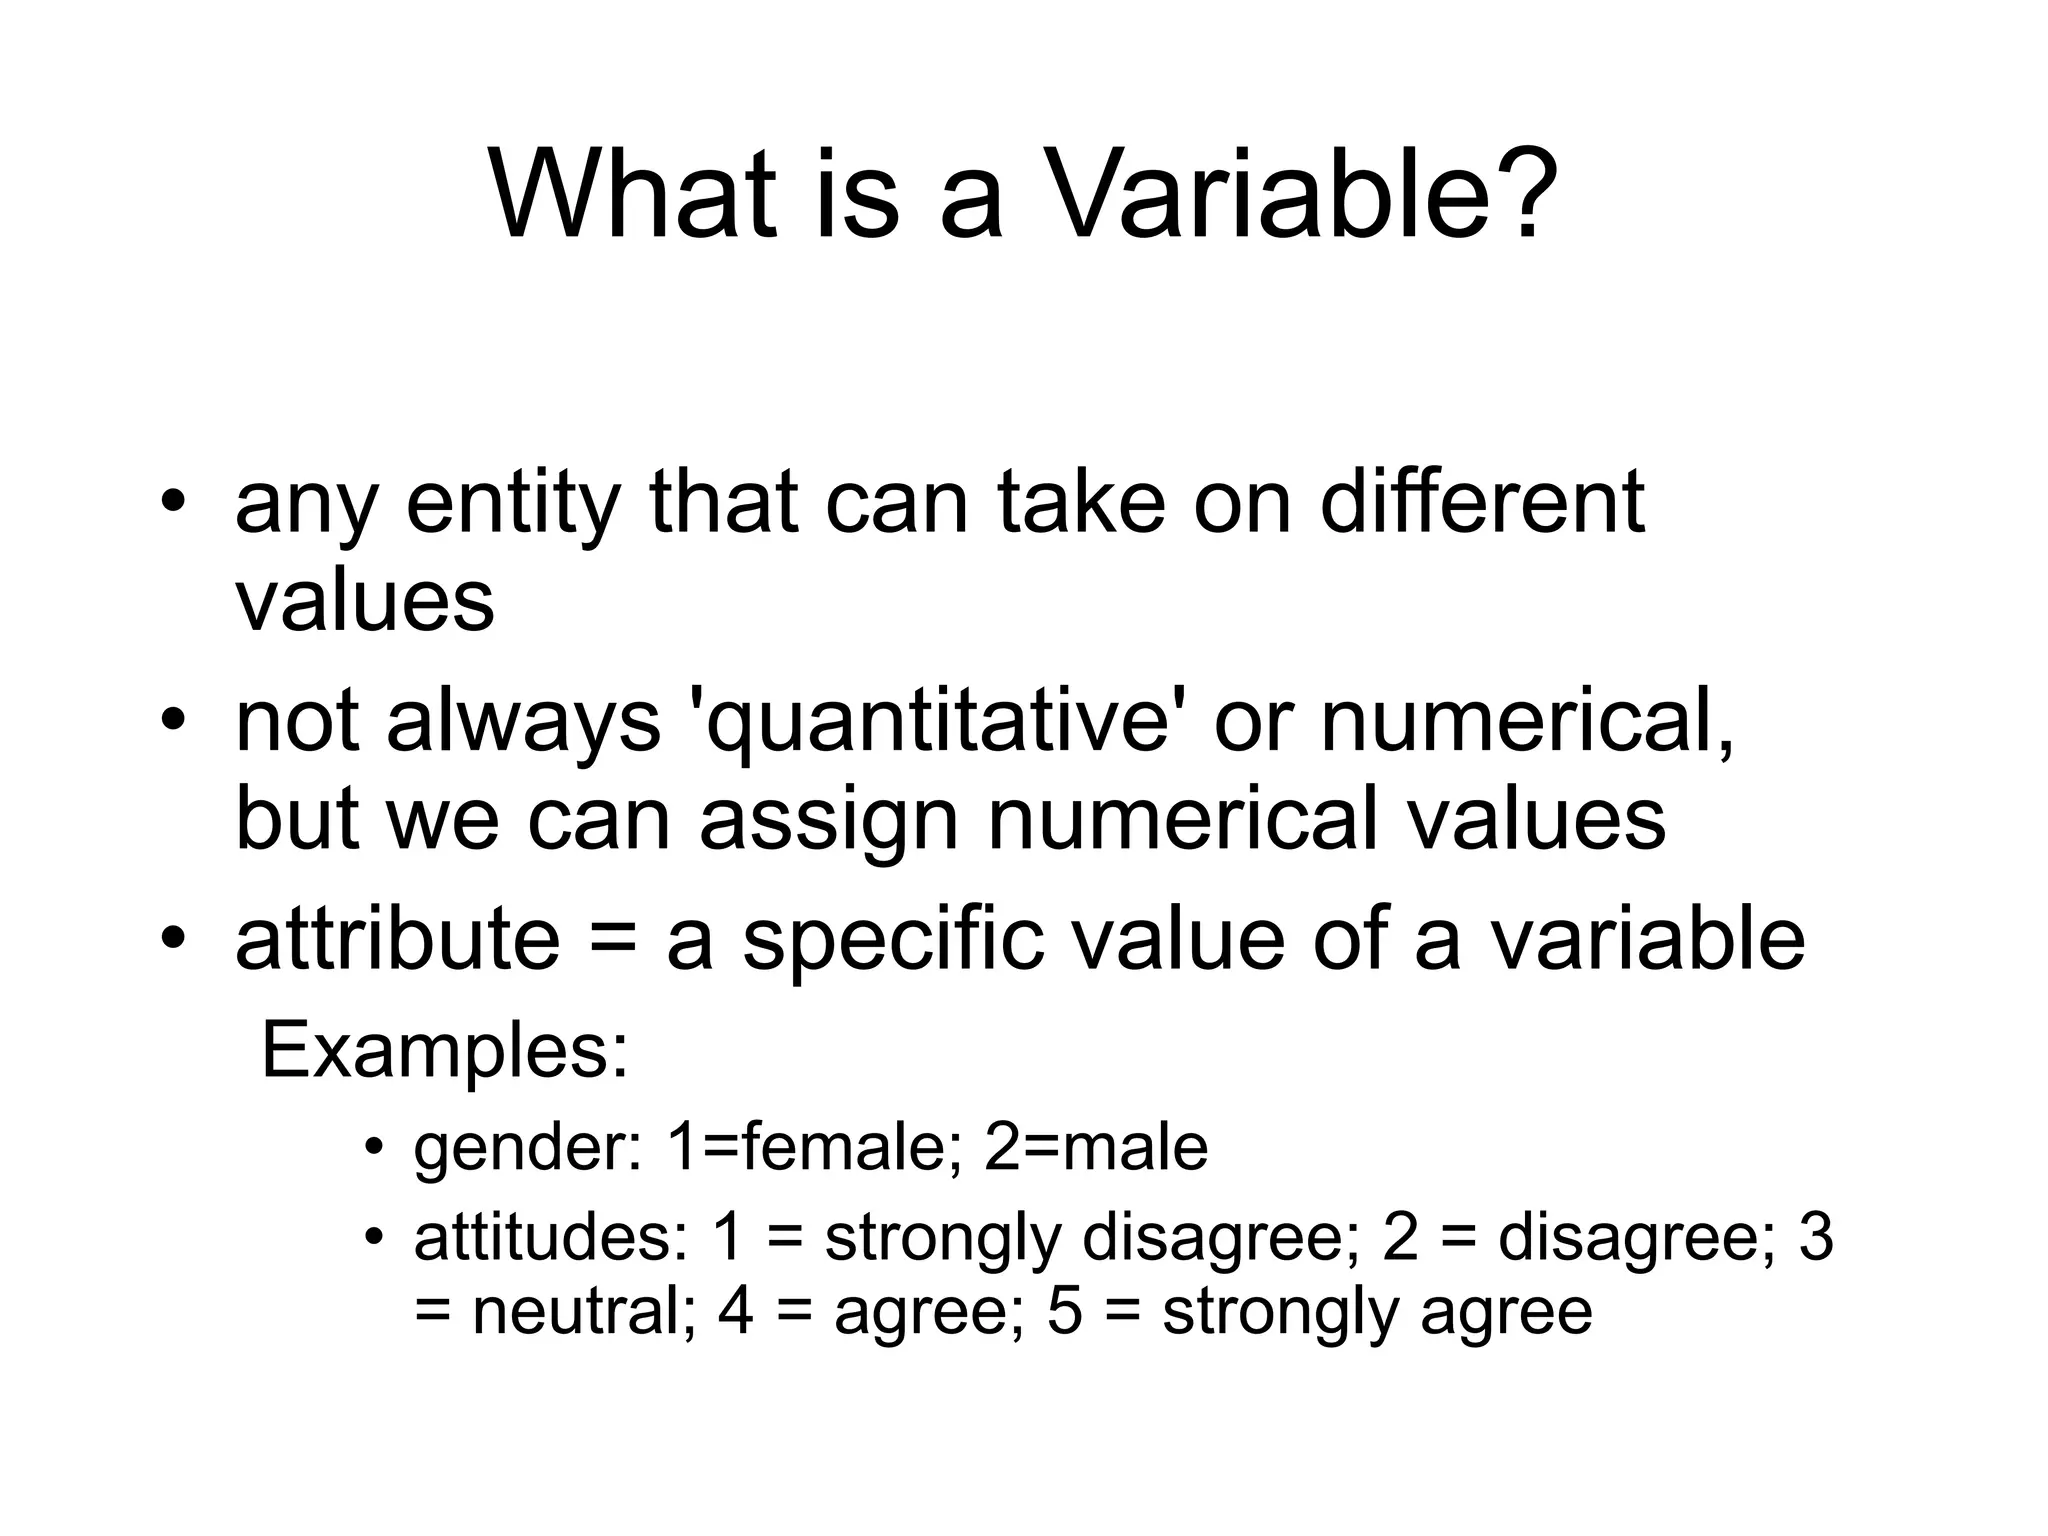
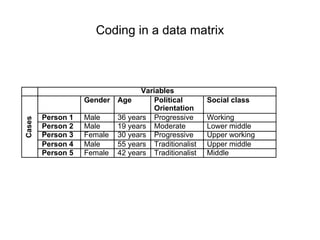
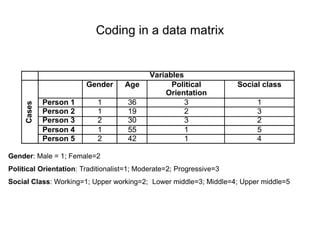
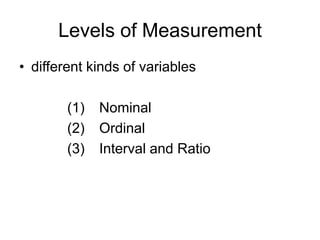
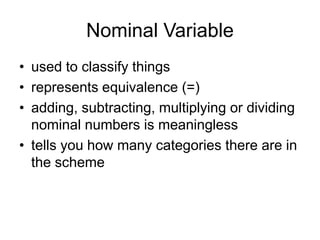
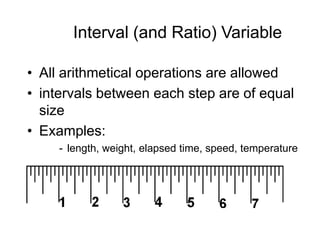
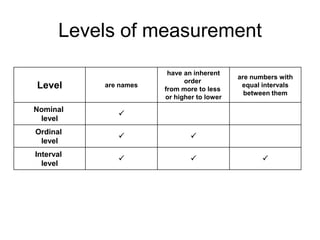
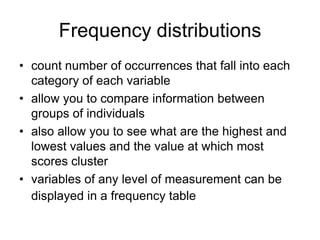
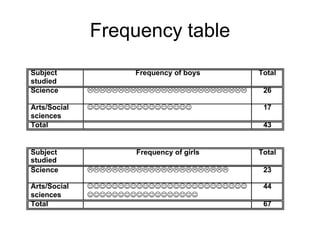
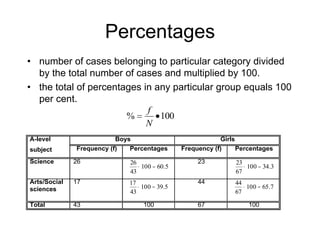
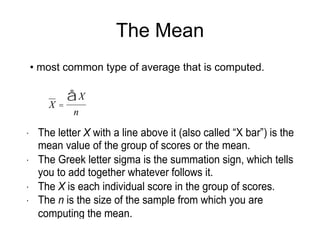
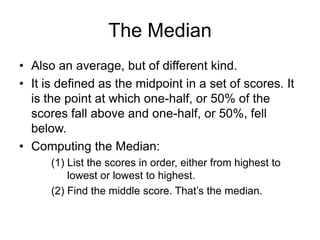
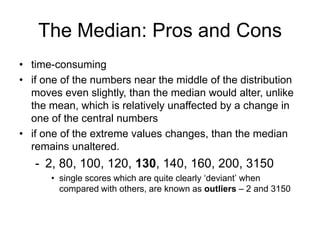
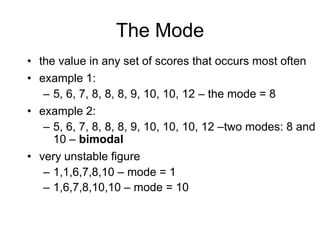
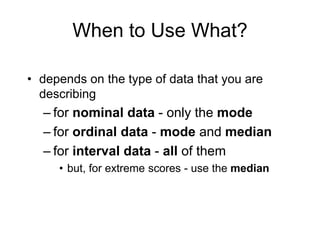
What is a Variable?any entity that can take on different valuesnot always 'quantitative' or numerical, but we can assign numerical valuesattribute = a specific value of a variableExamples: gender: 1=female; 2=maleattitudes: 1 = strongly disagree; 2 = disagree; 3 = neutral; 4 = agree; 5 = strongly agree
Coding in a data matrix
Coding in a data matrixGender: Male = 1; Female=2Political Orientation: Traditionalist=1; Moderate=2; Progressive=3Social Class: Working=1; Upper working=2; 	Lower middle=3; Middle=4; Upper middle=5
Levels of Measurementdifferent kinds of variables(1)	Nominal(2)	Ordinal(3)	Interval and Ratio
Nominal Variableused to classify thingsrepresents equivalence (=)adding, subtracting, multiplying or dividing nominal numbers is meaningless tells you how many categories there are in the scheme
Ordinal Variableordering or ranking of the variablethe relationship between numbered items‘higher’, ‘lower’, ‘easier’, ‘faster’, ‘more often’ equivalence (=) and relative size (greater than) and < (less than)
Interval (and Ratio) VariableAll arithmetical operations are allowedintervals between each step are of equal sizeExamples:length, weight, elapsed time, speed, temperature
Levels of measurement 
Frequency distributionscount number of occurrences that fall into each category of each variableallow you to compare information between groups of individualsalso allow you to see what are the highest and lowest values and the value at which most scores clustervariables of any level of measurement can be displayed in a frequency table
Frequency table
Percentagesnumber of cases belonging to particular category divided by the total number of cases and multiplied by 100.the total of percentages in any particular group equals 100 per cent.
Graphical presentationPie chartsBarchartsLine graphsHistograms
Pie chartillustrates the frequency (or percentage) of each individual category of a variable relative to the total. Pie charts are not appropriate for displaying quantitative data.
15Barchartsthe height of the bar is proportional to the category of the variable - easy to compare used for Nominal or Ordinal level variables (or discrete interval/ratio level variables with relatively few categories)
Multiple barchart
Compound or Component barchart
Line graphsinterval/ratio level variables that are discreteneed to arrange the values in order
Histogramsrepresents continuous quantitative dataThe height of the bars corresponds to the frequency or percentage of cases in the class.The width of the bars represents the size of the intervals of the variableThe horizontal axis is marked out using the mid points of class intervals
Example: Histogram
Graphs have the capacity to distort
Measures of Central Tendencydescribe sets of numbers briefly, yet accurately describe groups of numbers by means of other, but fewer numbersThree main measures:meanmedianmode
The Mean most common type of average that is computed.When to use the MeanWhen values in a particular group cluster closely around a central value, the mean is a good way of indicating the ‘typical’ score, i.e. it is truly representative of the numbers.If the values are very widely spread, are very unevenly distributed, or clustered around extreme values, than the mean can be misleading, and other measures of central tendency should be used instead.
The MedianAlso an average, but of different kind.It is defined as the midpoint in a set of scores. It is the point at which one-half, or 50% of the scores fall above and one-half, or 50%, fell below. Computing the Median:(1)	List the scores in order, either from highest to 	lowest or lowest to highest.(2)	Find the middle score. That’s the median.
The Median: Pros and Constime-consumingif one of the numbers near the middle of the distribution moves even slightly, than the median would alter, unlike the mean, which is relatively unaffected by a change in one of the central numbersif one of the extreme values changes, than the median remains unaltered.2, 80, 100, 120, 130, 140, 160, 200, 3150single scores which are quite clearly ‘deviant’ when compared with others, are known as outliers – 2 and 3150
The Modethe value in any set of scores that occurs most oftenexample 1:5, 6, 7, 8, 8, 8, 9, 10, 10, 12 – the mode = 8example 2:5, 6, 7, 8, 8, 8, 9, 10, 10, 10, 12 –two modes: 8 and 10 – bimodalvery unstable figure1,1,6,7,8,10 – mode = 11,6,7,8,10,10 – mode = 10
When to Use What?depends on the type of data that you are describingfor nominal data - only the modefor ordinal data - mode and medianfor interval data - all of thembut, for extreme scores - use the median
Measure of dispersion (spread) better impression of a distribution’s shapemeasures indicate how widely scattered the numbers arehow different scores are from one particular score – the meanvariability - a measure of how much each score in a group of scores differs from the mean
The range tells us over how many numbers altogether a distribution is spreadwhere
r is the range
h is the highest score in the data set
l is the lowest score in the data set.r = biggest value - smallest value = 55-10 = 45
The mean deviationnumber which indicates how much, on average, the scores in a distribution differ from a central point, the mean.Mean deviation =
210368364319-210-368-319-364Mean=370X - mean= (-210)+210+(-368)+368+(-364)+364+(-319)+319 = 0X - mean= 210+210+368+368+364+364+319+319 = 2522mean deviation = 2522/8 = 315.25
The standard deviation (SD)represents the average amount of variabilityIt is the average distance from the mean sthe standard deviation
find the sum of what follows
 Xeach individual score
the mean of all the scores
Nthe sample sizeStandard deviations
Shape of Normal DistributionSymmetricalAsymptotic tailMean MedianMode
The area under the curveA normal distribution always has the same relative proportions of scores falling between particular values of the numbers involved.Areas under the curve = proportion of scores lying in the various parts of the complete distribution

Quants

  • 1.
    What is aVariable?any entity that can take on different valuesnot always 'quantitative' or numerical, but we can assign numerical valuesattribute = a specific value of a variableExamples: gender: 1=female; 2=maleattitudes: 1 = strongly disagree; 2 = disagree; 3 = neutral; 4 = agree; 5 = strongly agree
  • 2.
    Coding in adata matrix
  • 3.
    Coding in adata matrixGender: Male = 1; Female=2Political Orientation: Traditionalist=1; Moderate=2; Progressive=3Social Class: Working=1; Upper working=2; Lower middle=3; Middle=4; Upper middle=5
  • 4.
    Levels of Measurementdifferentkinds of variables(1) Nominal(2) Ordinal(3) Interval and Ratio
  • 5.
    Nominal Variableused toclassify thingsrepresents equivalence (=)adding, subtracting, multiplying or dividing nominal numbers is meaningless tells you how many categories there are in the scheme
  • 6.
    Ordinal Variableordering orranking of the variablethe relationship between numbered items‘higher’, ‘lower’, ‘easier’, ‘faster’, ‘more often’ equivalence (=) and relative size (greater than) and < (less than)
  • 7.
    Interval (and Ratio)VariableAll arithmetical operations are allowedintervals between each step are of equal sizeExamples:length, weight, elapsed time, speed, temperature
  • 8.
  • 9.
    Frequency distributionscount numberof occurrences that fall into each category of each variableallow you to compare information between groups of individualsalso allow you to see what are the highest and lowest values and the value at which most scores clustervariables of any level of measurement can be displayed in a frequency table
  • 10.
  • 11.
    Percentagesnumber of casesbelonging to particular category divided by the total number of cases and multiplied by 100.the total of percentages in any particular group equals 100 per cent.
  • 12.
  • 13.
    Pie chartillustrates thefrequency (or percentage) of each individual category of a variable relative to the total. Pie charts are not appropriate for displaying quantitative data.
  • 14.
    15Barchartsthe height ofthe bar is proportional to the category of the variable - easy to compare used for Nominal or Ordinal level variables (or discrete interval/ratio level variables with relatively few categories)
  • 15.
  • 16.
  • 17.
    Line graphsinterval/ratio levelvariables that are discreteneed to arrange the values in order
  • 18.
    Histogramsrepresents continuous quantitativedataThe height of the bars corresponds to the frequency or percentage of cases in the class.The width of the bars represents the size of the intervals of the variableThe horizontal axis is marked out using the mid points of class intervals
  • 19.
  • 20.
    Graphs have thecapacity to distort
  • 21.
    Measures of CentralTendencydescribe sets of numbers briefly, yet accurately describe groups of numbers by means of other, but fewer numbersThree main measures:meanmedianmode
  • 22.
    The Mean mostcommon type of average that is computed.When to use the MeanWhen values in a particular group cluster closely around a central value, the mean is a good way of indicating the ‘typical’ score, i.e. it is truly representative of the numbers.If the values are very widely spread, are very unevenly distributed, or clustered around extreme values, than the mean can be misleading, and other measures of central tendency should be used instead.
  • 23.
    The MedianAlso anaverage, but of different kind.It is defined as the midpoint in a set of scores. It is the point at which one-half, or 50% of the scores fall above and one-half, or 50%, fell below. Computing the Median:(1) List the scores in order, either from highest to lowest or lowest to highest.(2) Find the middle score. That’s the median.
  • 24.
    The Median: Prosand Constime-consumingif one of the numbers near the middle of the distribution moves even slightly, than the median would alter, unlike the mean, which is relatively unaffected by a change in one of the central numbersif one of the extreme values changes, than the median remains unaltered.2, 80, 100, 120, 130, 140, 160, 200, 3150single scores which are quite clearly ‘deviant’ when compared with others, are known as outliers – 2 and 3150
  • 25.
    The Modethe valuein any set of scores that occurs most oftenexample 1:5, 6, 7, 8, 8, 8, 9, 10, 10, 12 – the mode = 8example 2:5, 6, 7, 8, 8, 8, 9, 10, 10, 10, 12 –two modes: 8 and 10 – bimodalvery unstable figure1,1,6,7,8,10 – mode = 11,6,7,8,10,10 – mode = 10
  • 26.
    When to UseWhat?depends on the type of data that you are describingfor nominal data - only the modefor ordinal data - mode and medianfor interval data - all of thembut, for extreme scores - use the median
  • 27.
    Measure of dispersion(spread) better impression of a distribution’s shapemeasures indicate how widely scattered the numbers arehow different scores are from one particular score – the meanvariability - a measure of how much each score in a group of scores differs from the mean
  • 28.
    The range tellsus over how many numbers altogether a distribution is spreadwhere
  • 29.
  • 30.
    h is thehighest score in the data set
  • 31.
    l is thelowest score in the data set.r = biggest value - smallest value = 55-10 = 45
  • 32.
    The mean deviationnumberwhich indicates how much, on average, the scores in a distribution differ from a central point, the mean.Mean deviation =
  • 33.
    210368364319-210-368-319-364Mean=370X - mean=(-210)+210+(-368)+368+(-364)+364+(-319)+319 = 0X - mean= 210+210+368+368+364+364+319+319 = 2522mean deviation = 2522/8 = 315.25
  • 34.
    The standard deviation(SD)represents the average amount of variabilityIt is the average distance from the mean sthe standard deviation
  • 35.
    find the sumof what follows
  • 36.
  • 37.
    the mean ofall the scores
  • 38.
  • 39.
    Shape of NormalDistributionSymmetricalAsymptotic tailMean MedianMode
  • 40.
    The area underthe curveA normal distribution always has the same relative proportions of scores falling between particular values of the numbers involved.Areas under the curve = proportion of scores lying in the various parts of the complete distribution