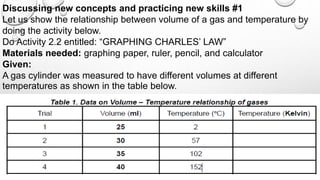
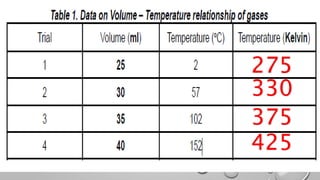
1. The document describes an activity to demonstrate Charles' Law by having students graph the relationship between the volume and temperature of a gas.
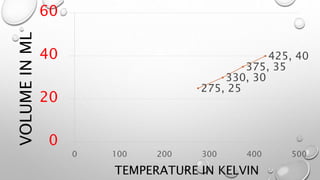
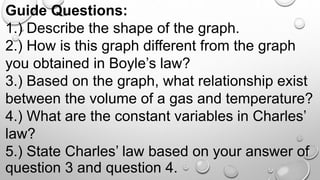
2. Students are instructed to plot volume vs temperature from a provided data table and answer questions about the shape of the graph and relationship between volume and temperature.
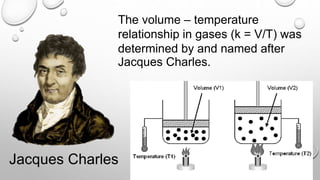
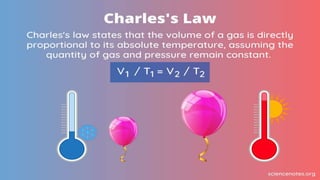
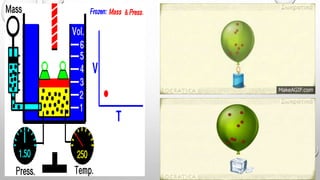
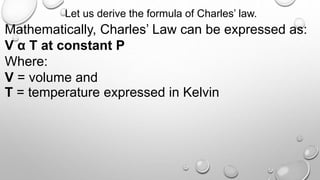
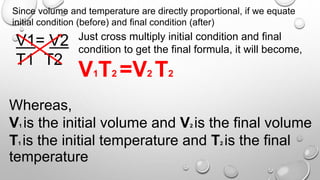
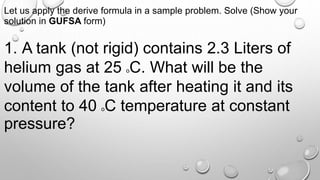
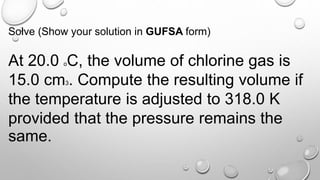
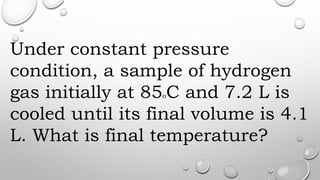
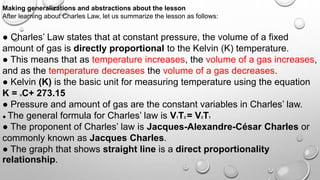
3. Charles' Law states that the volume of a gas is directly proportional to its temperature when pressure is kept constant.