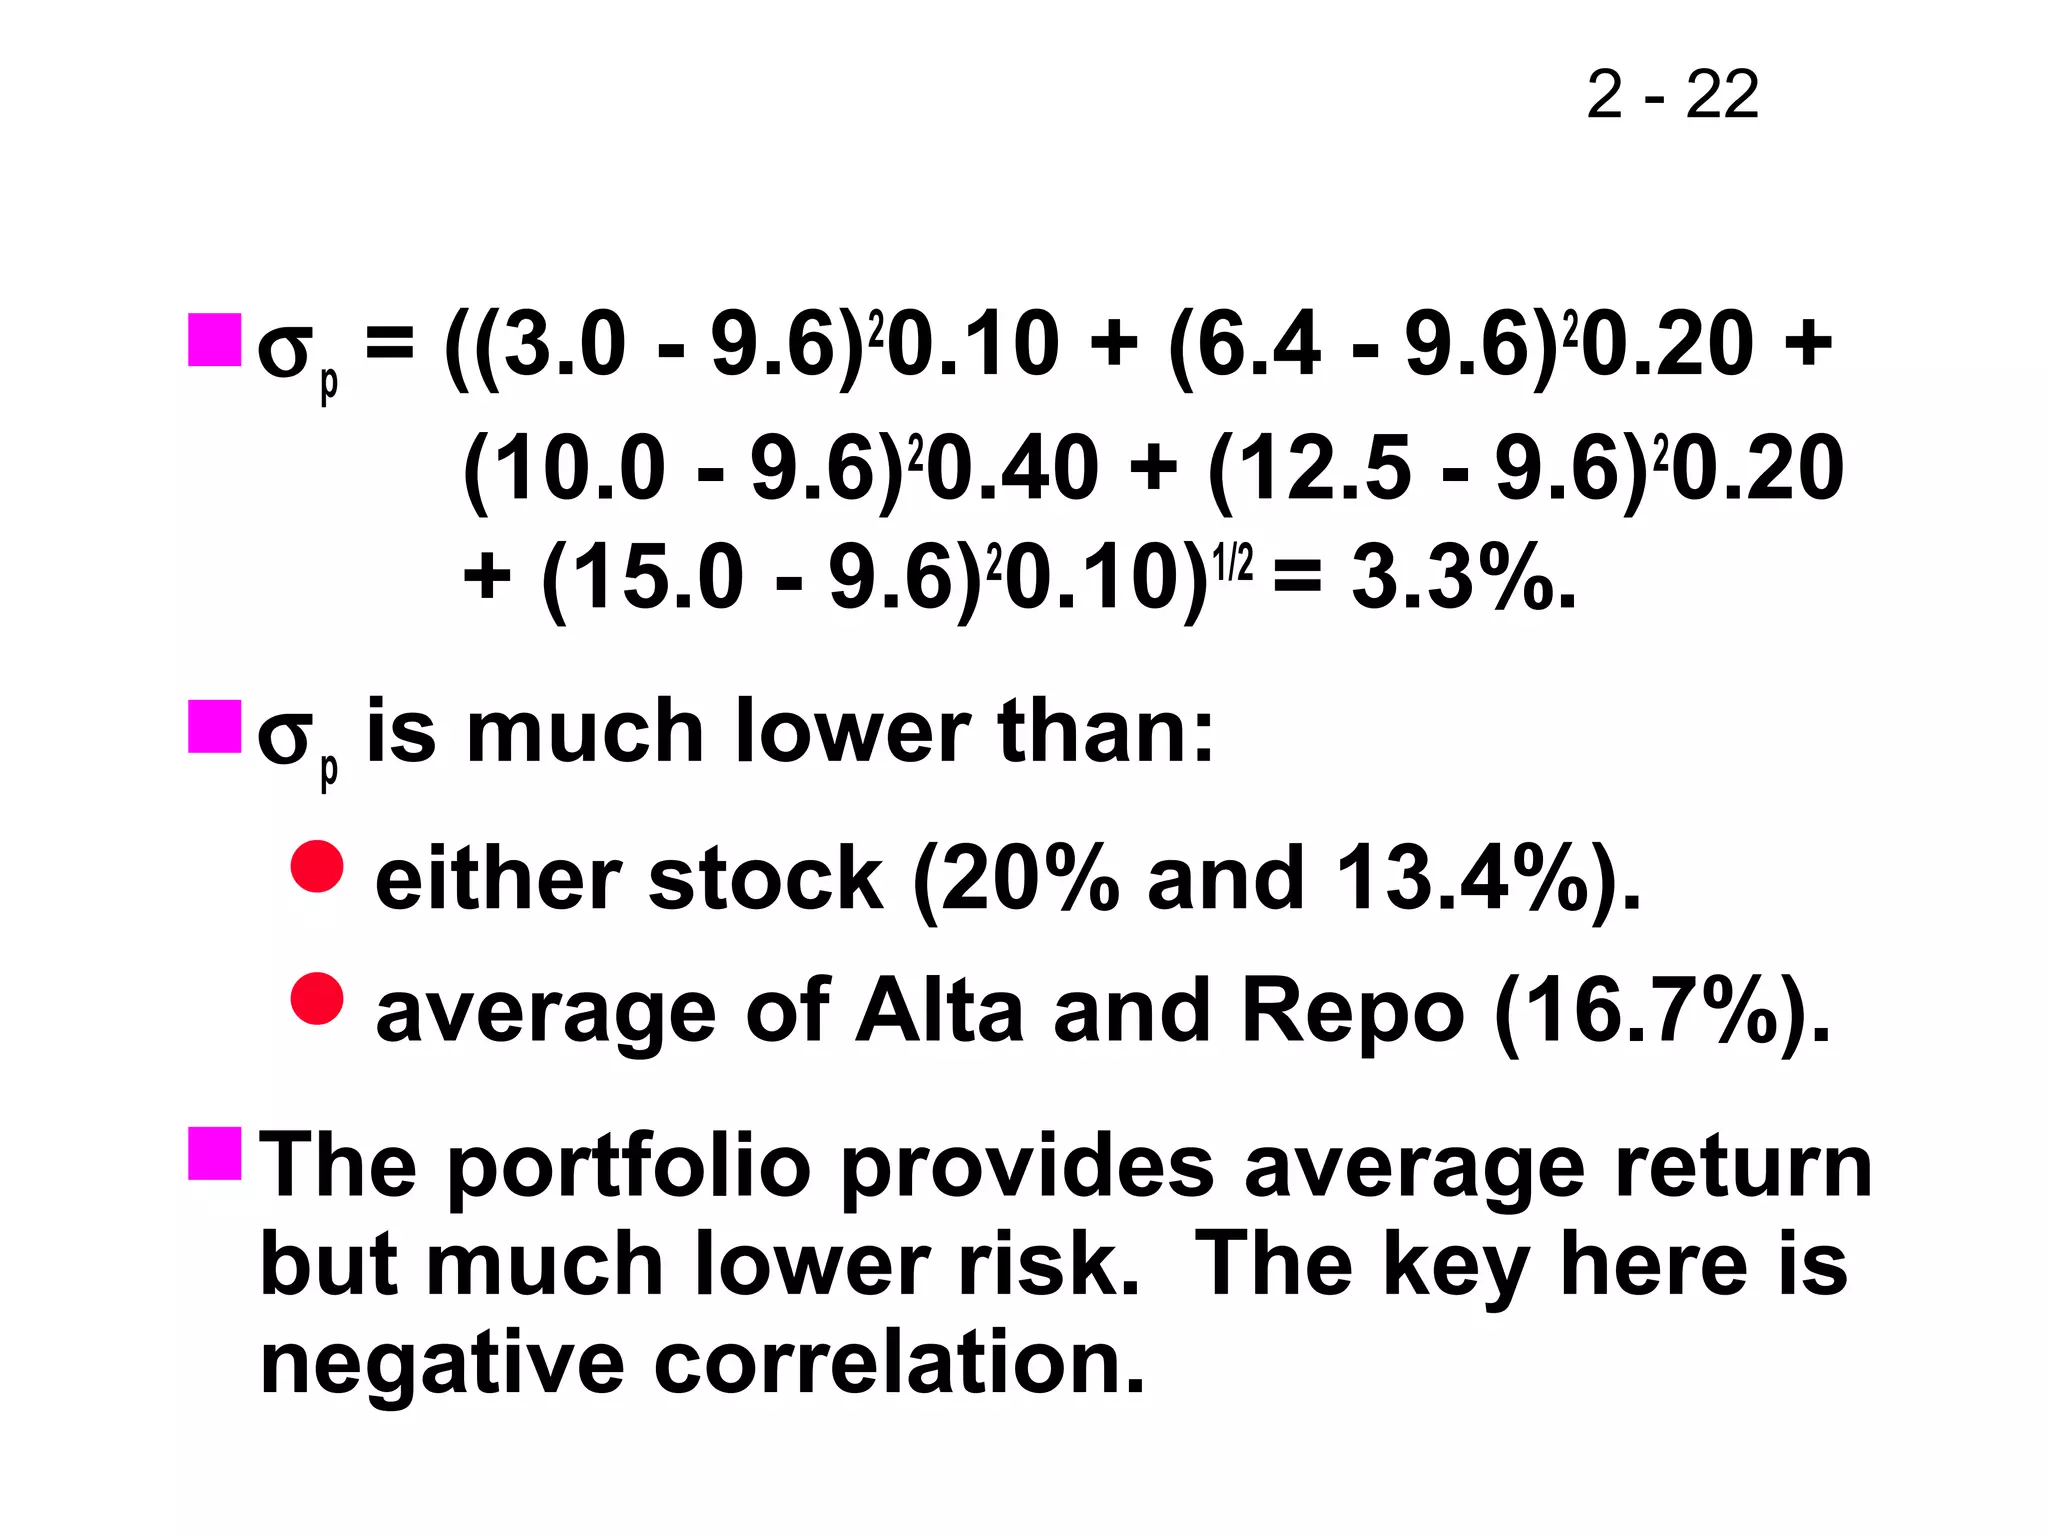
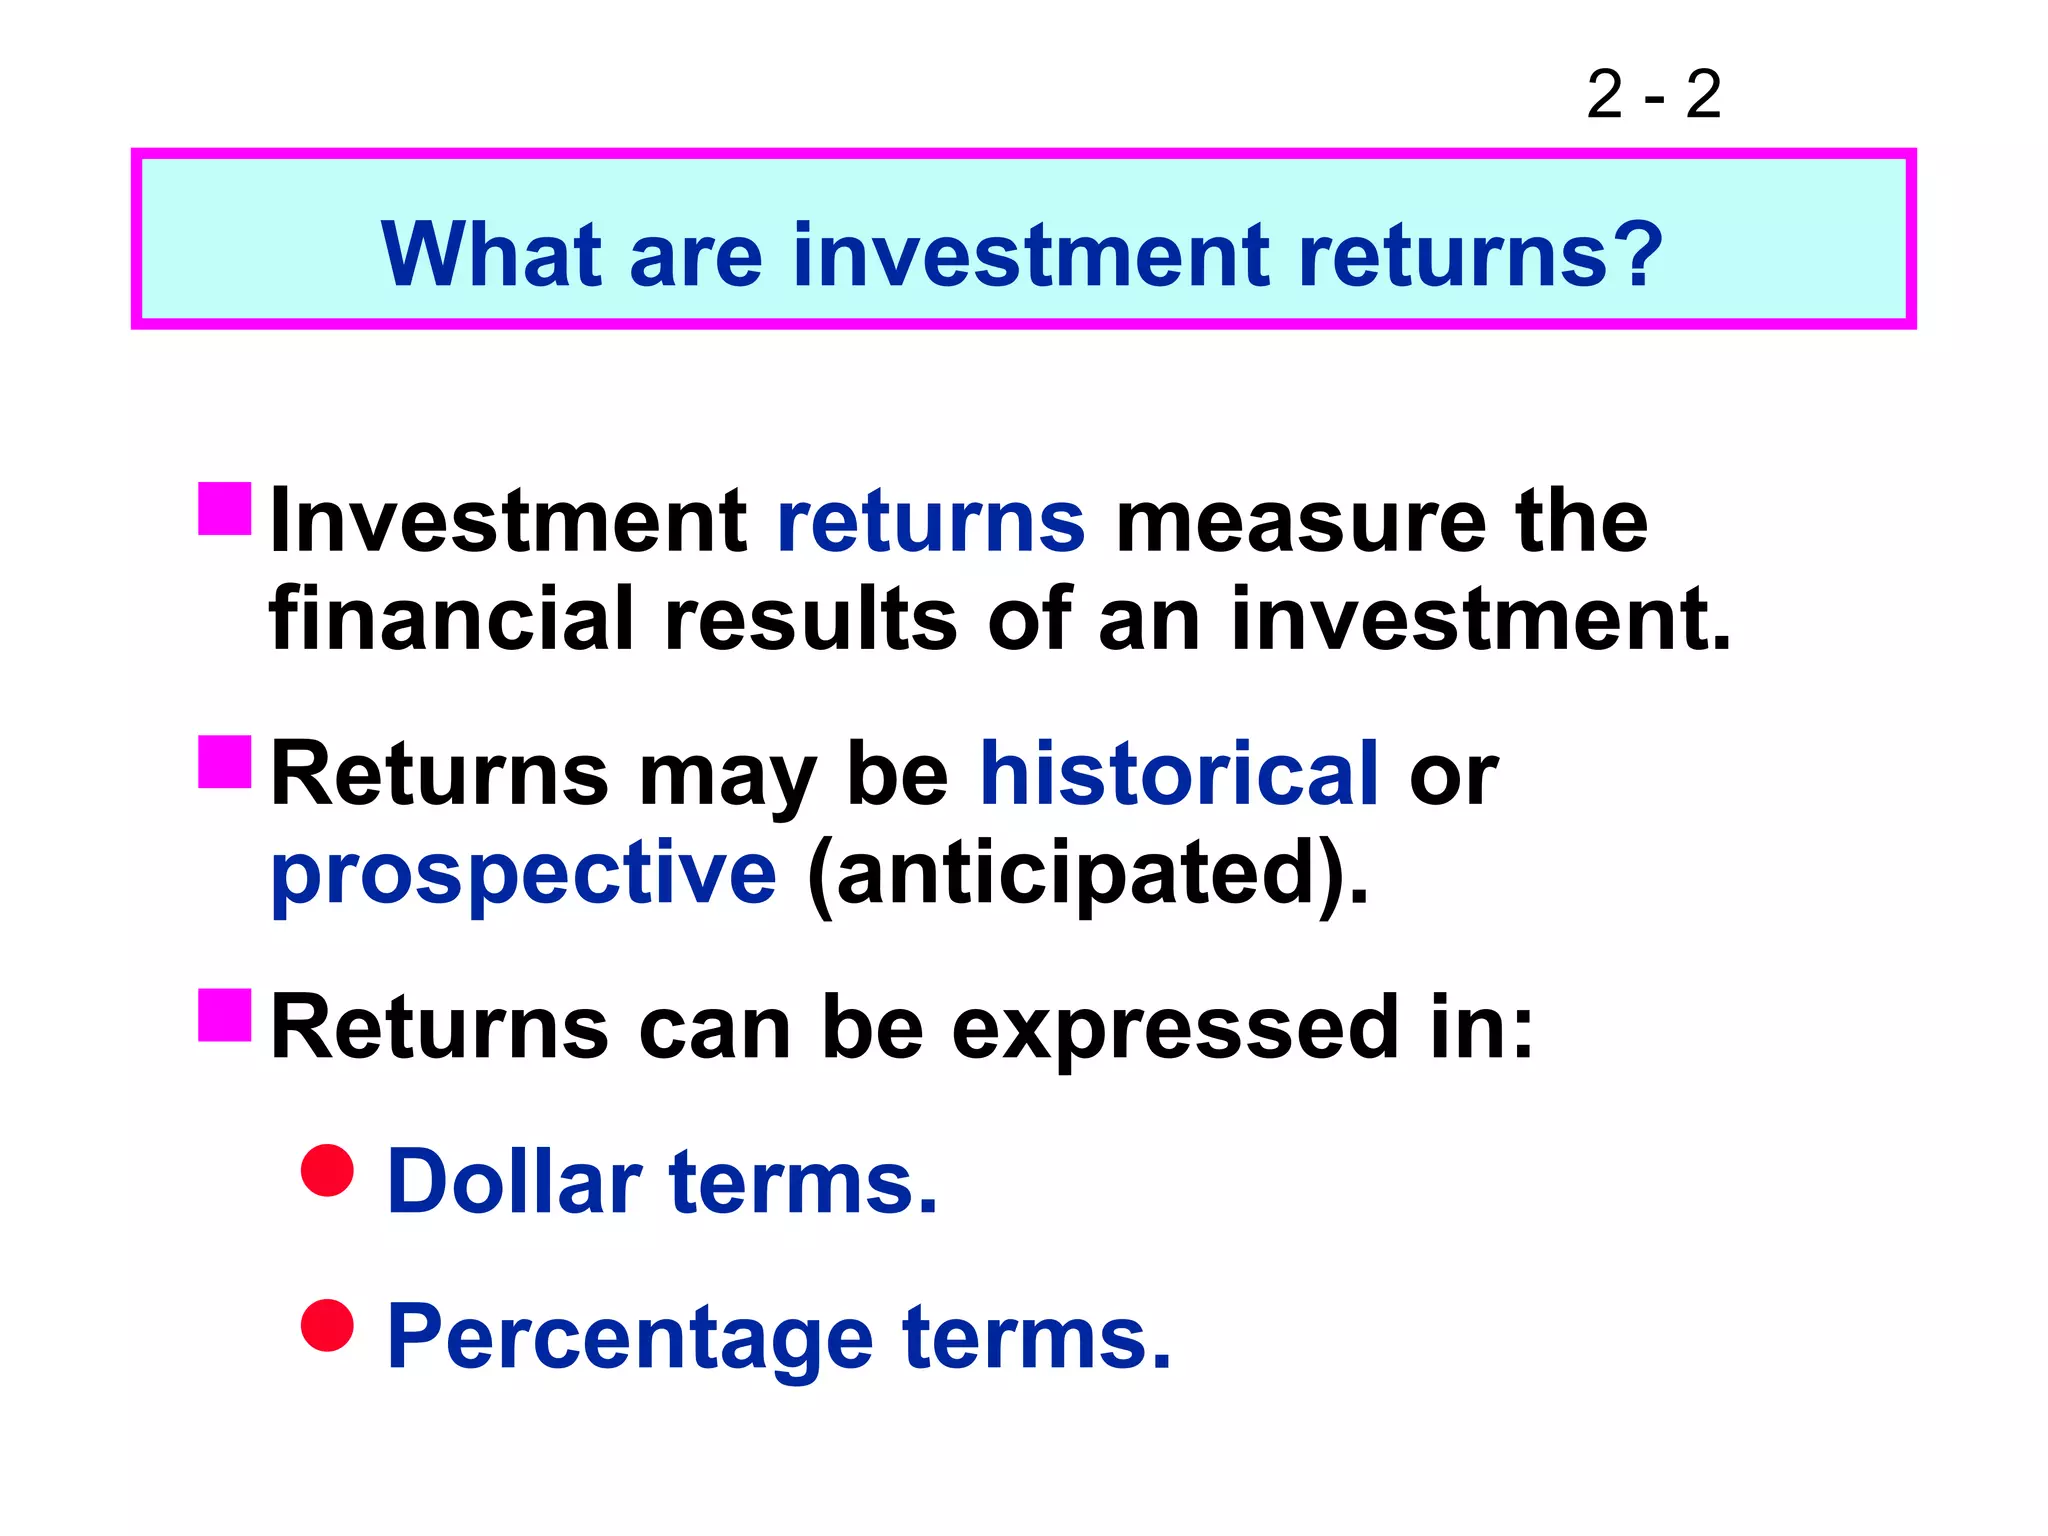
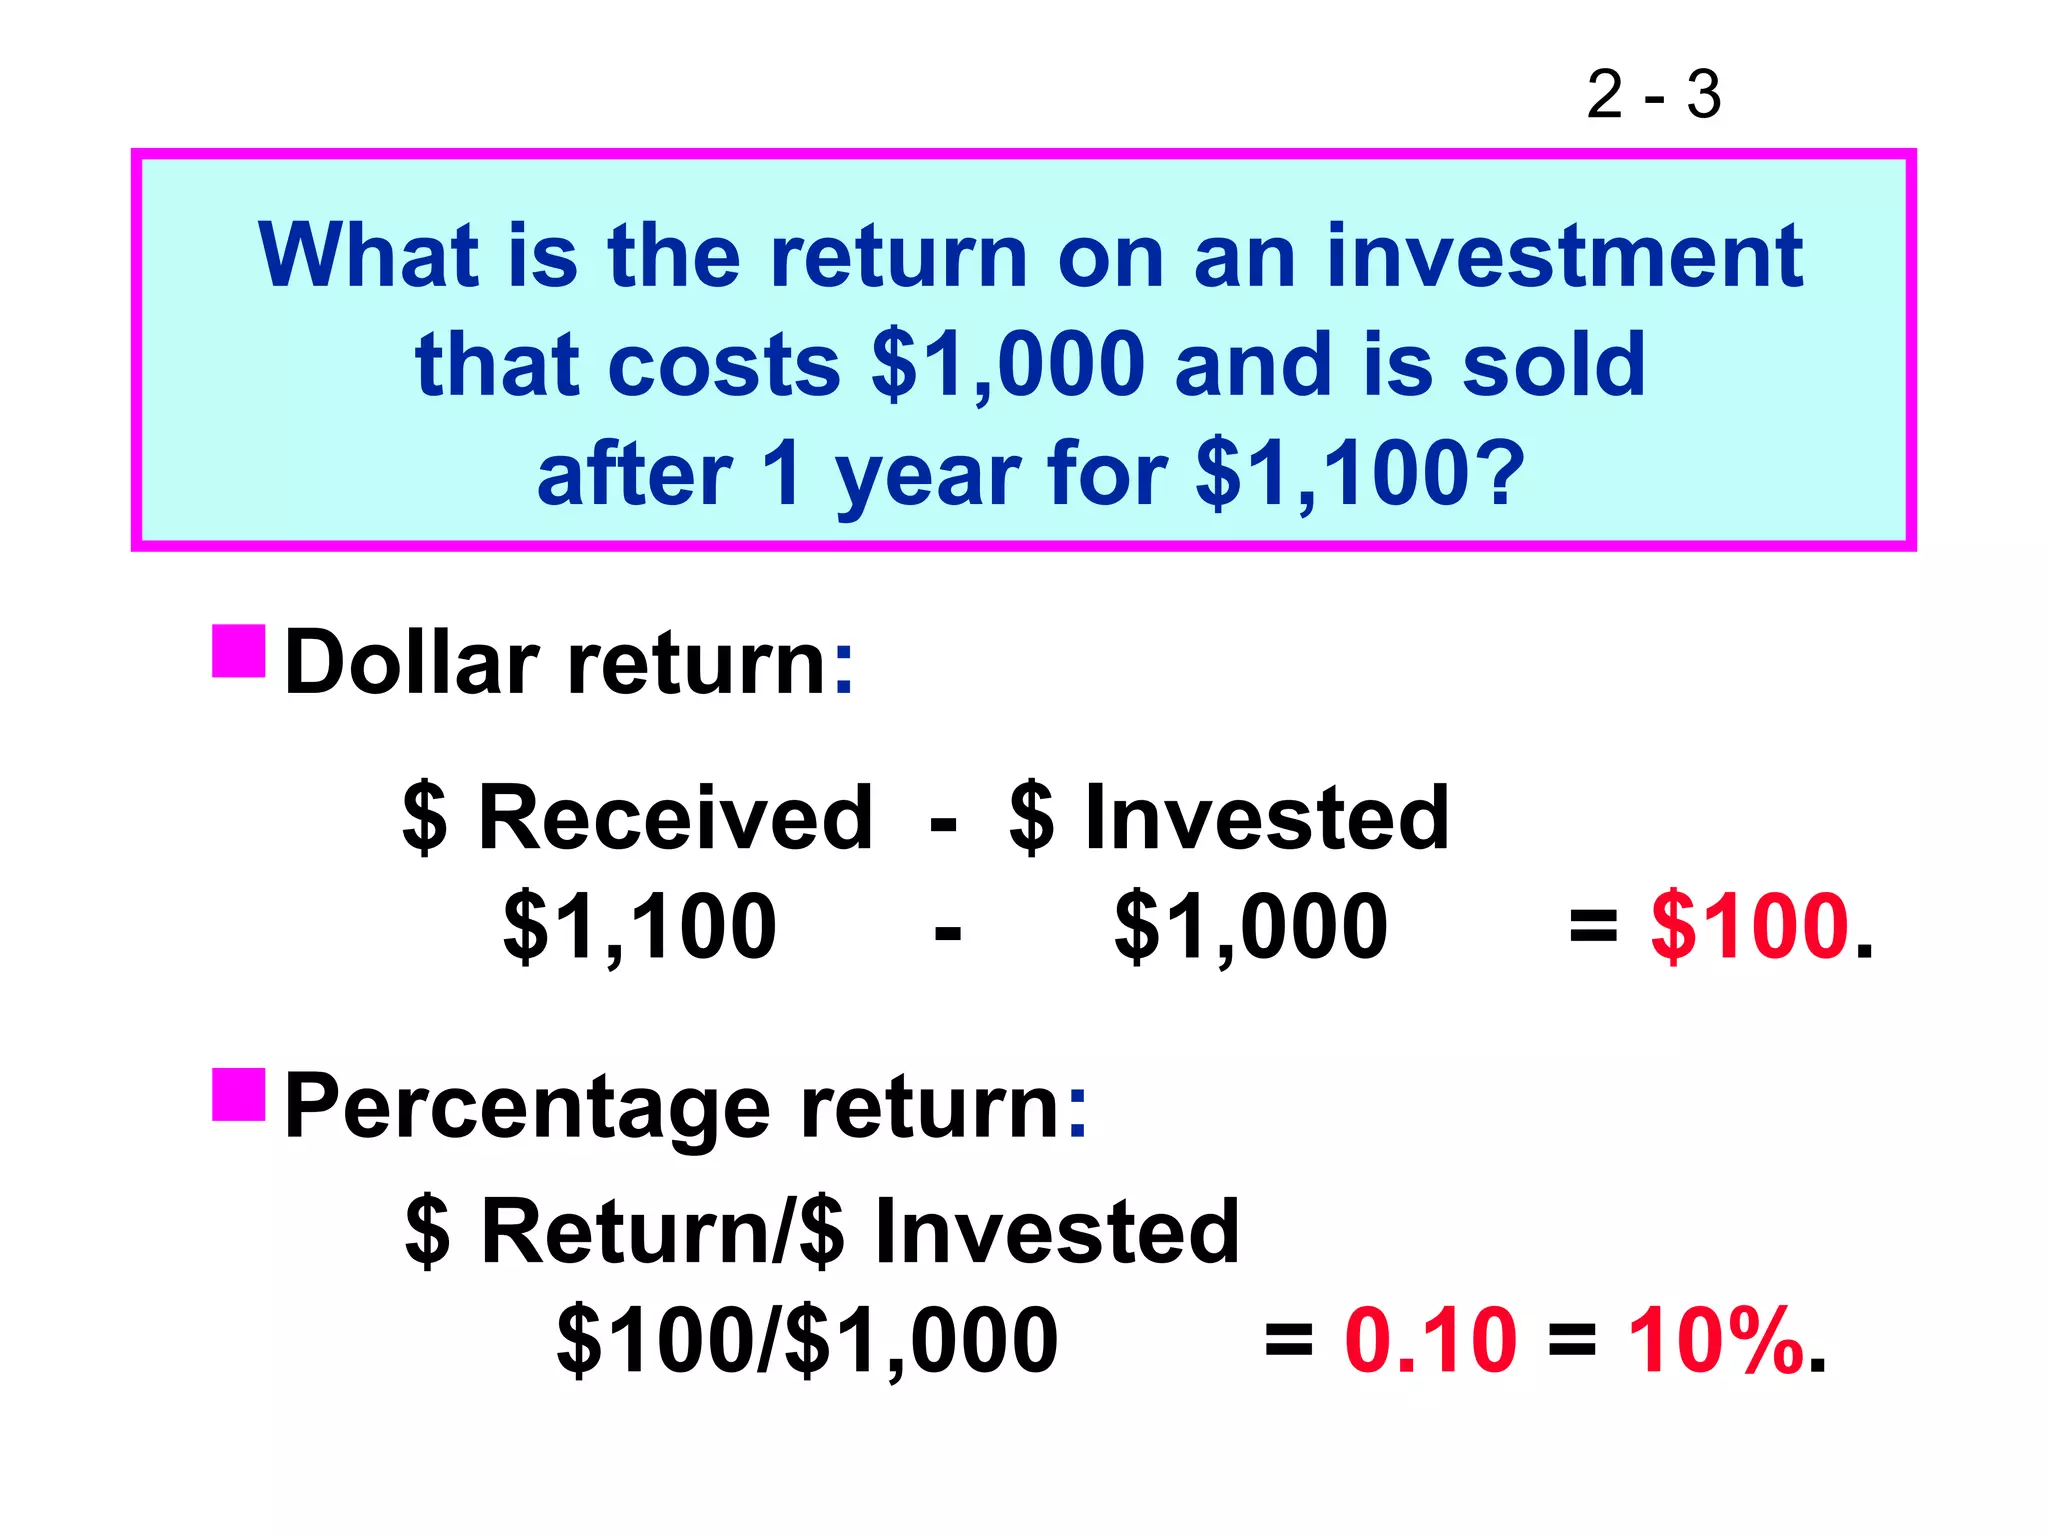
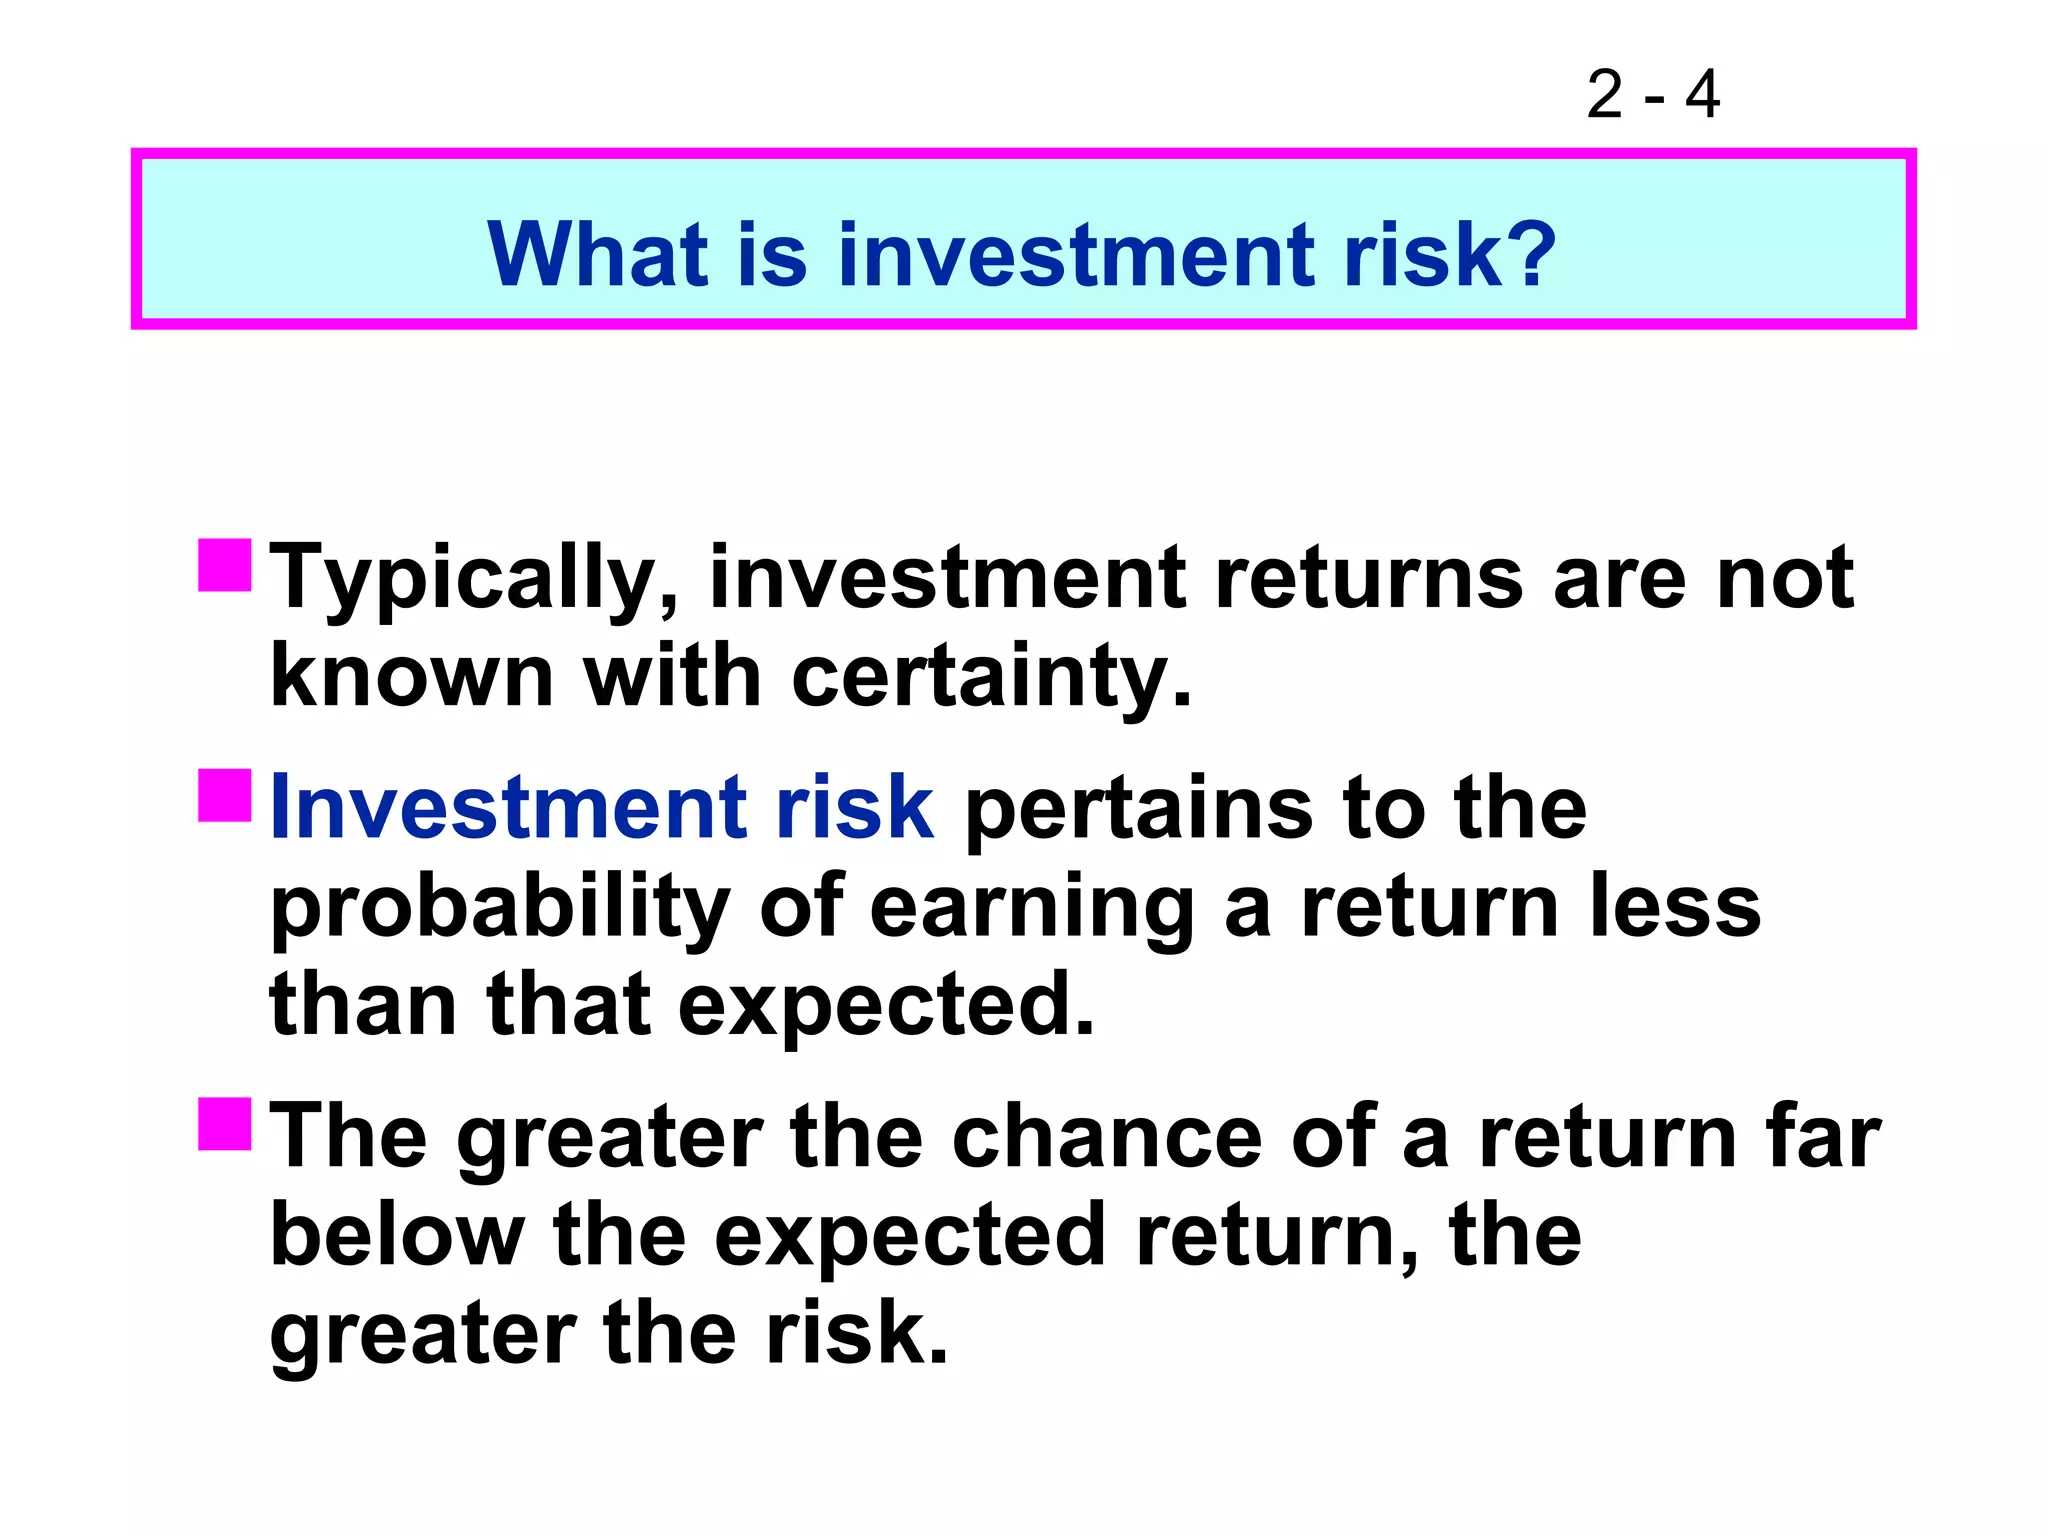
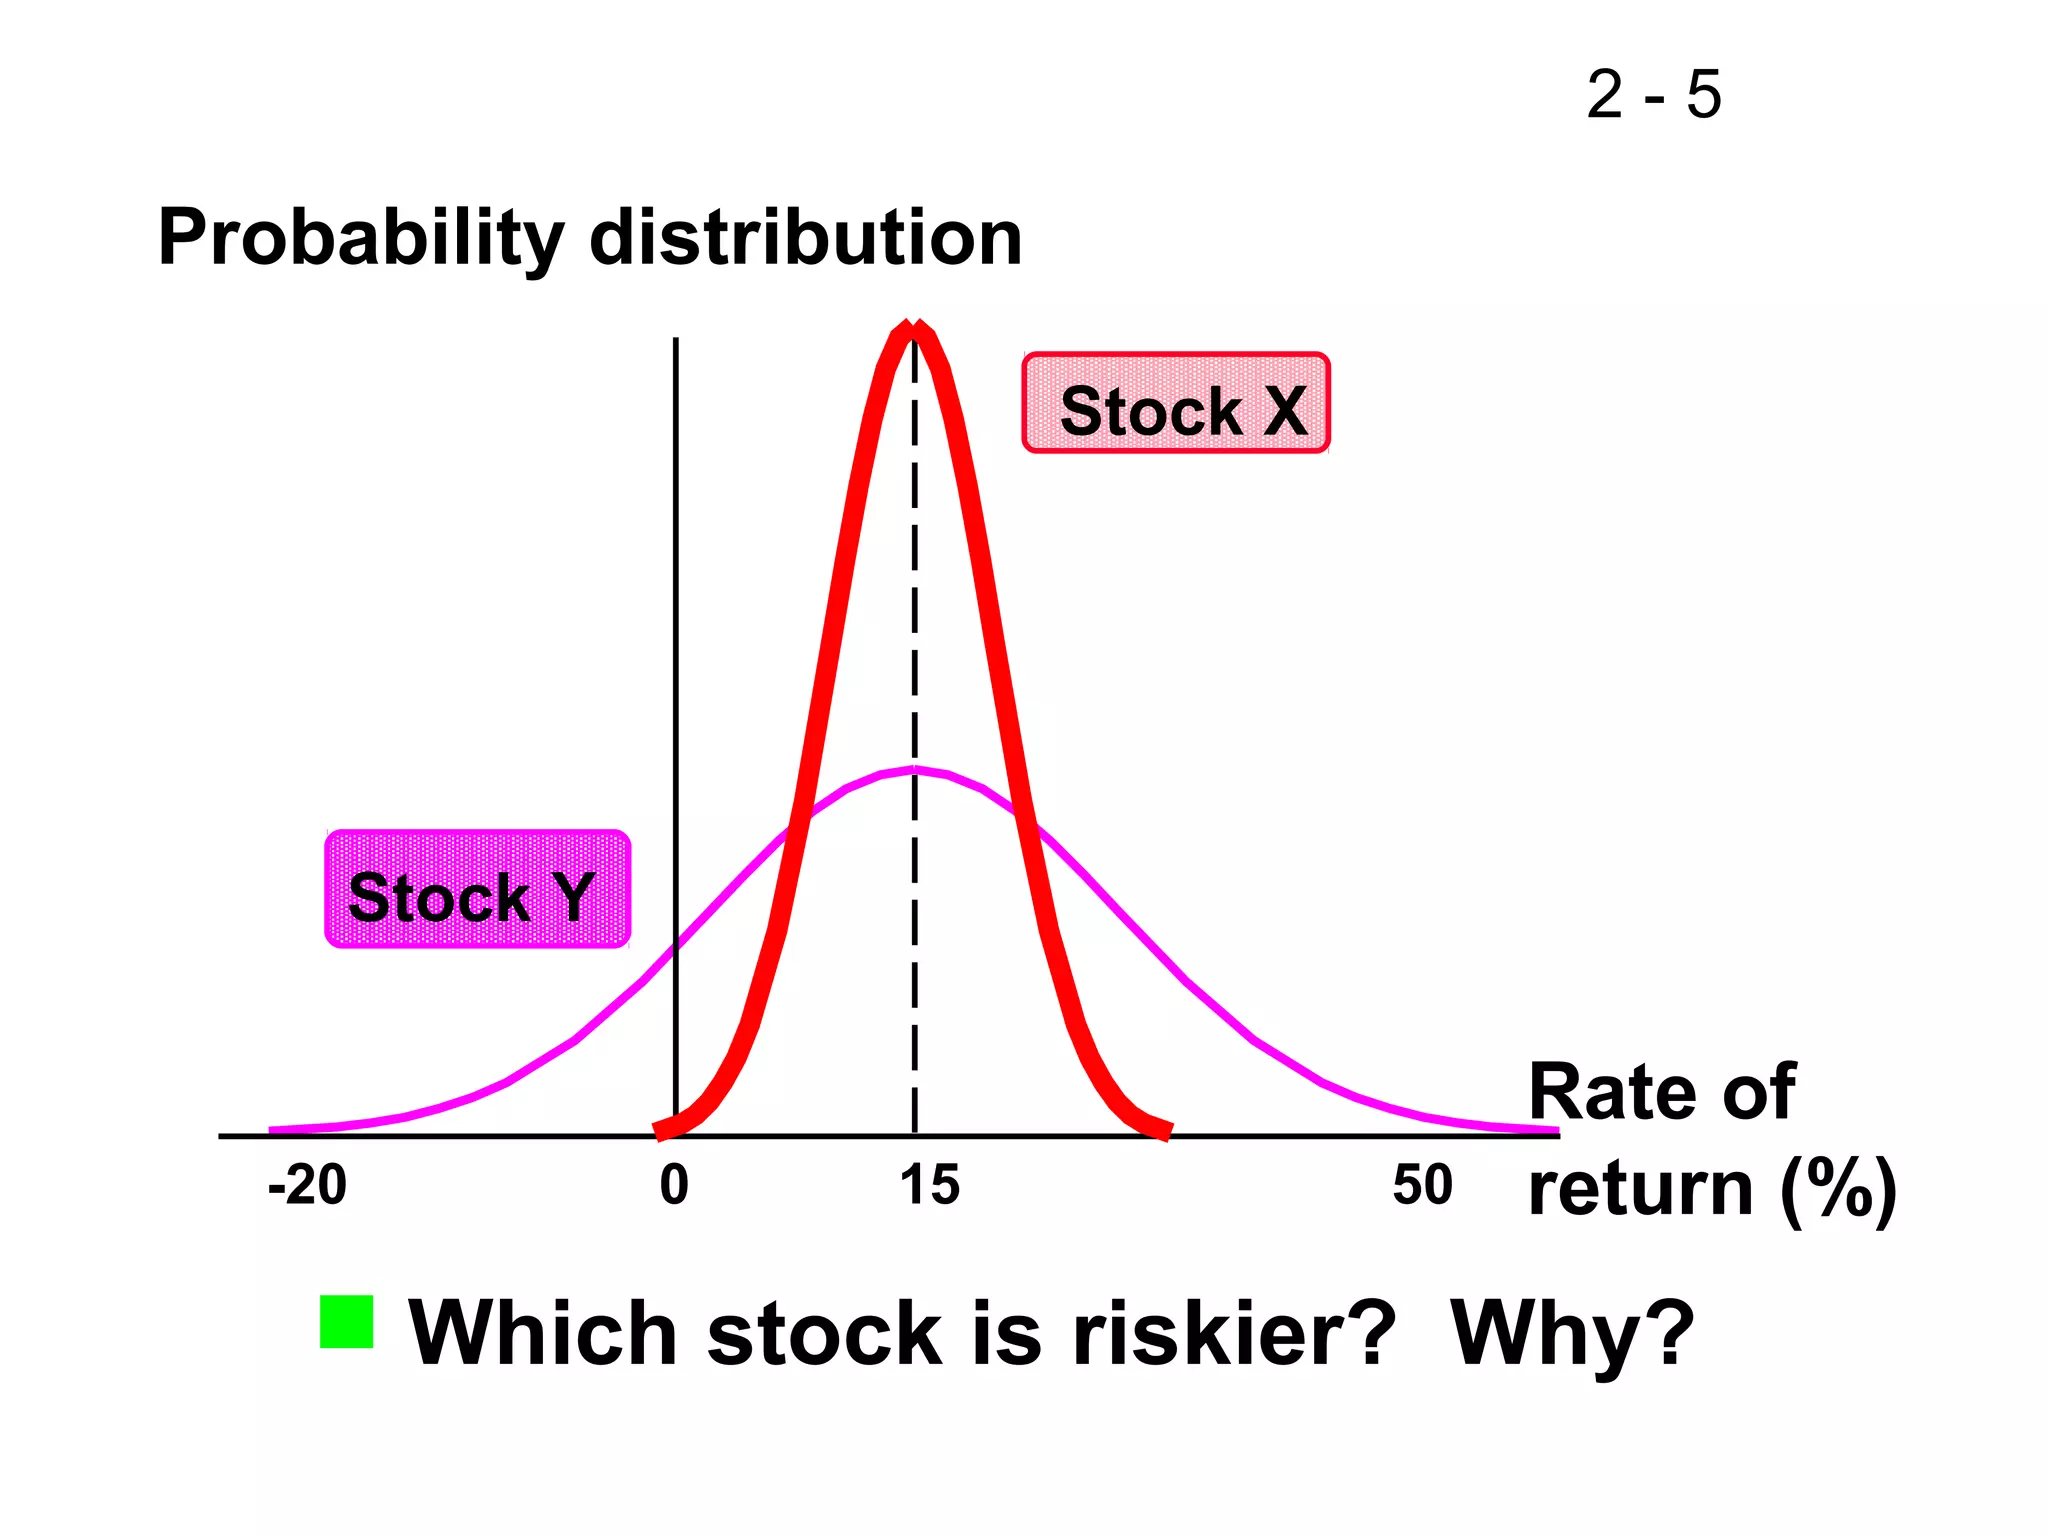
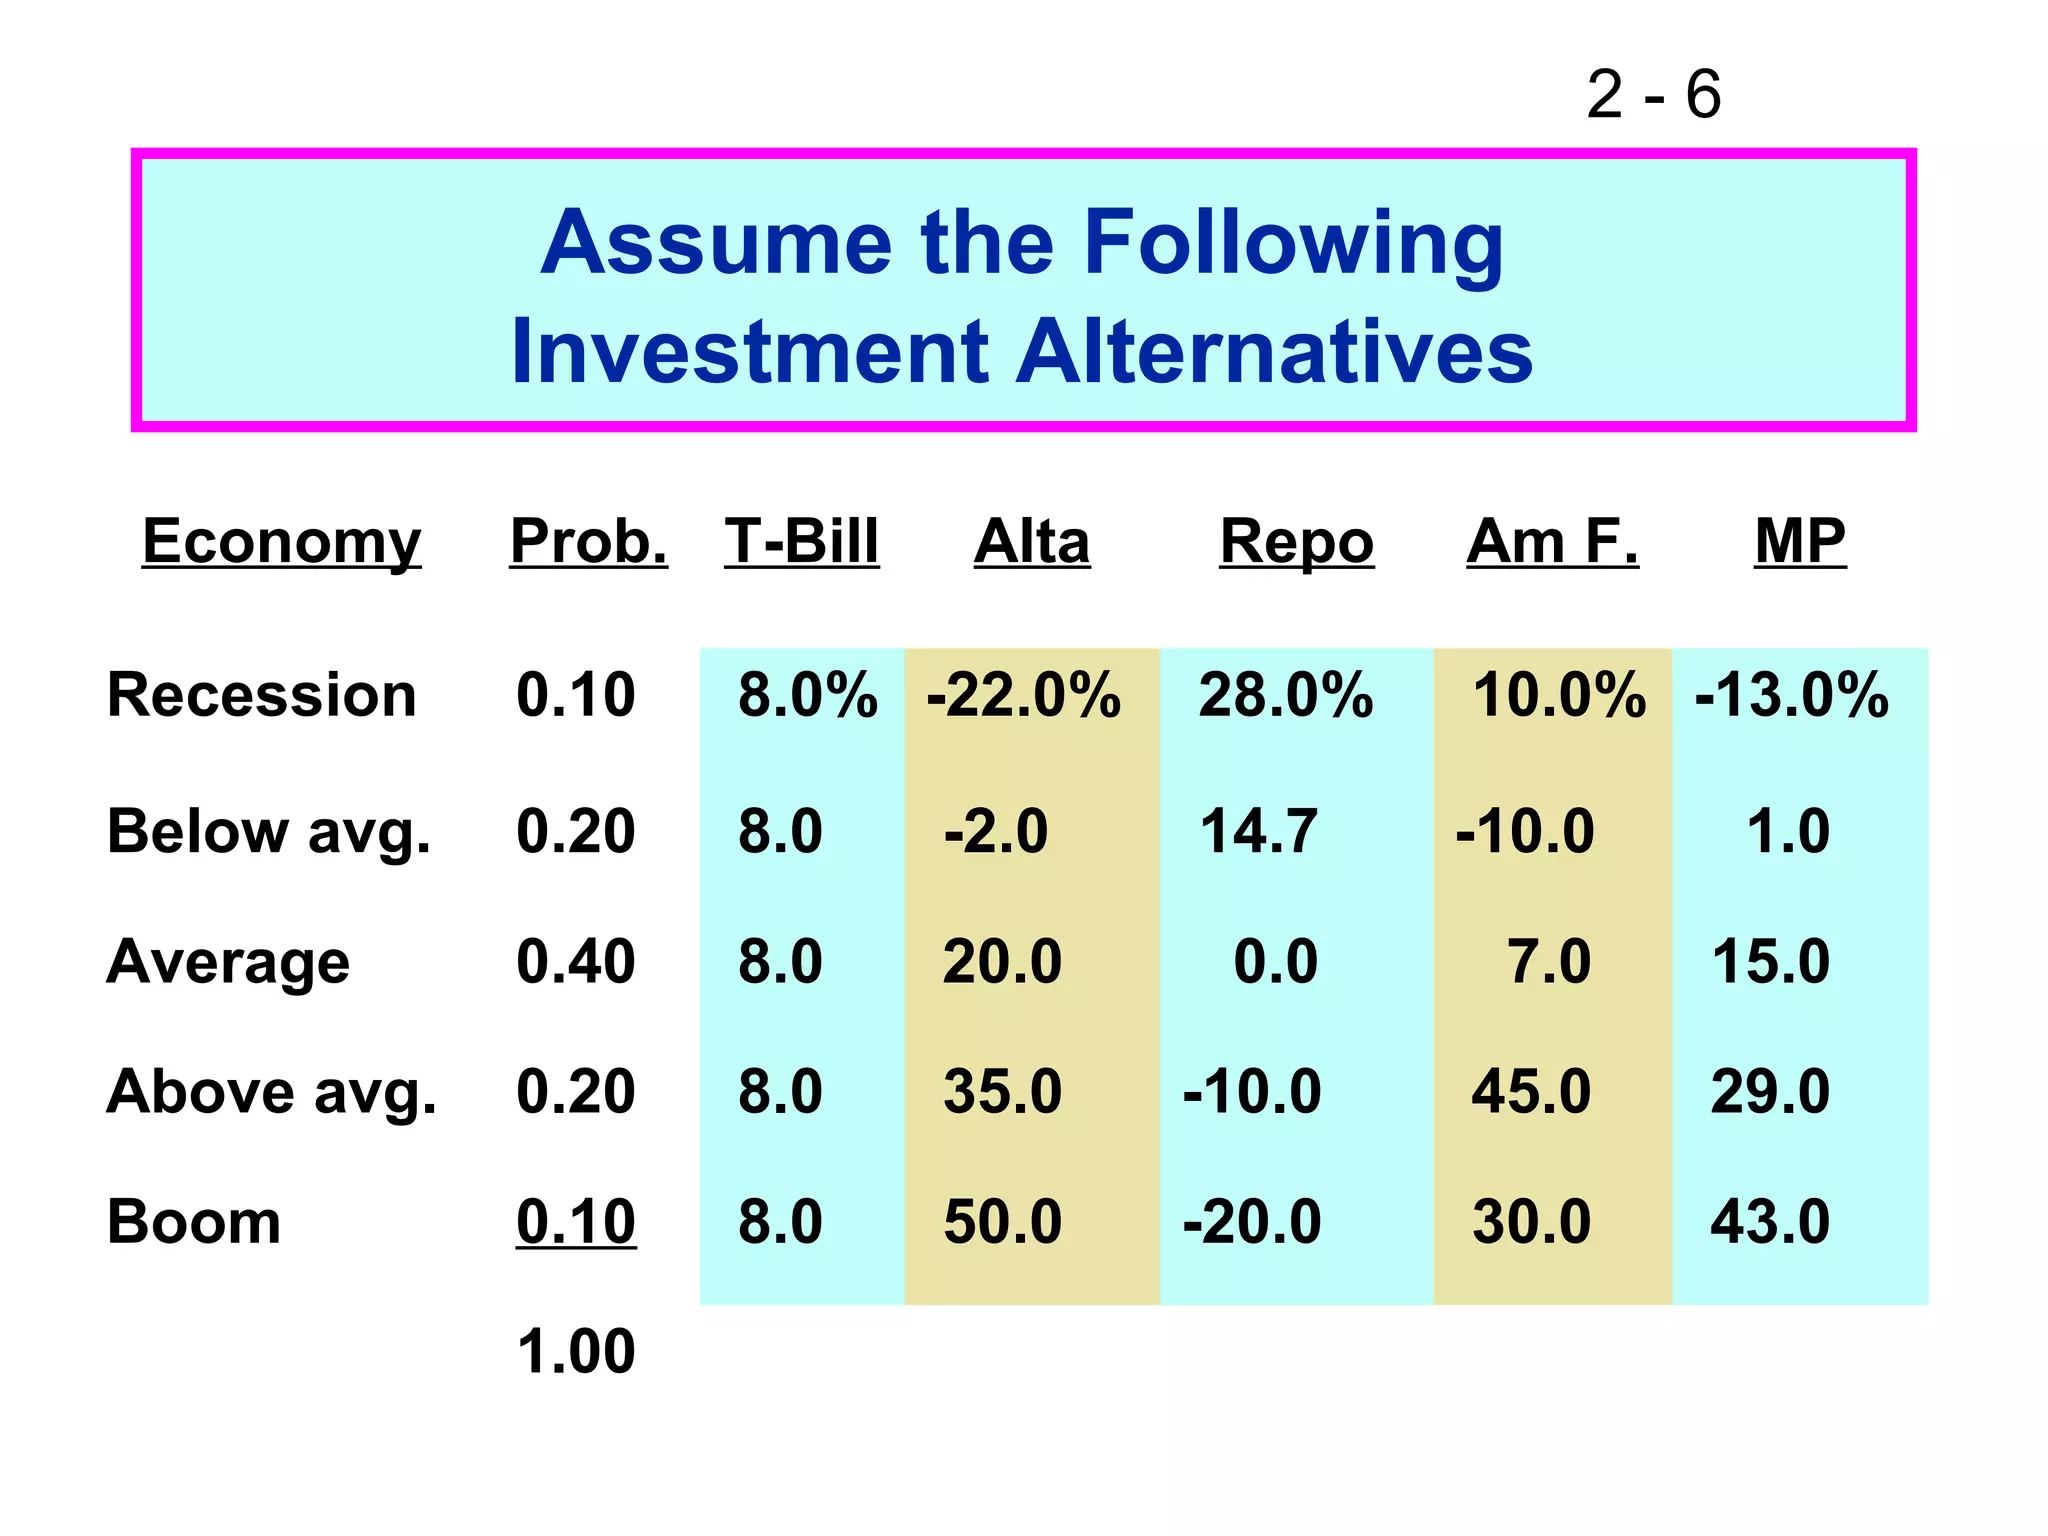
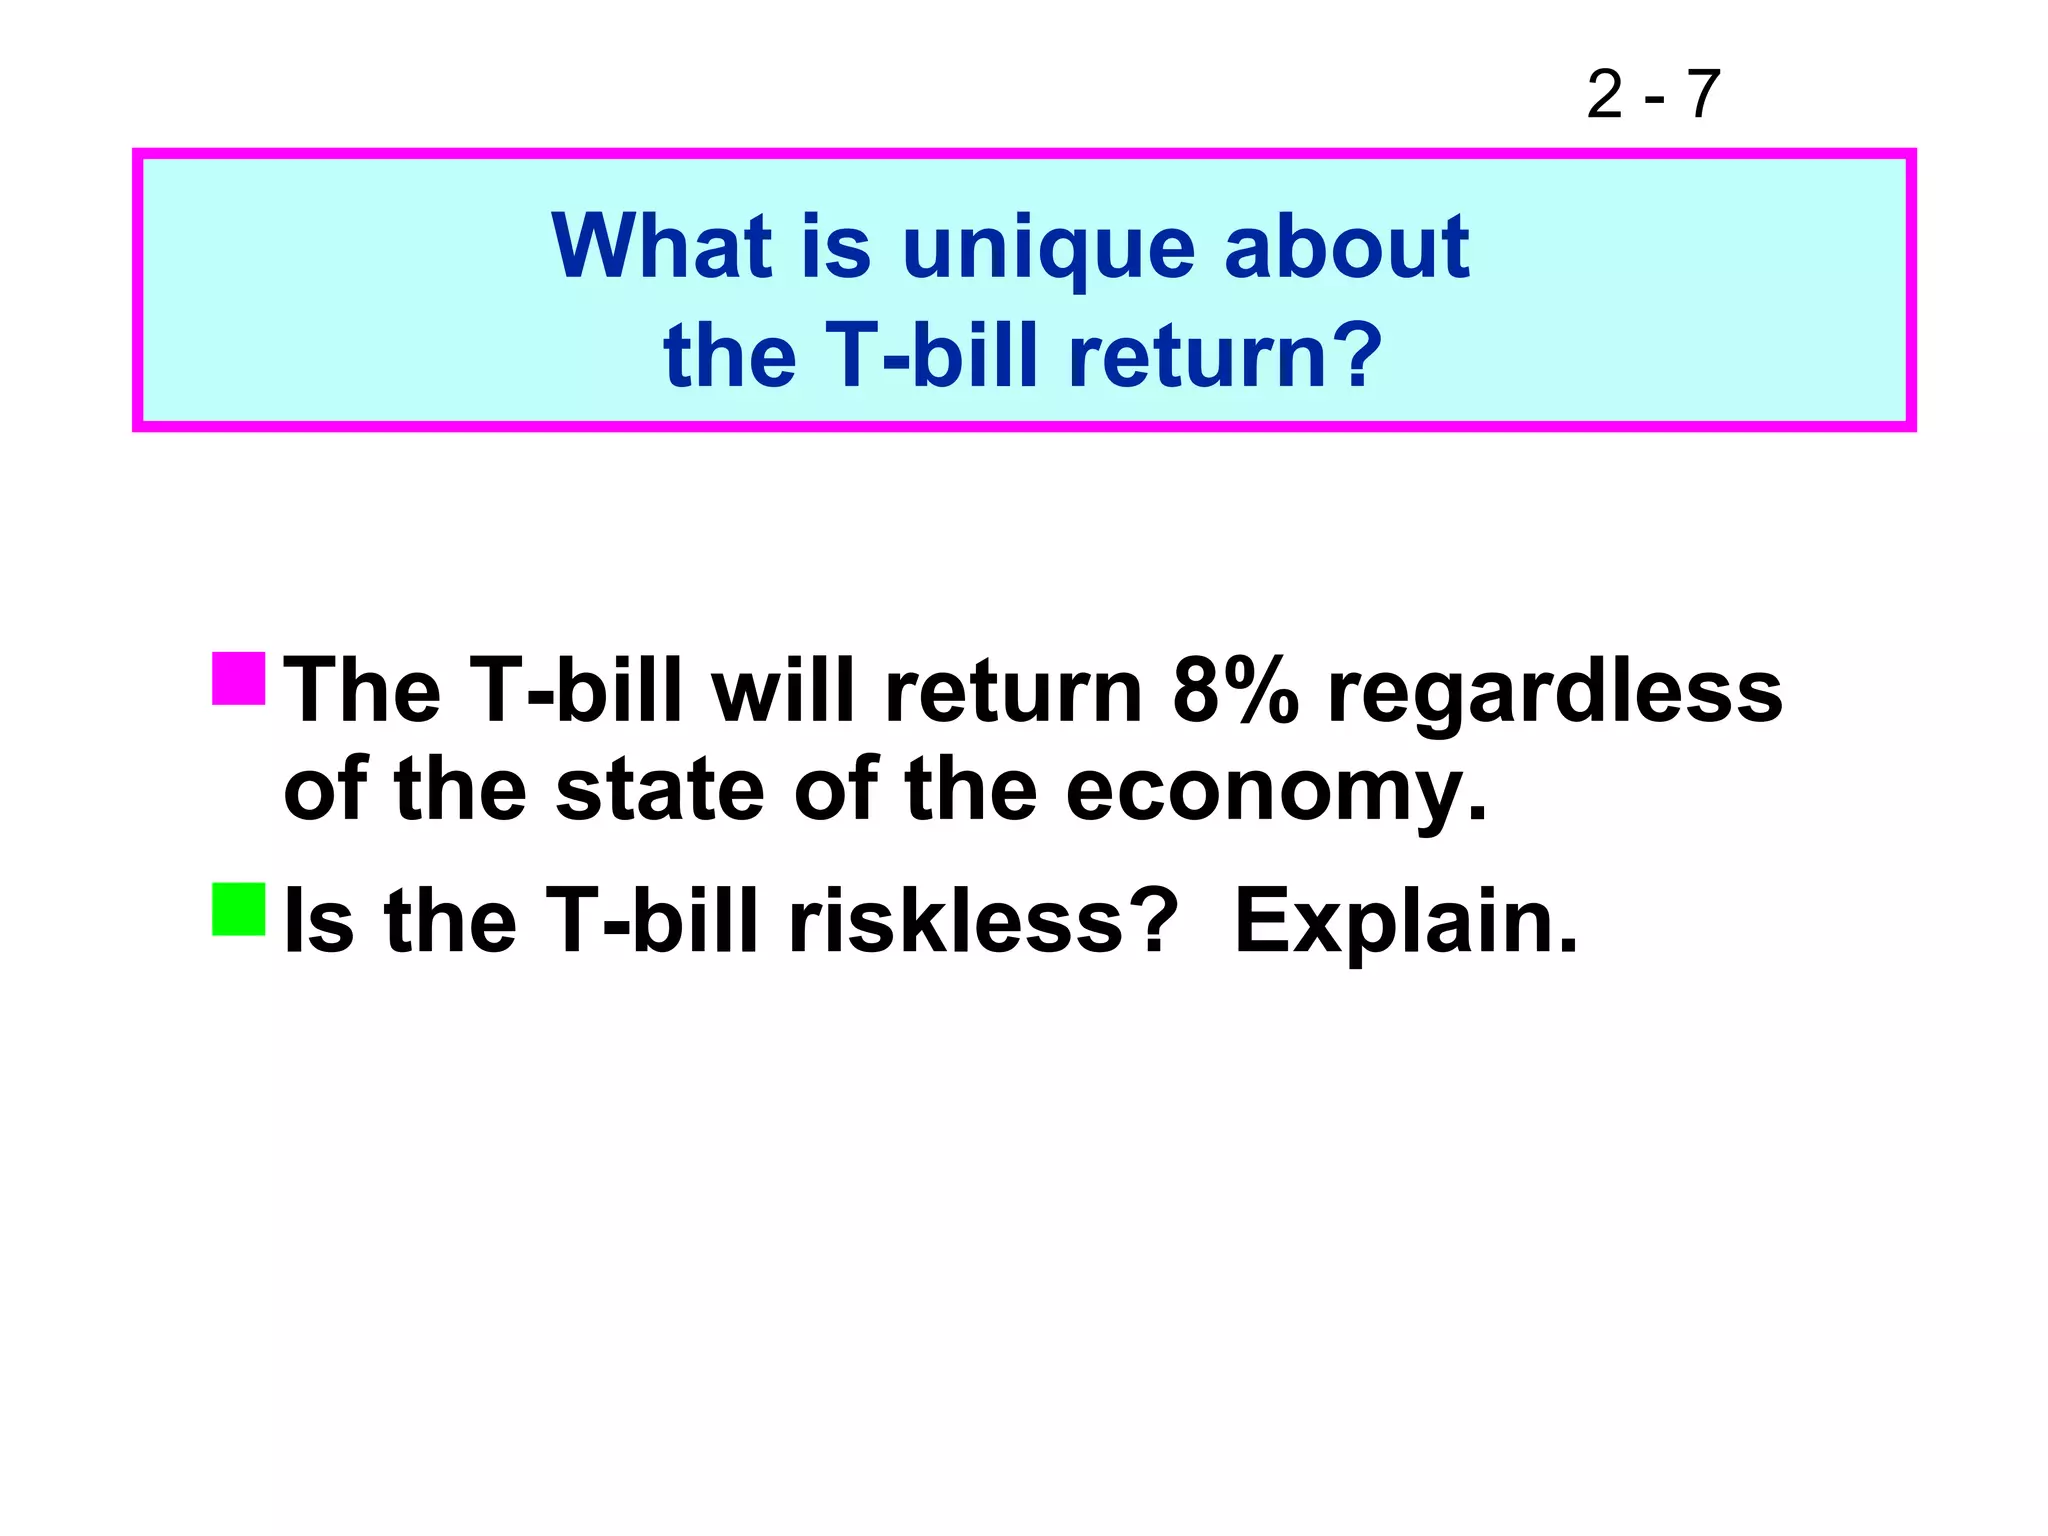
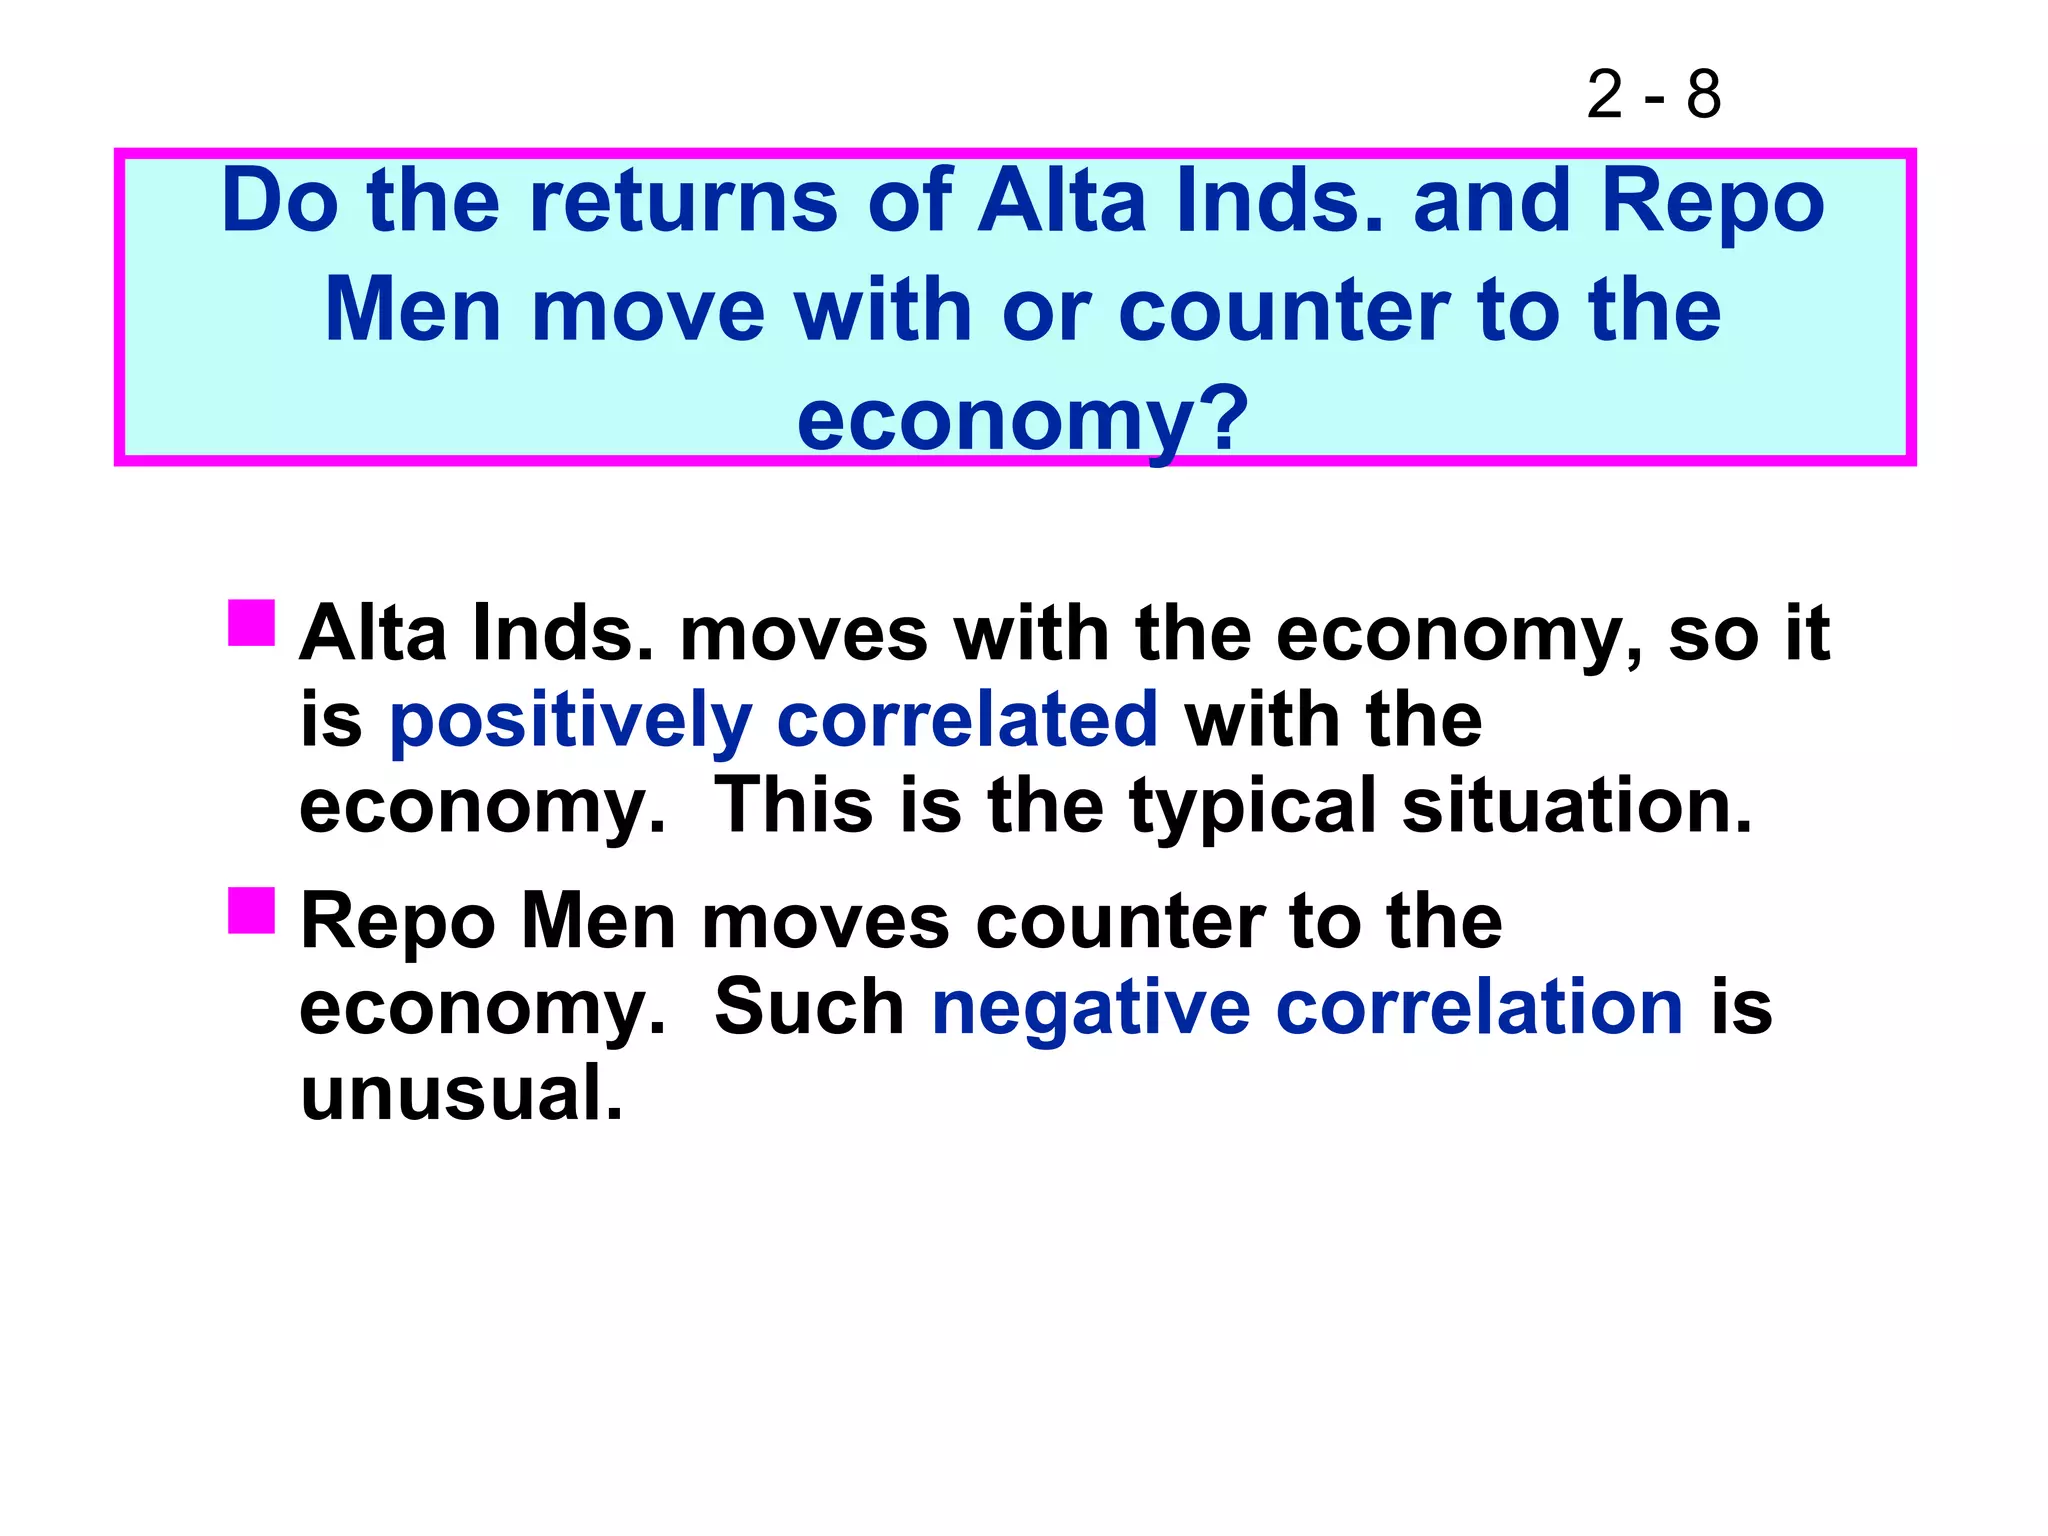
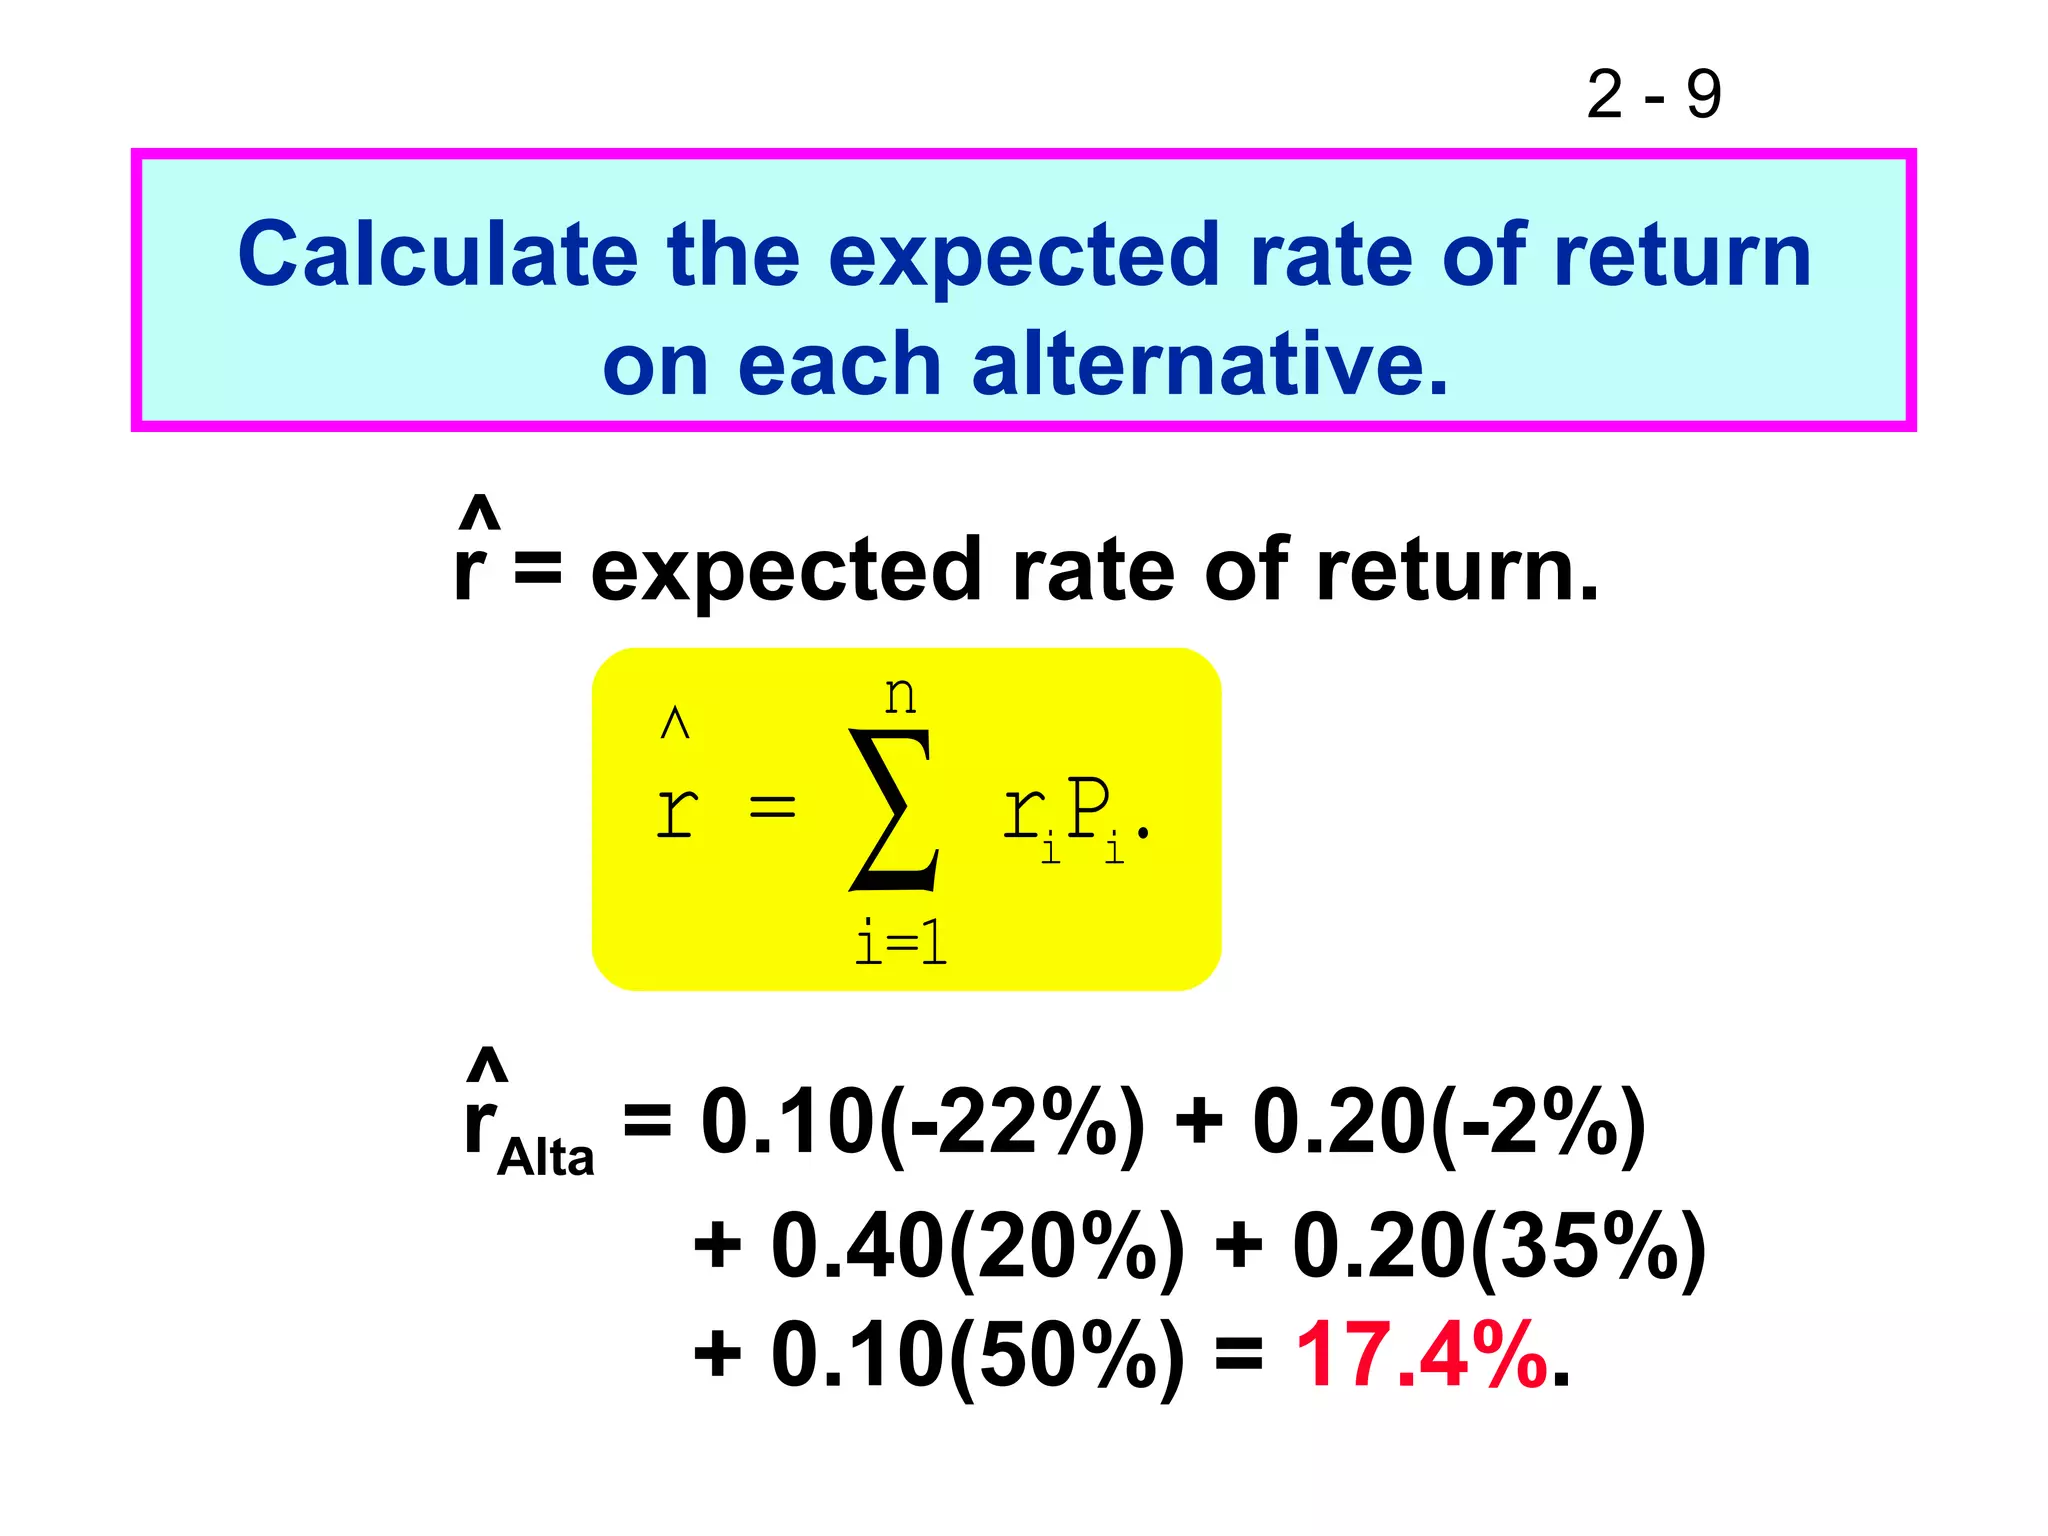
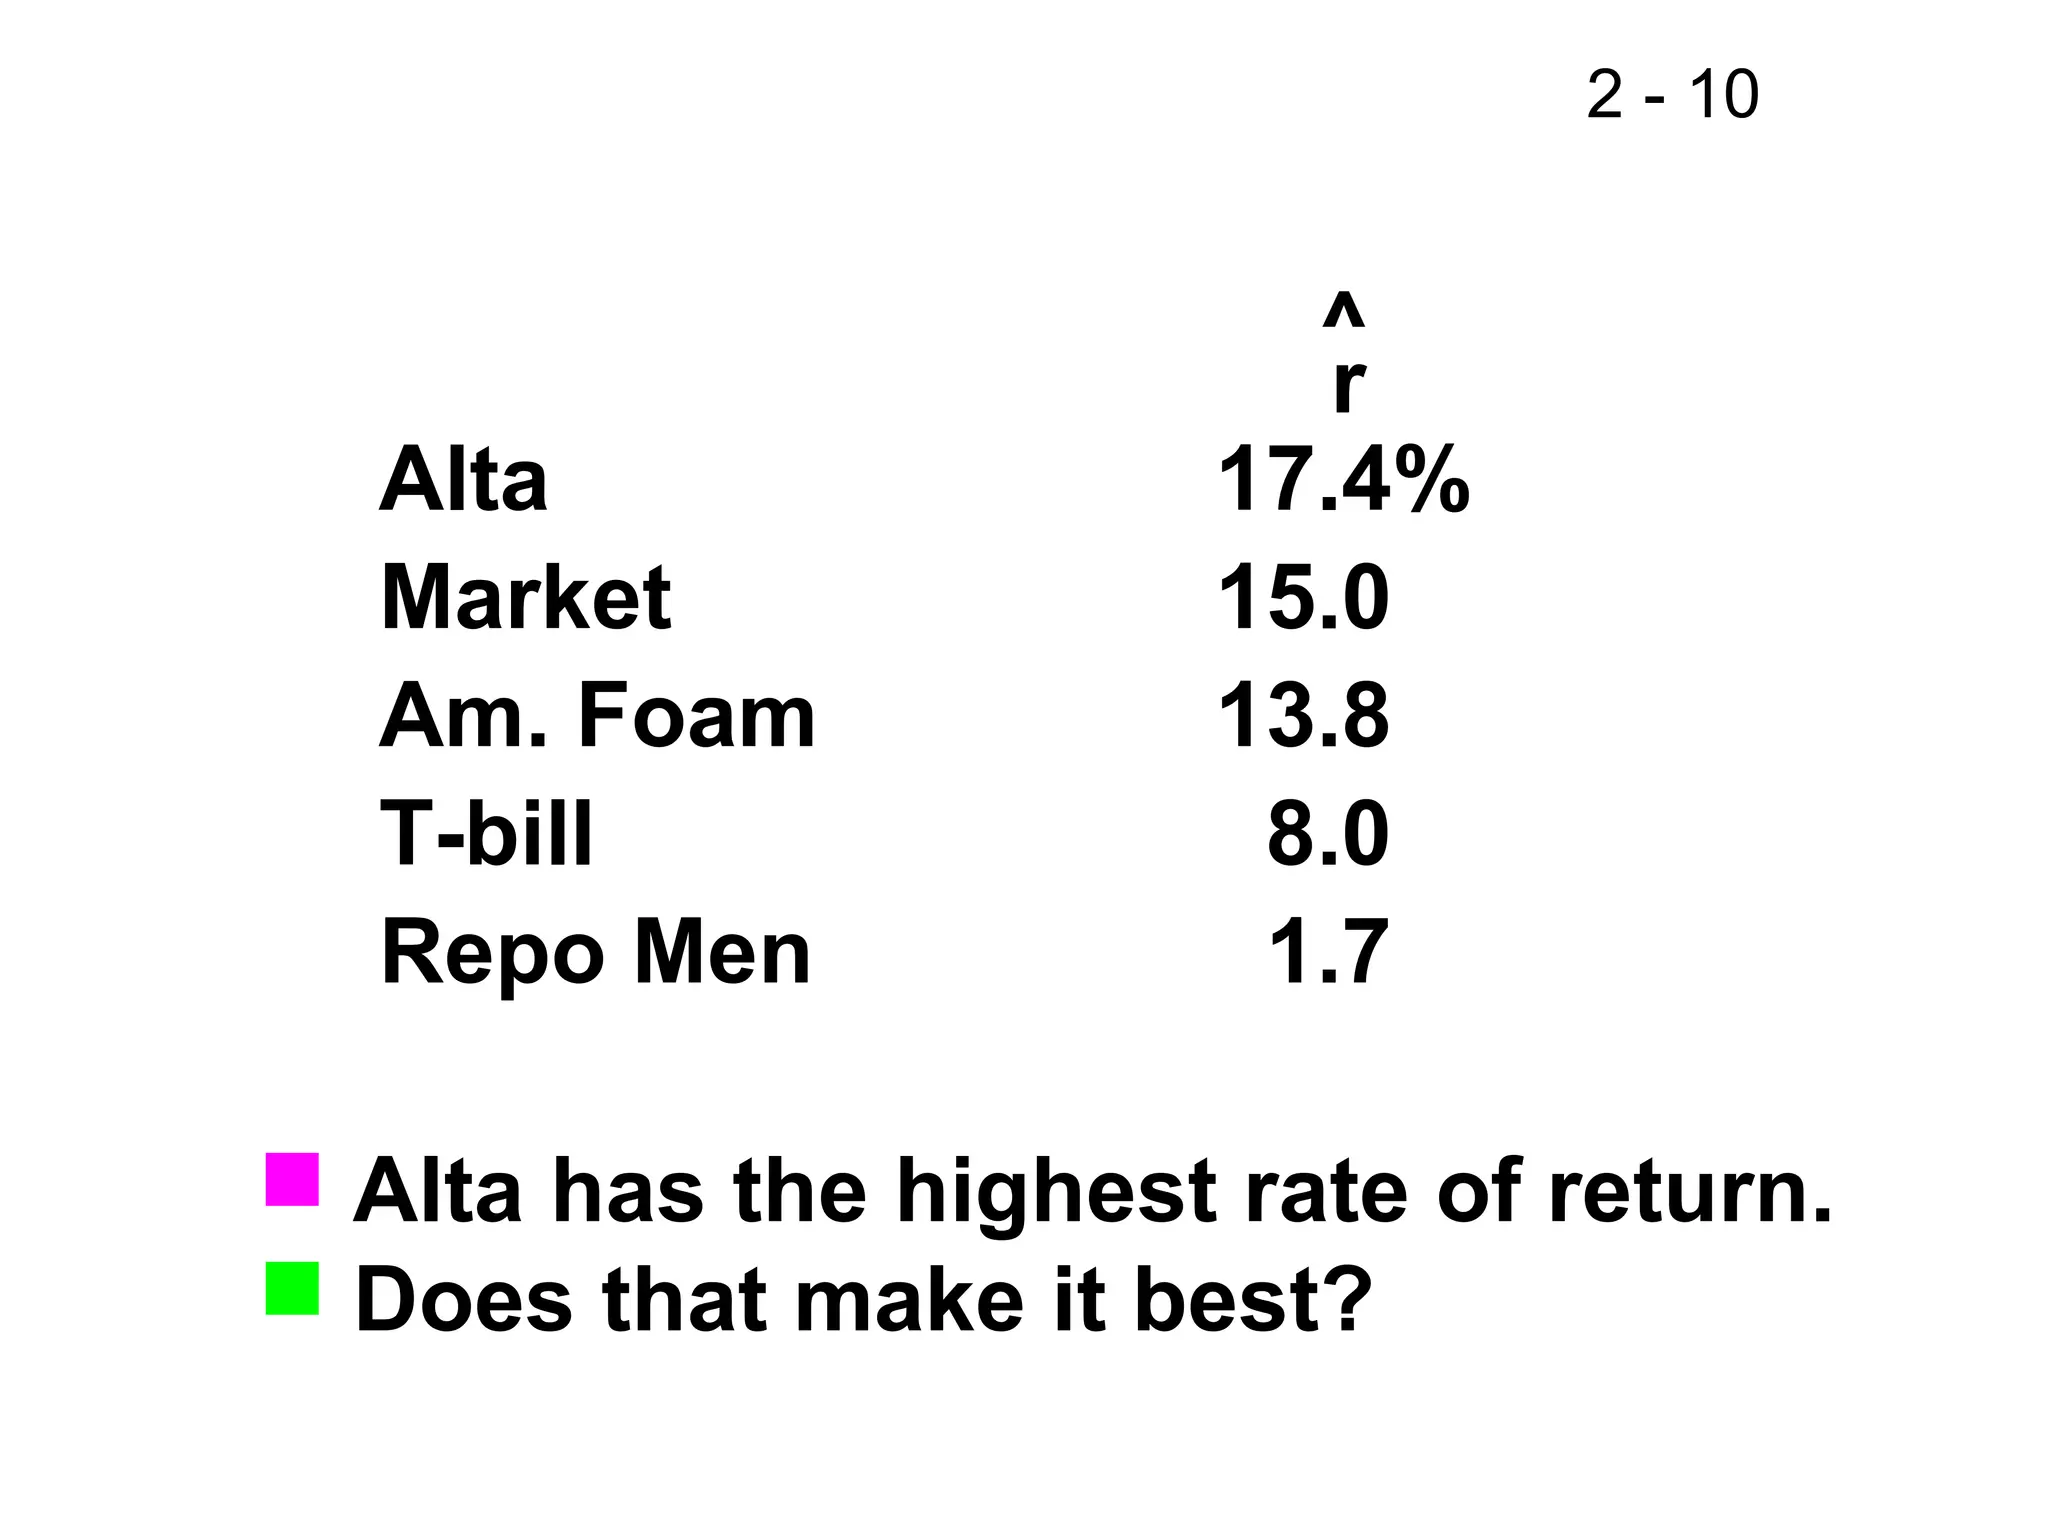
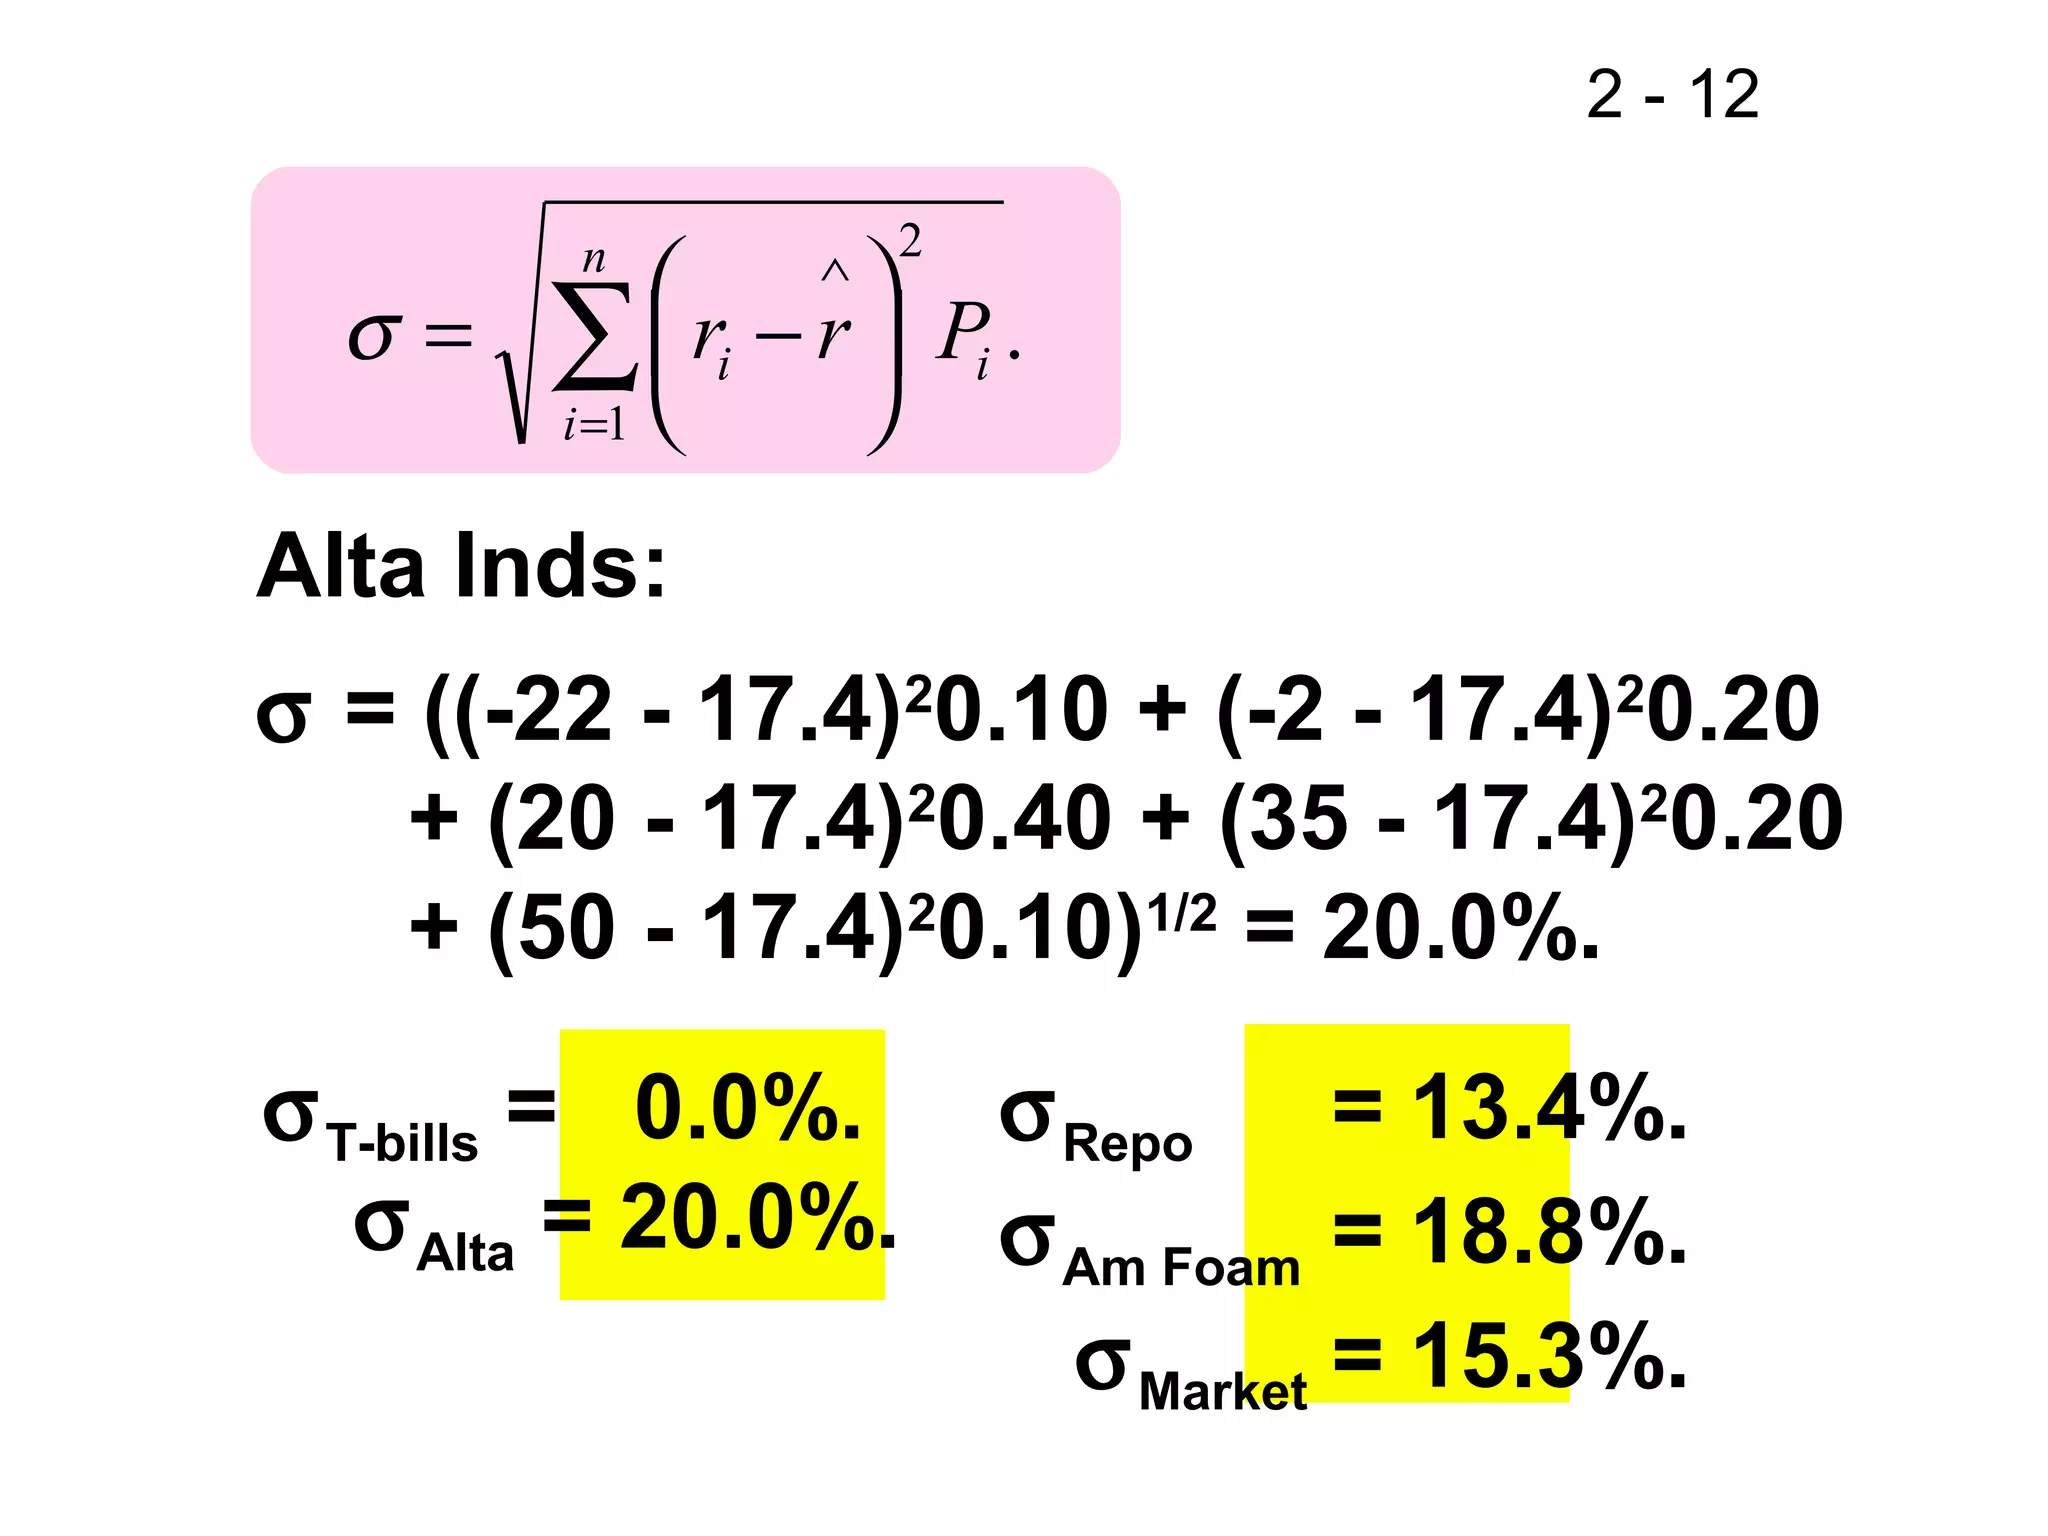
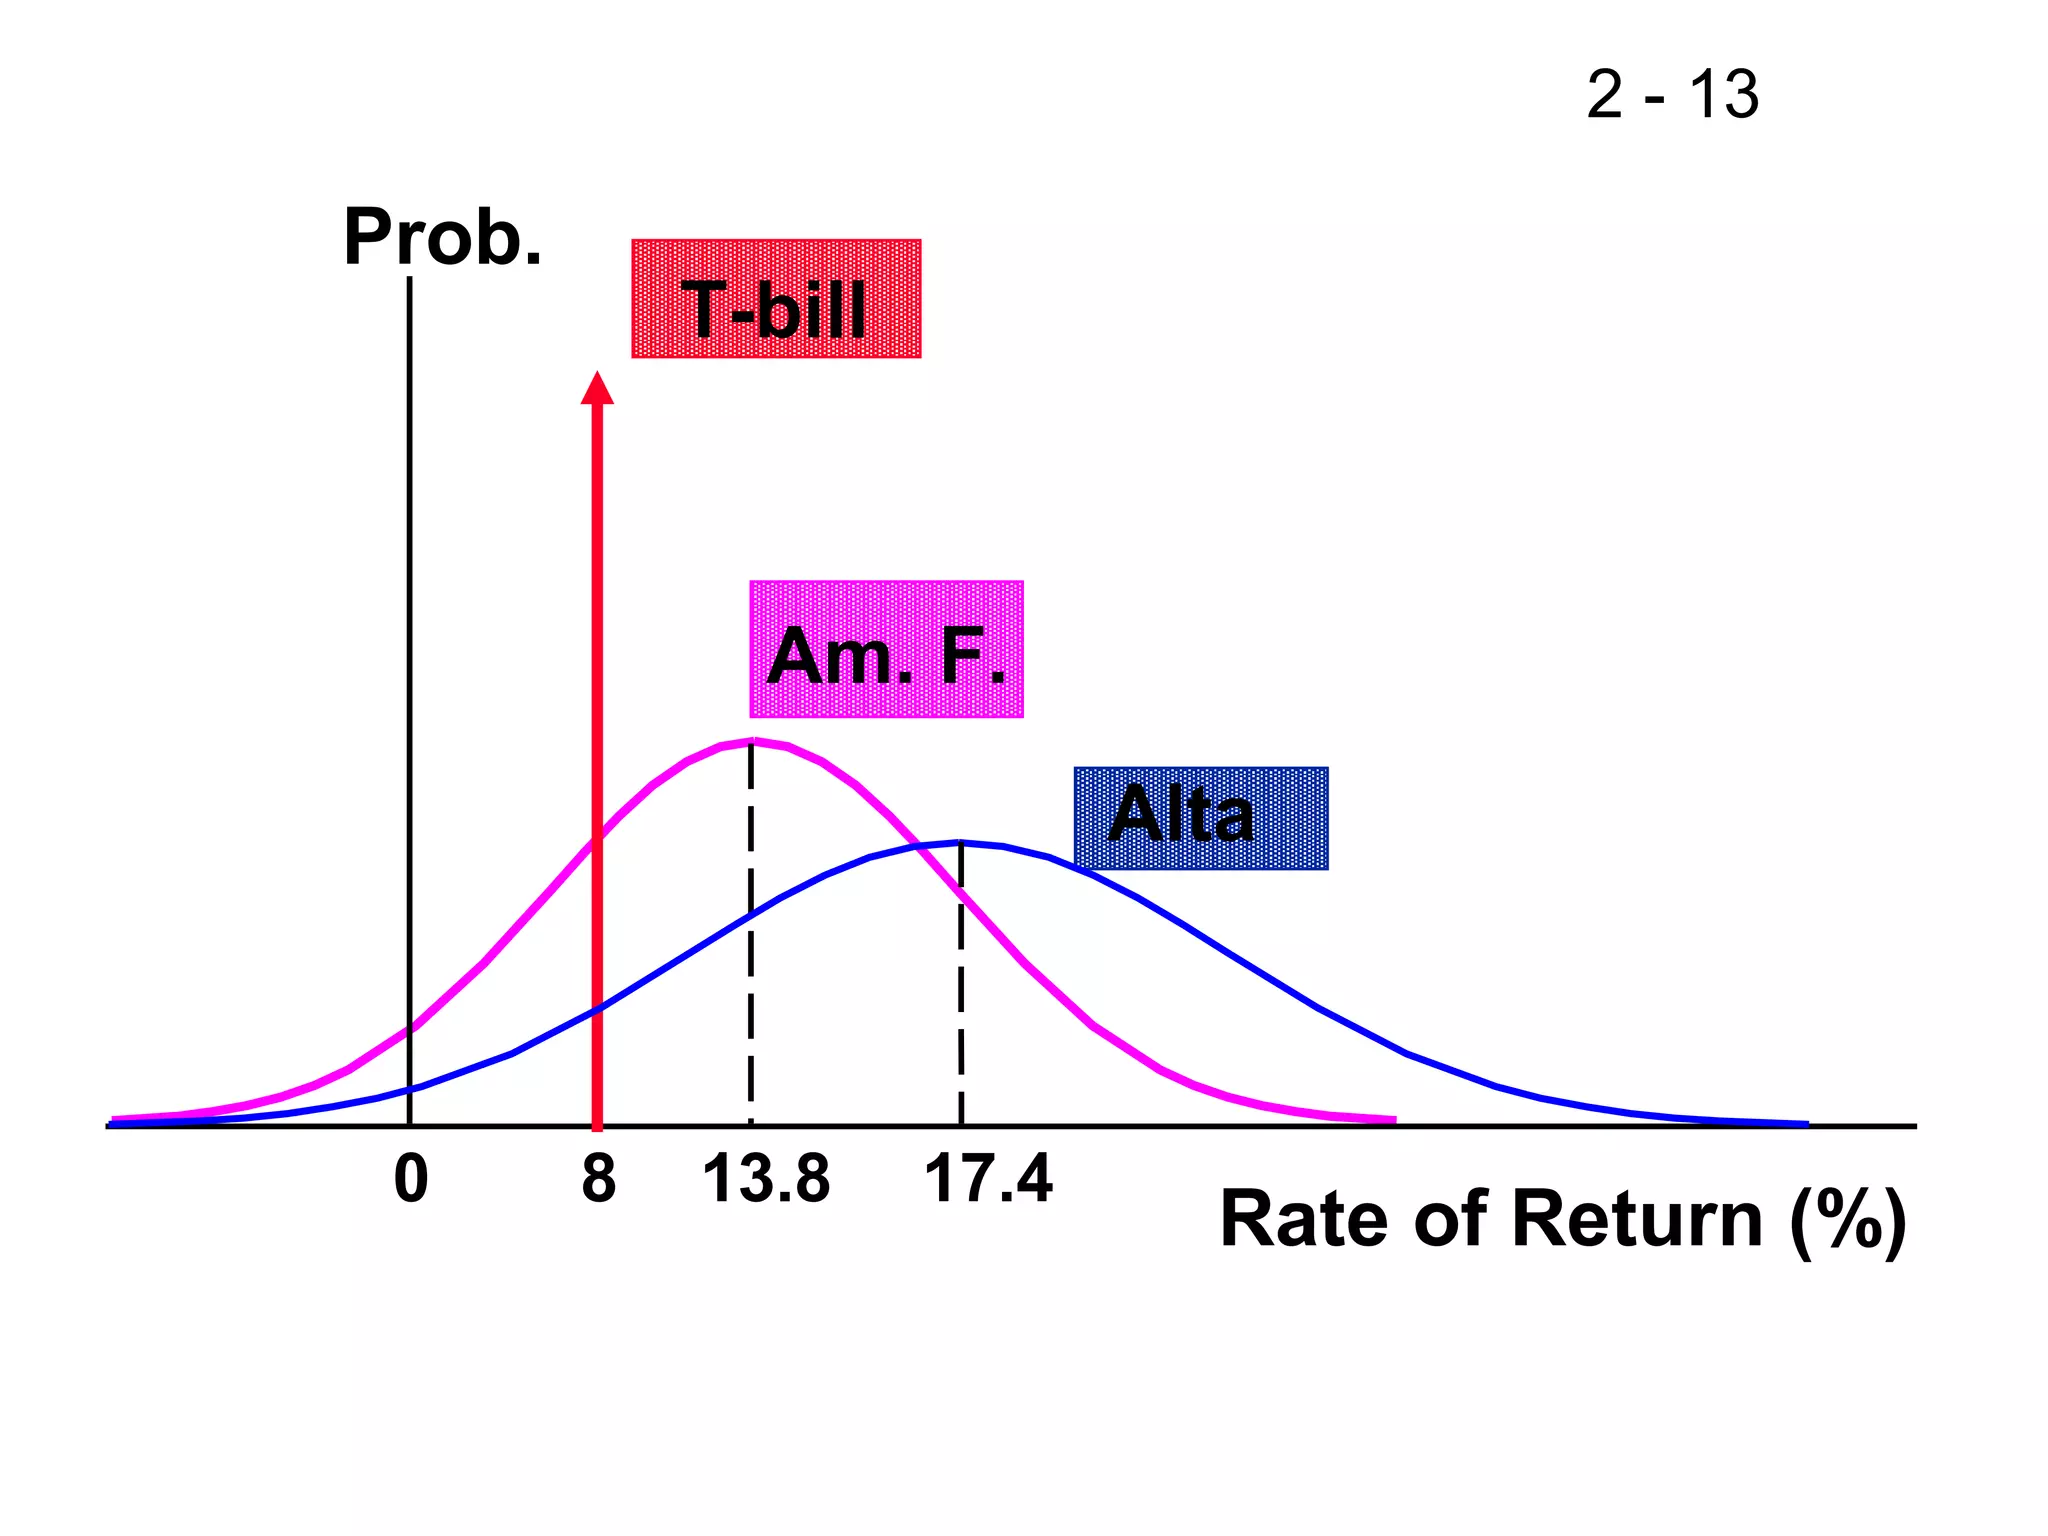
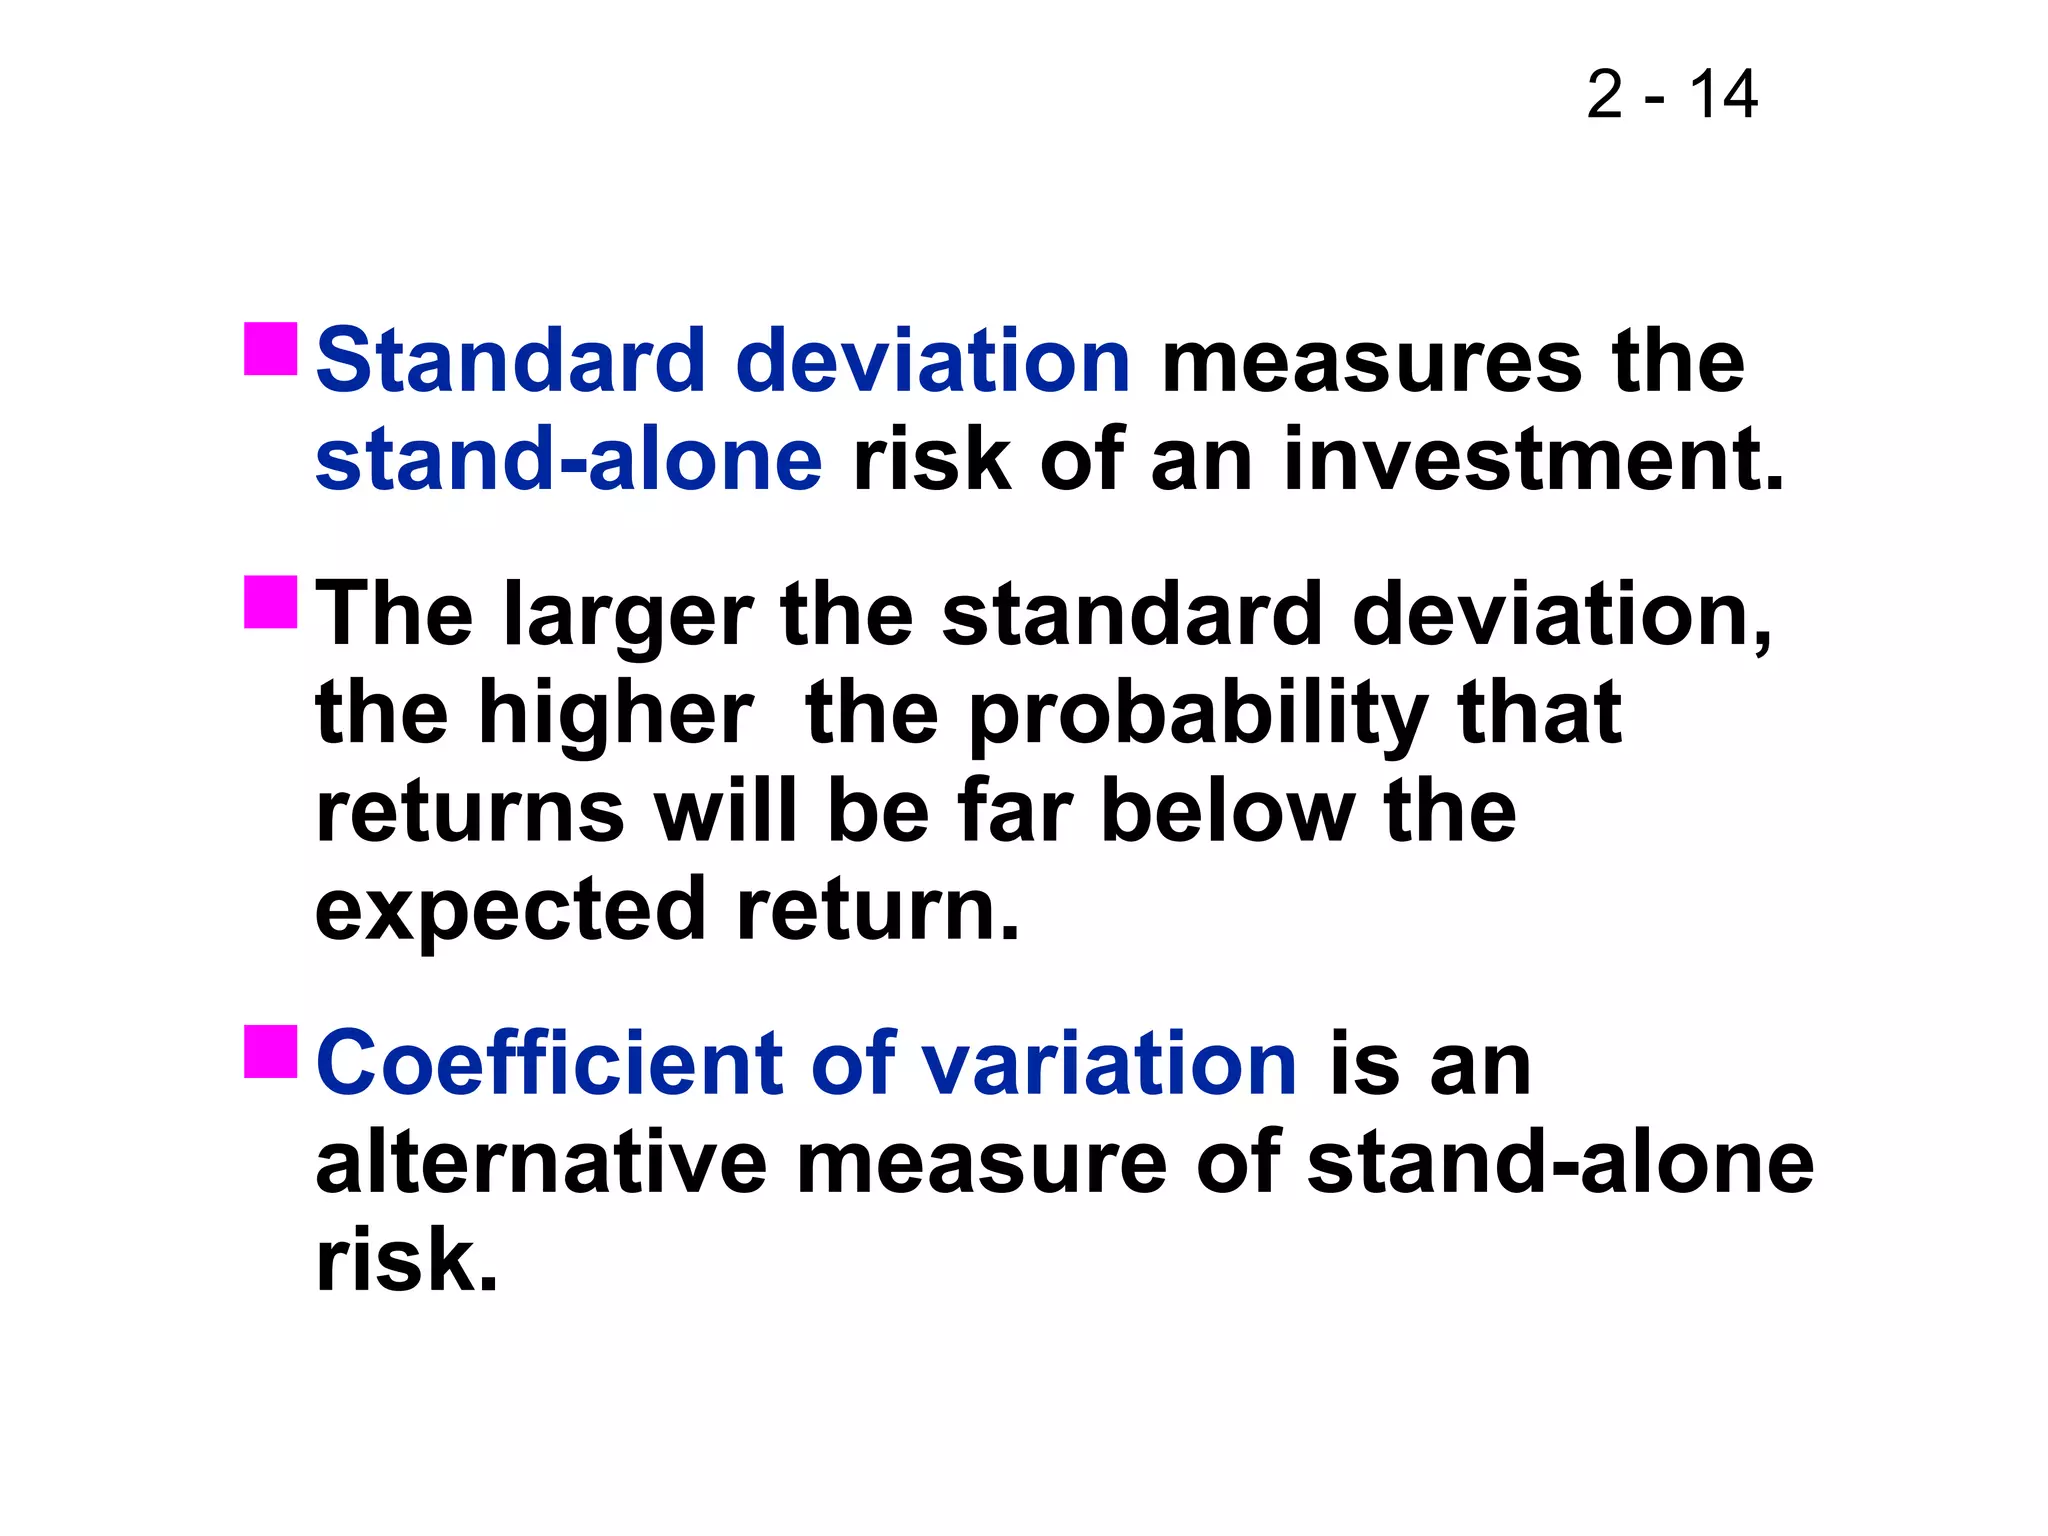
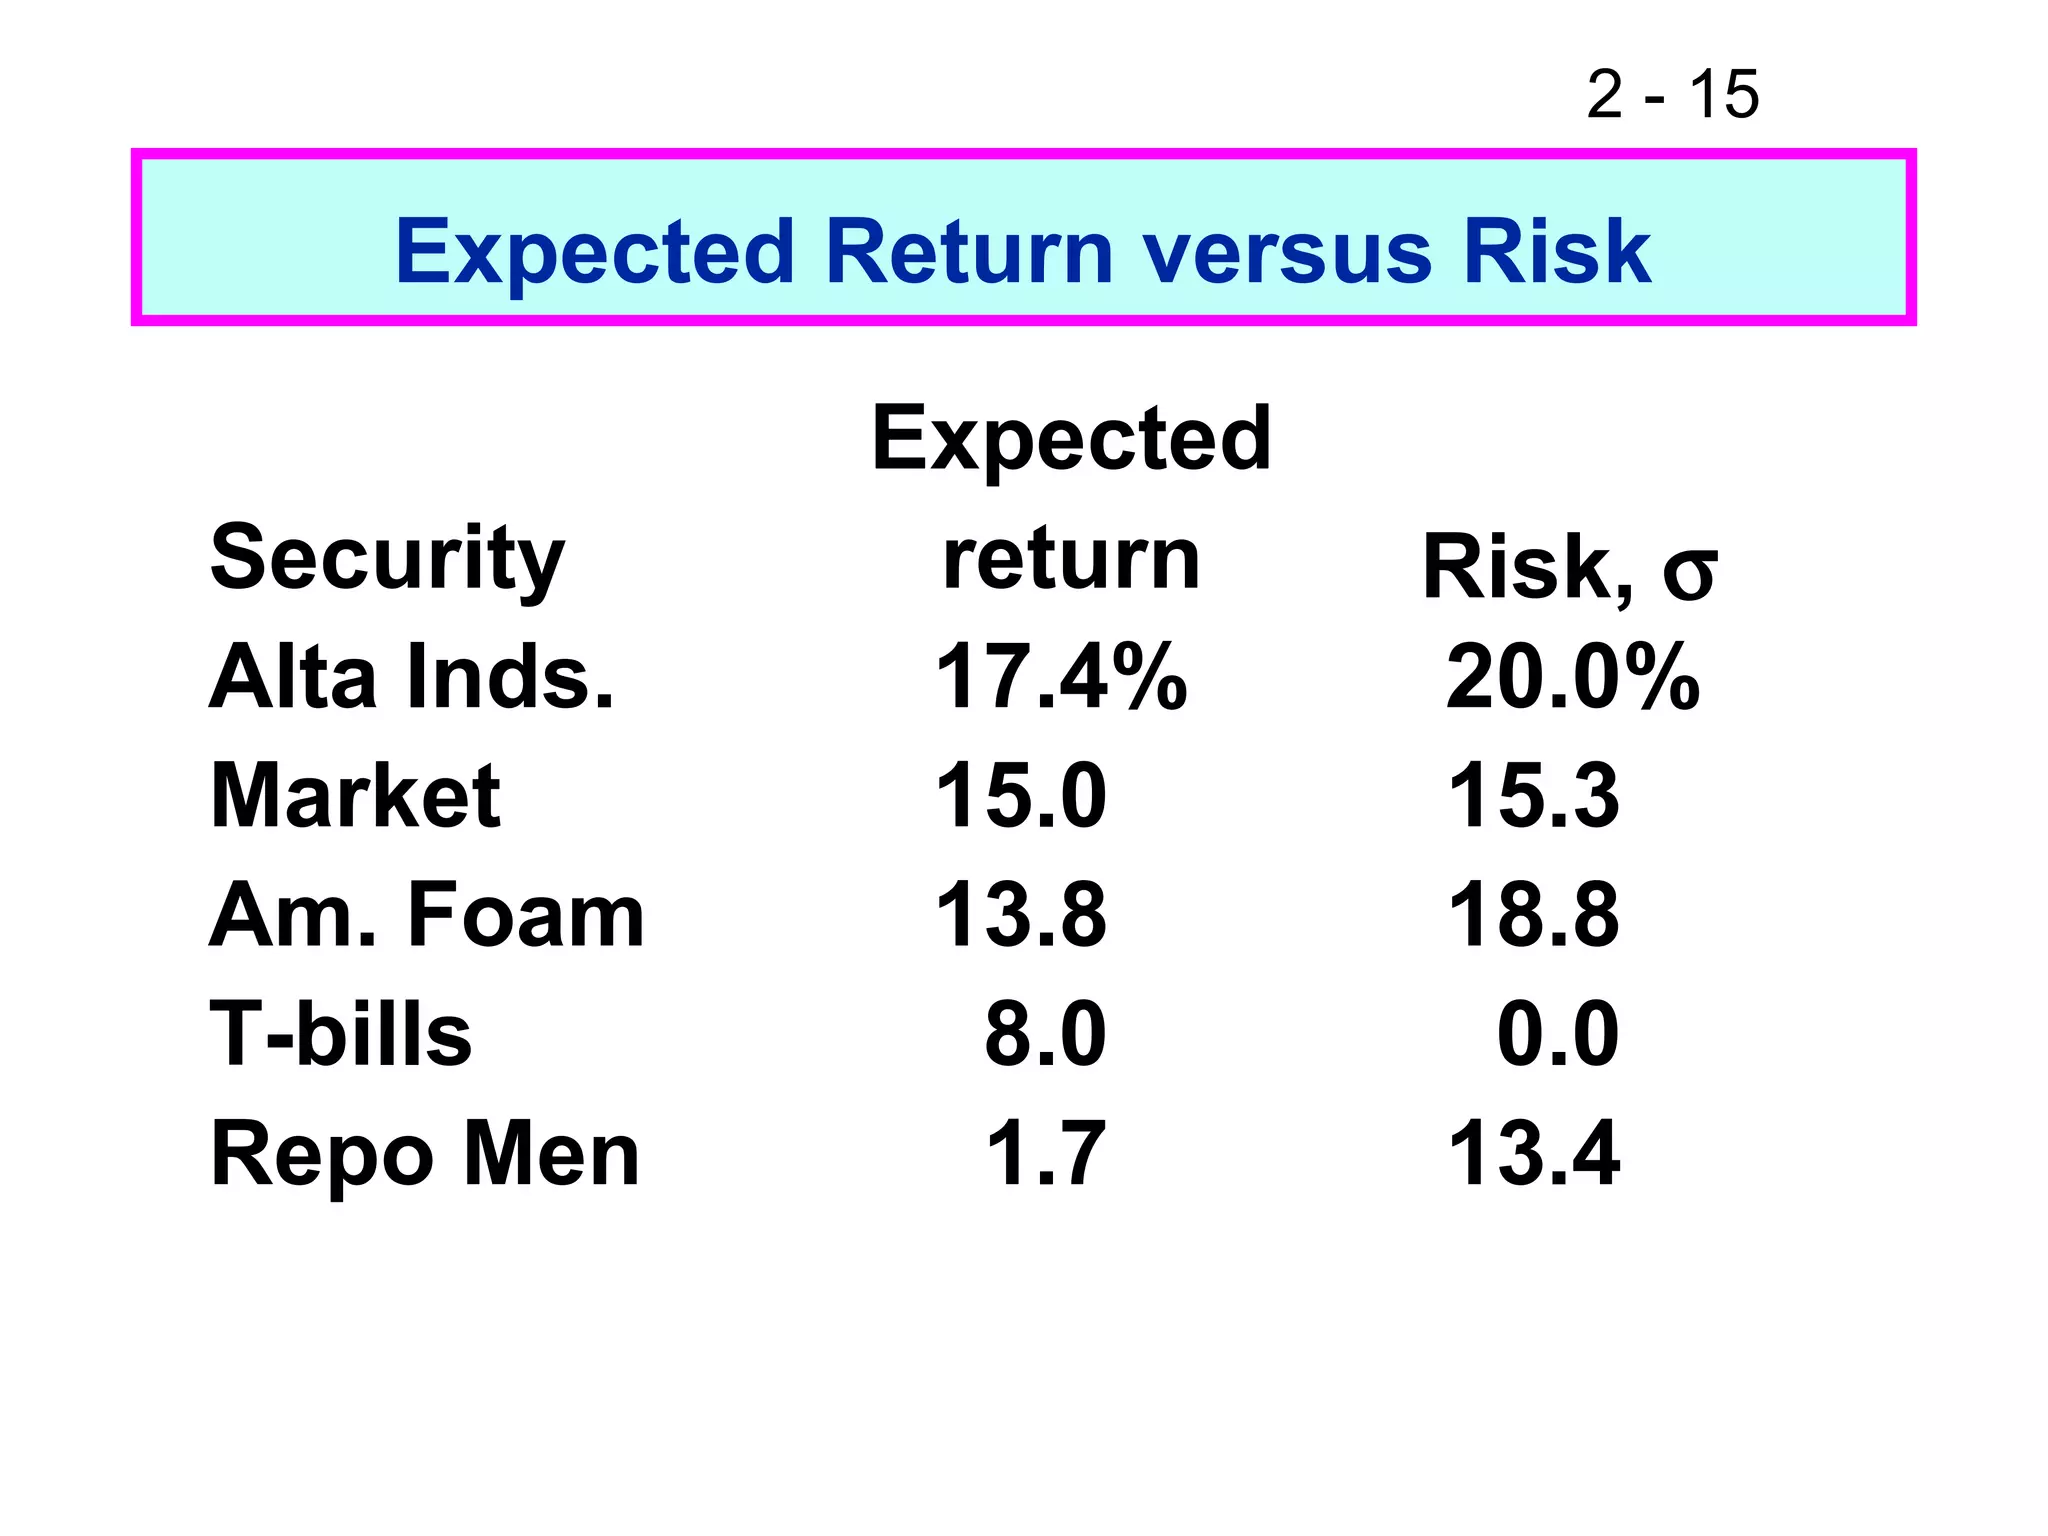
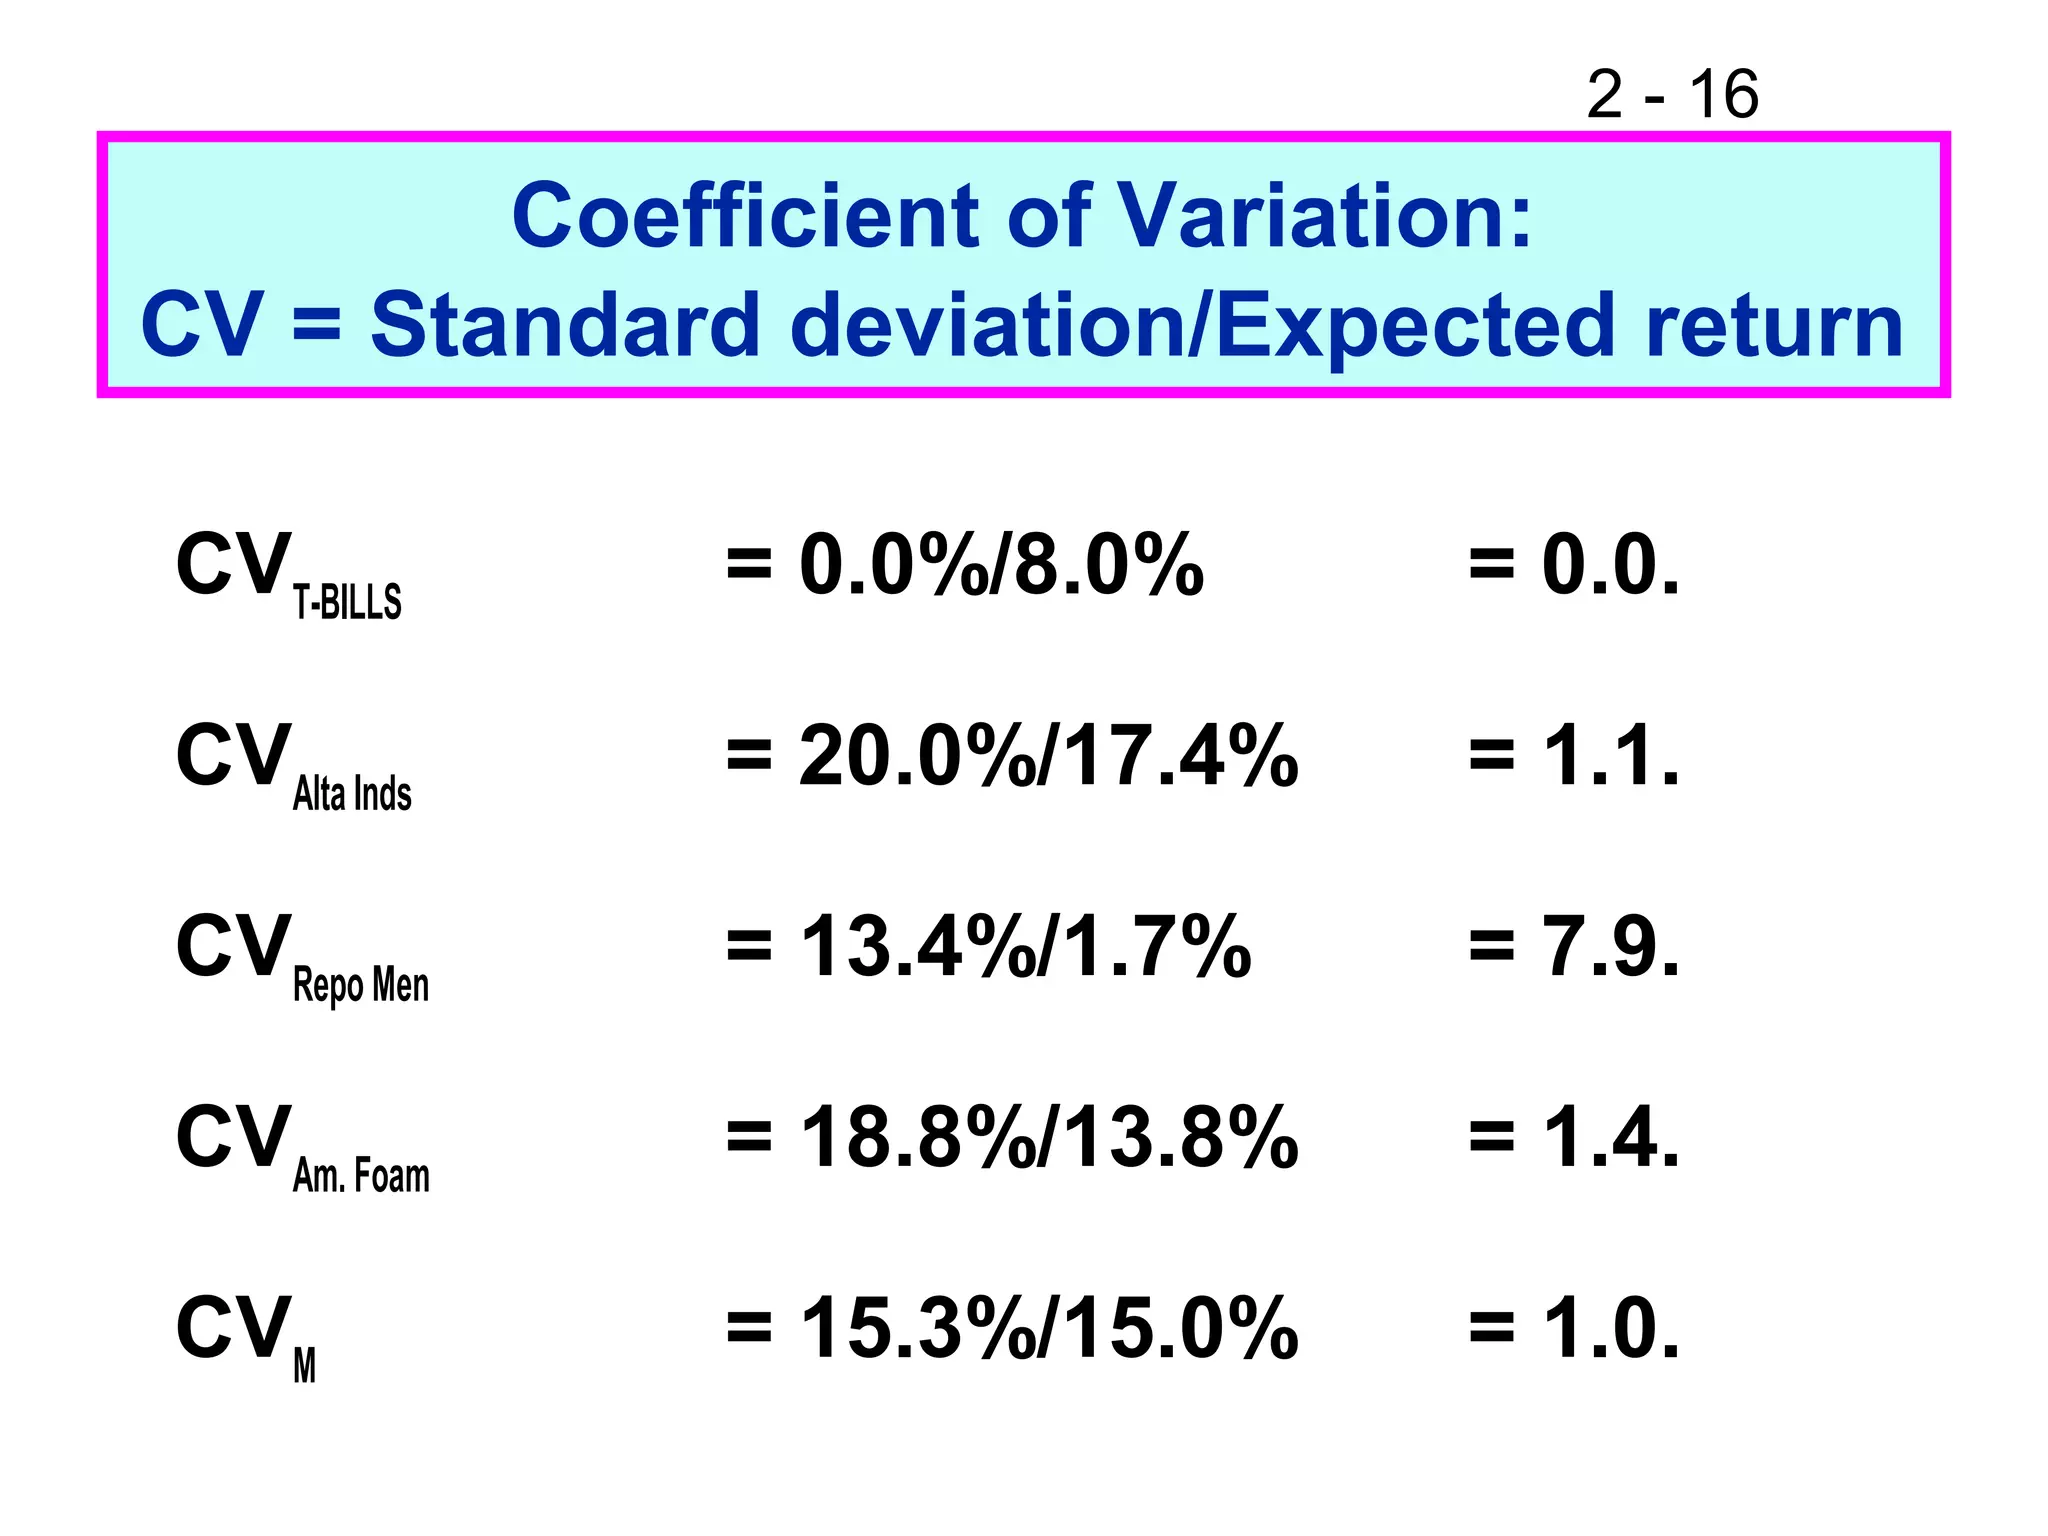
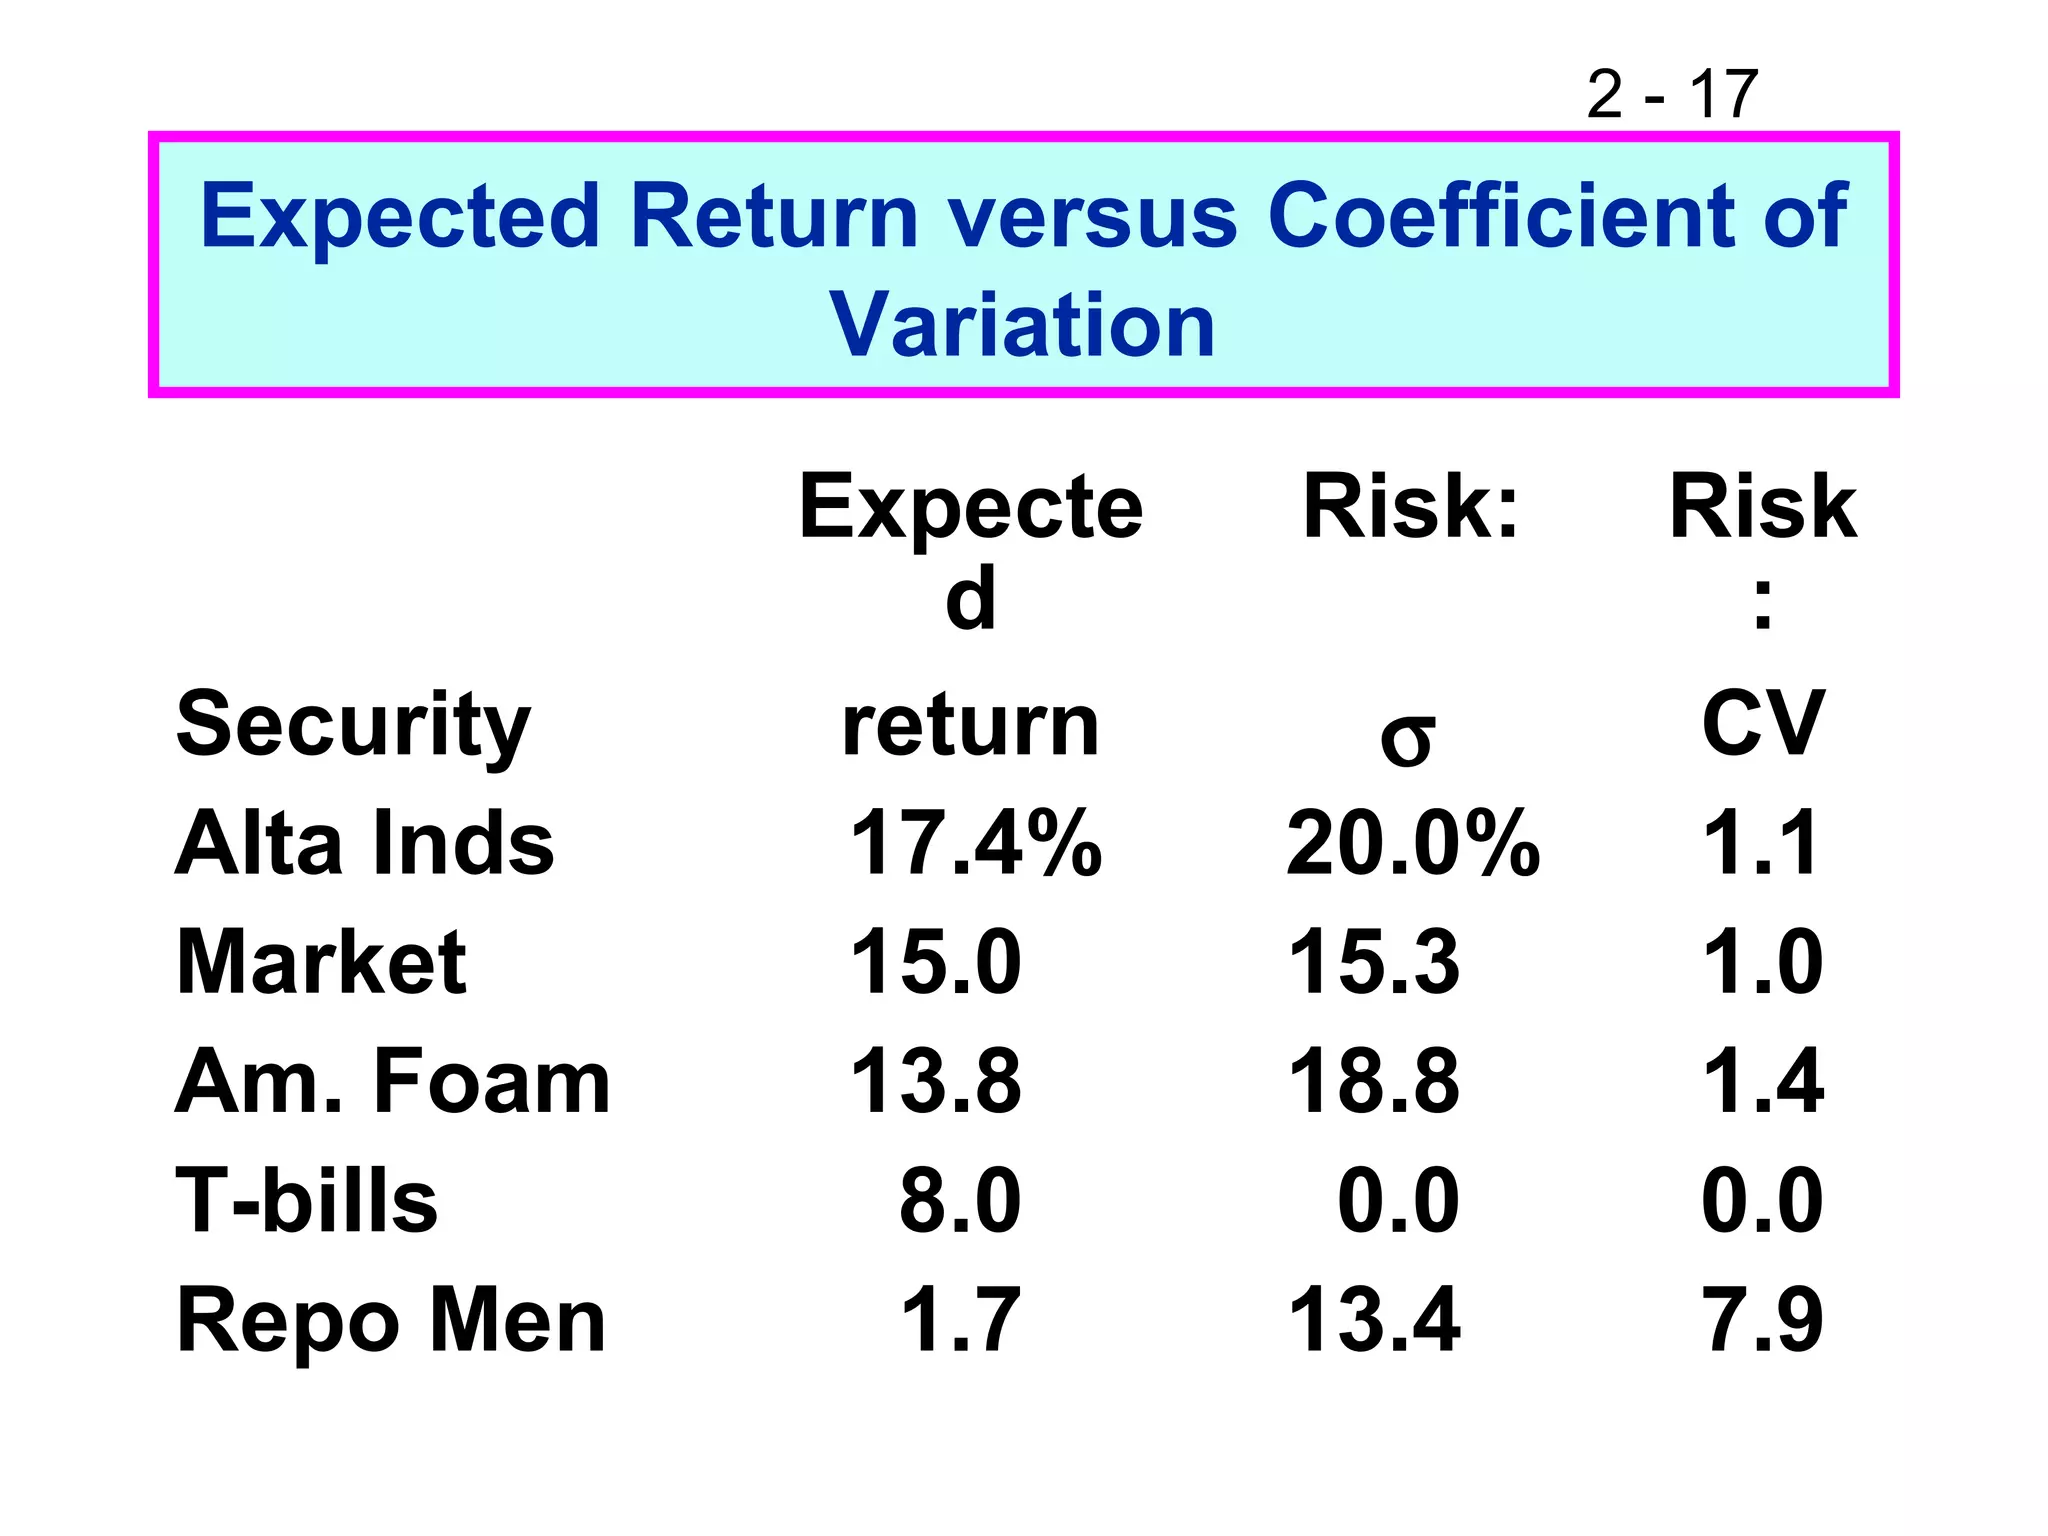
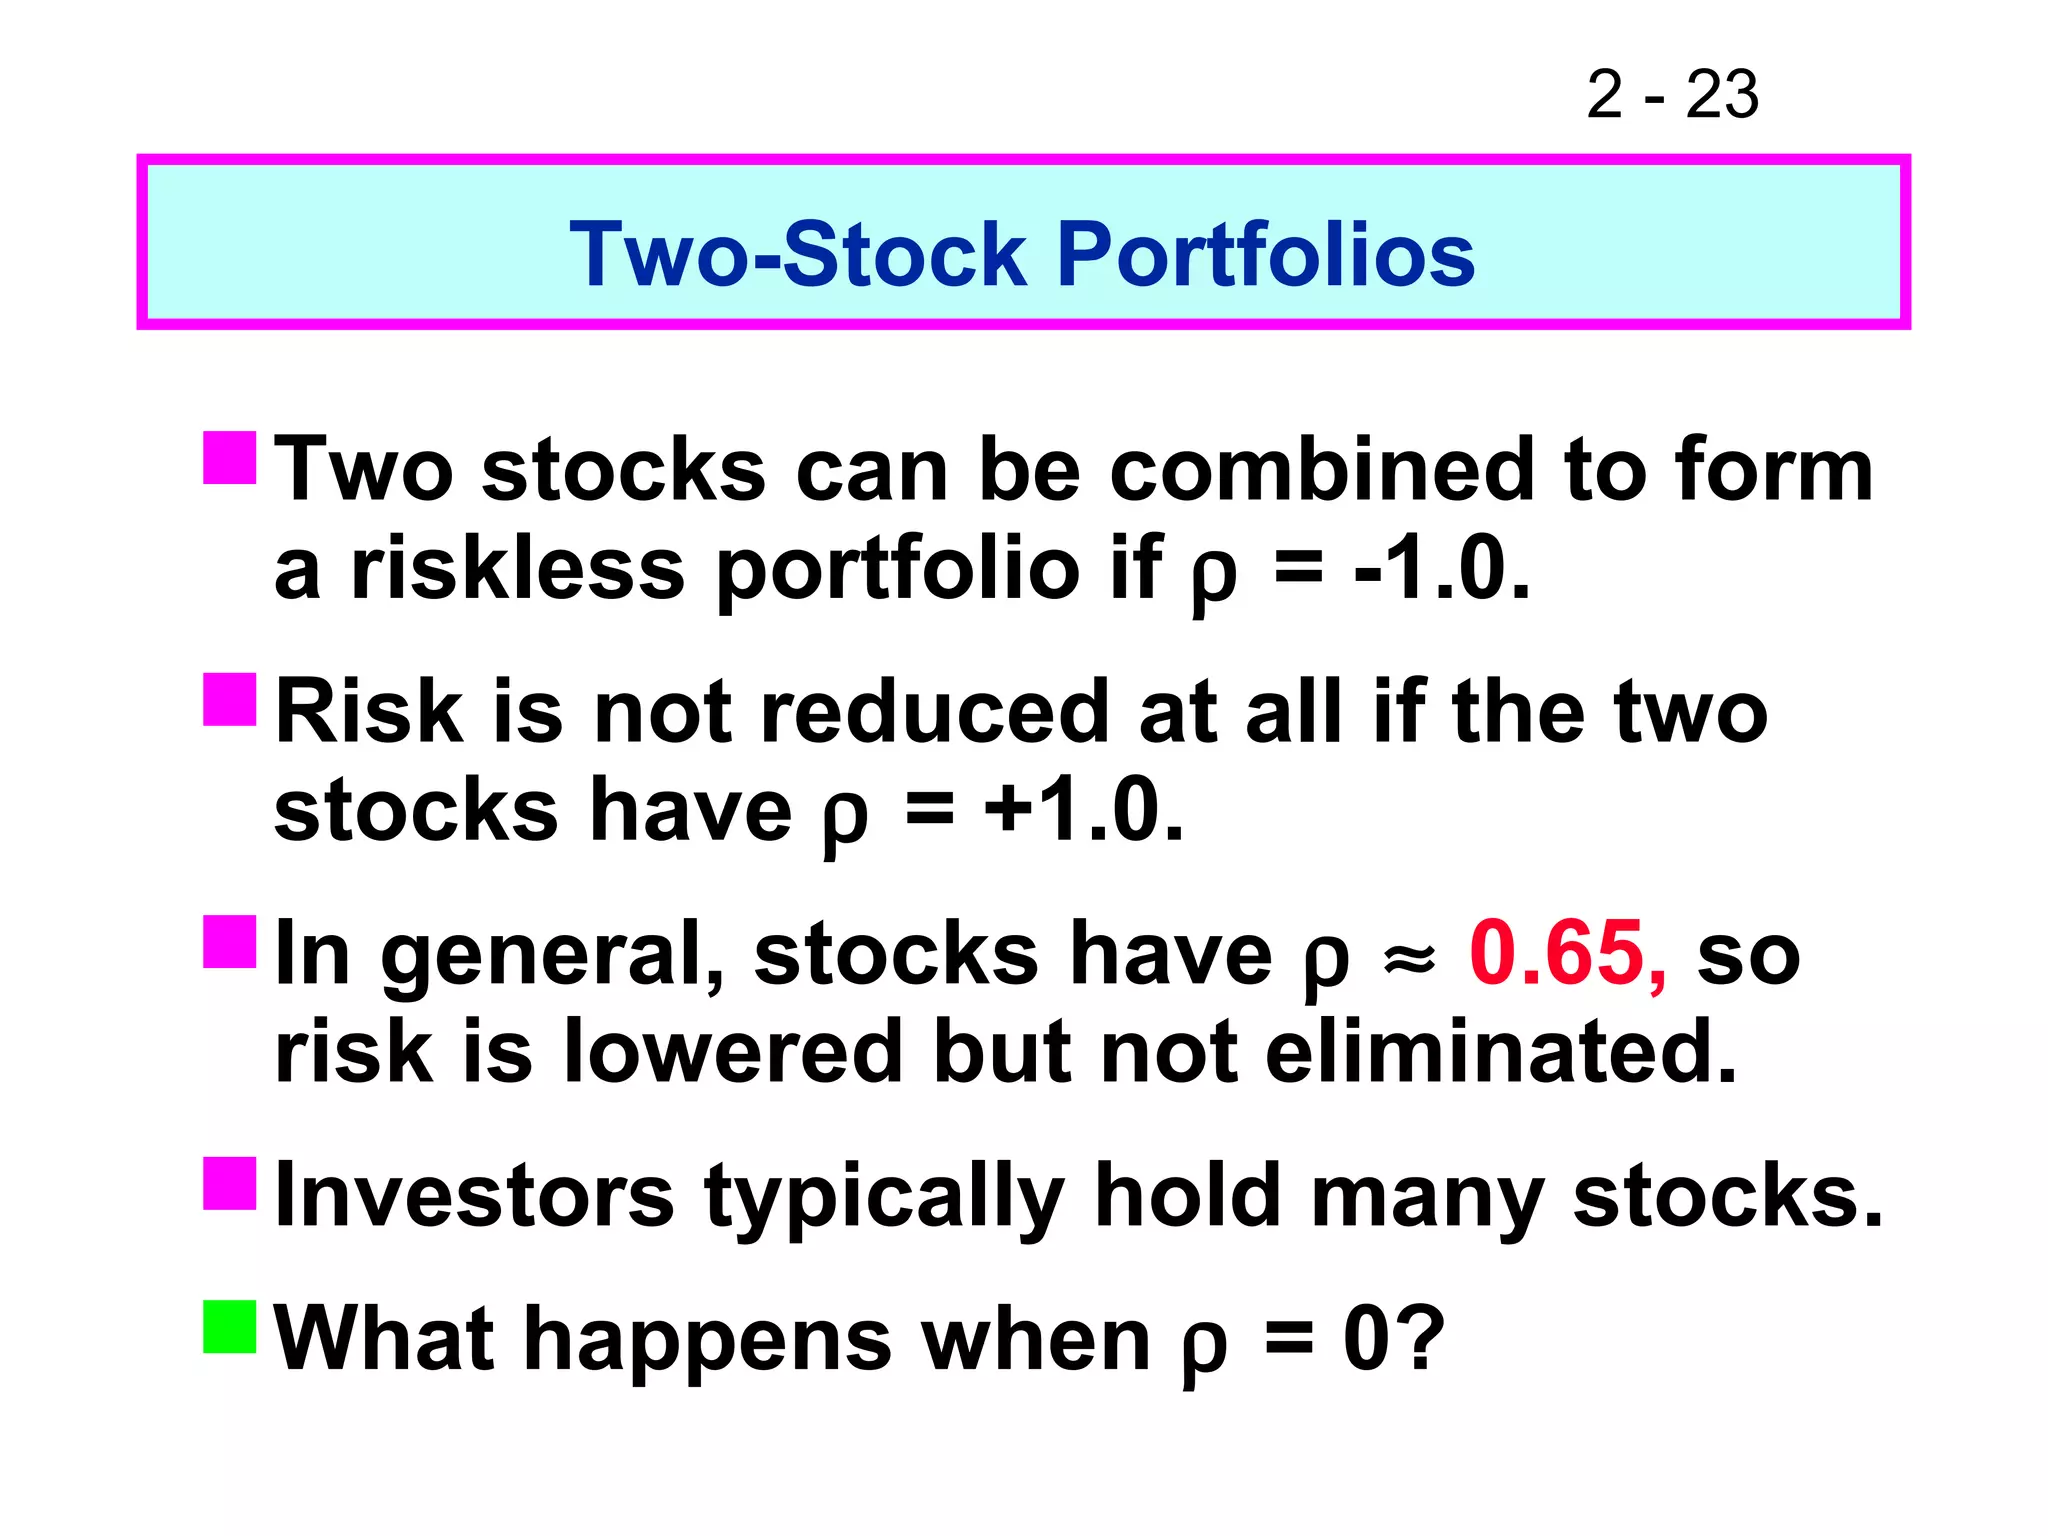
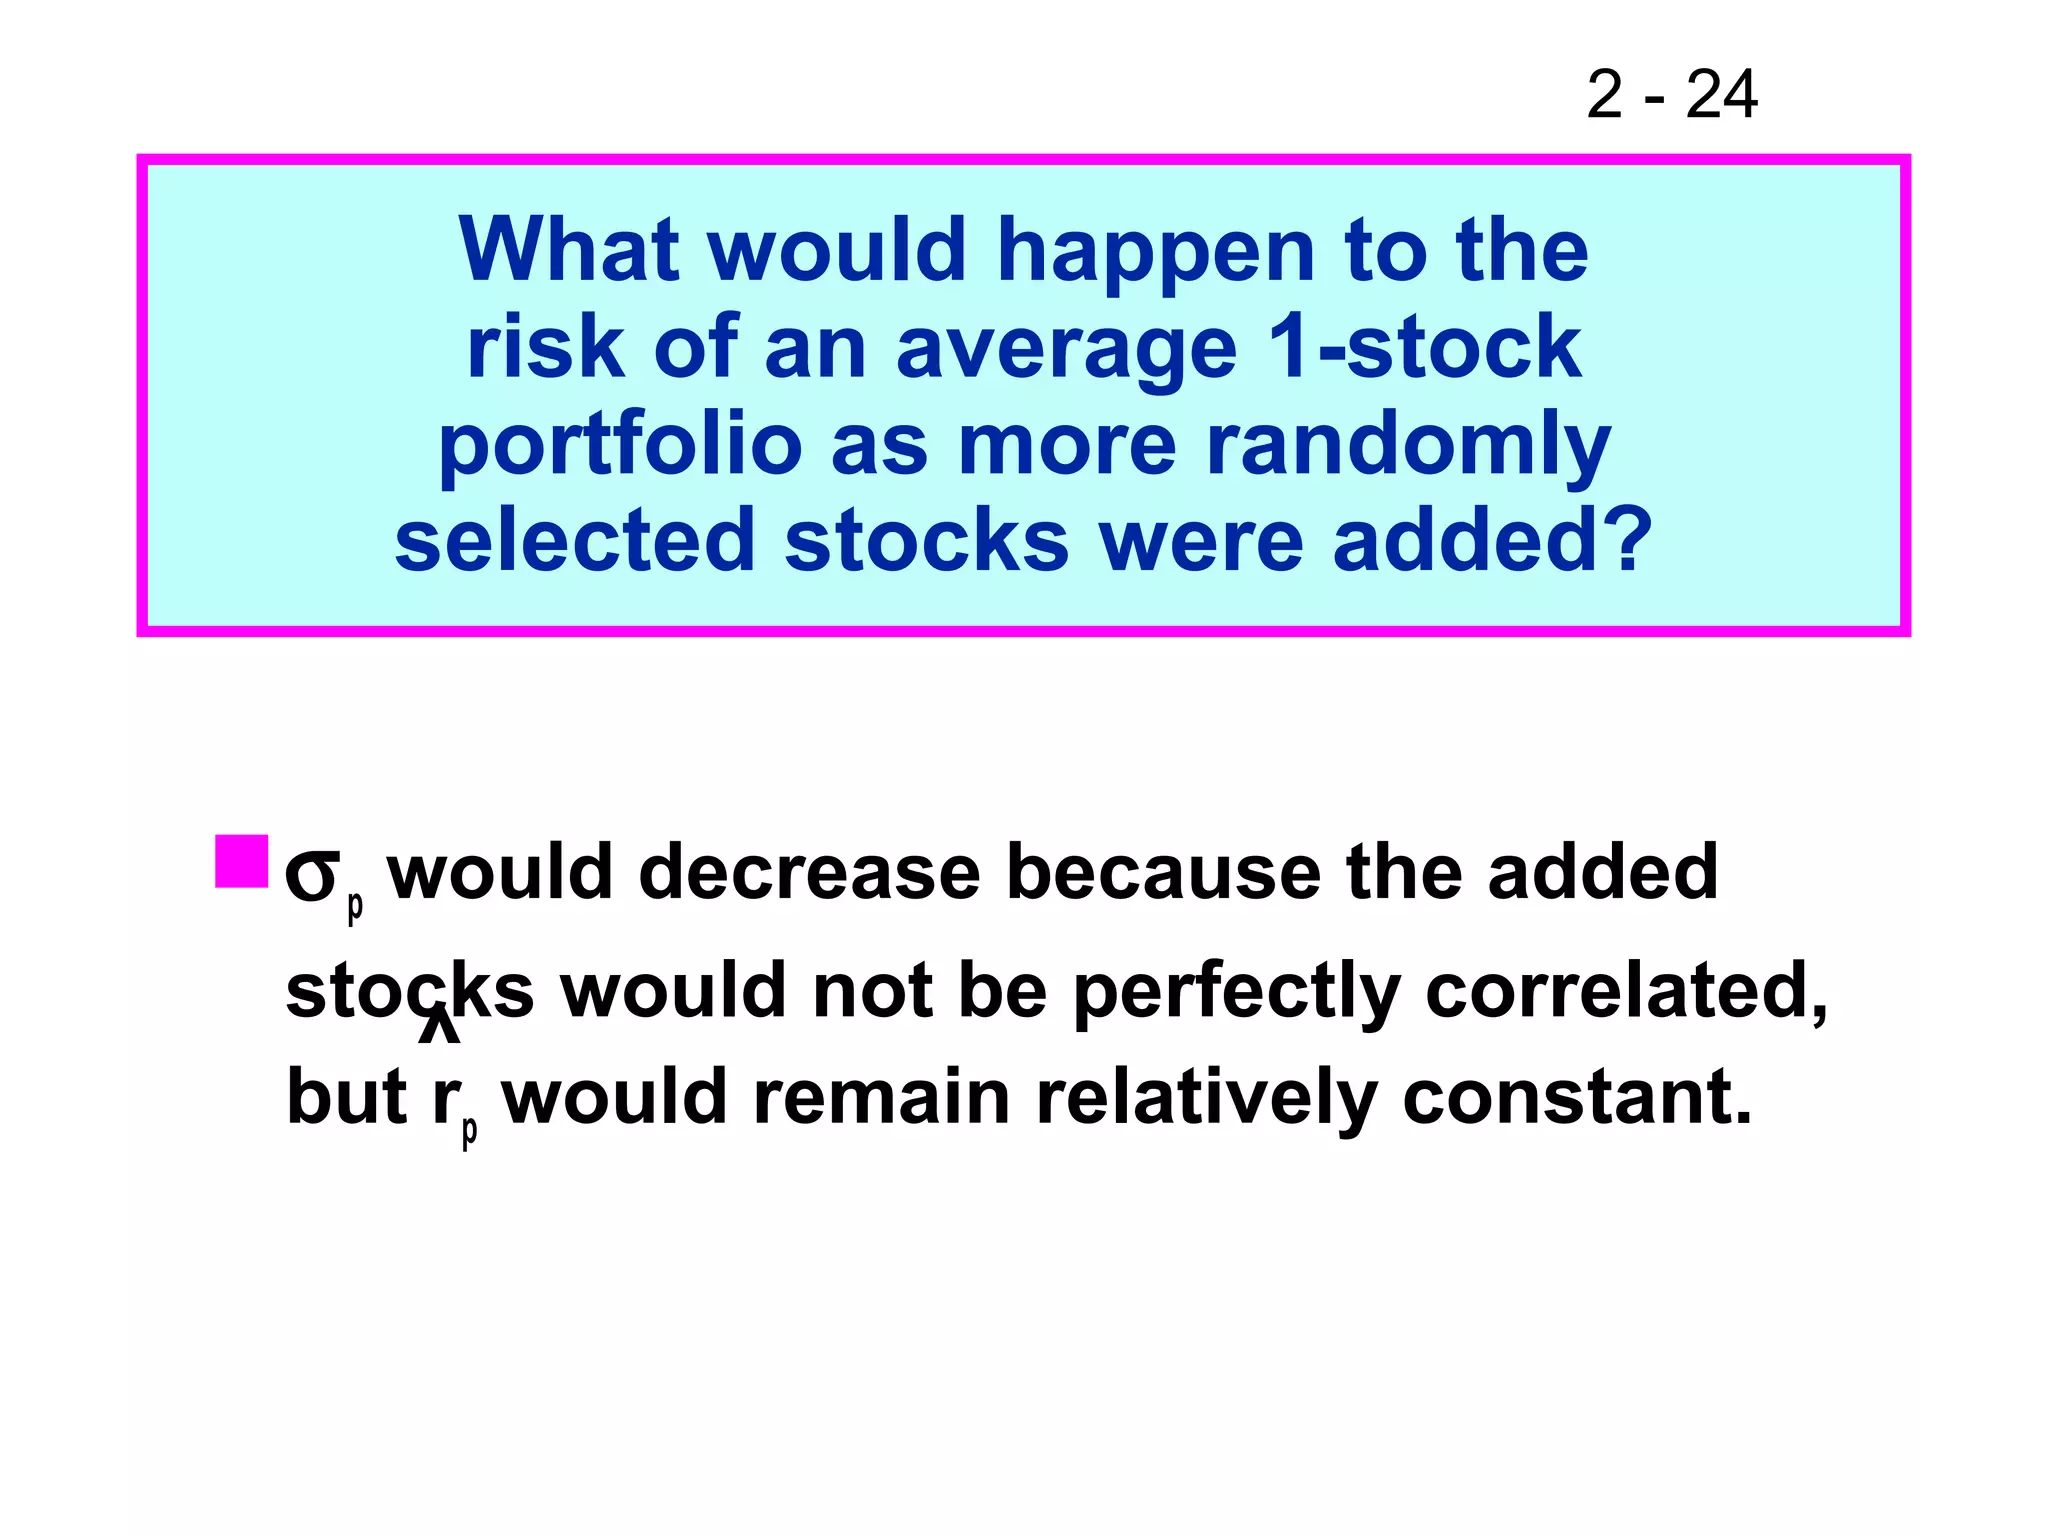
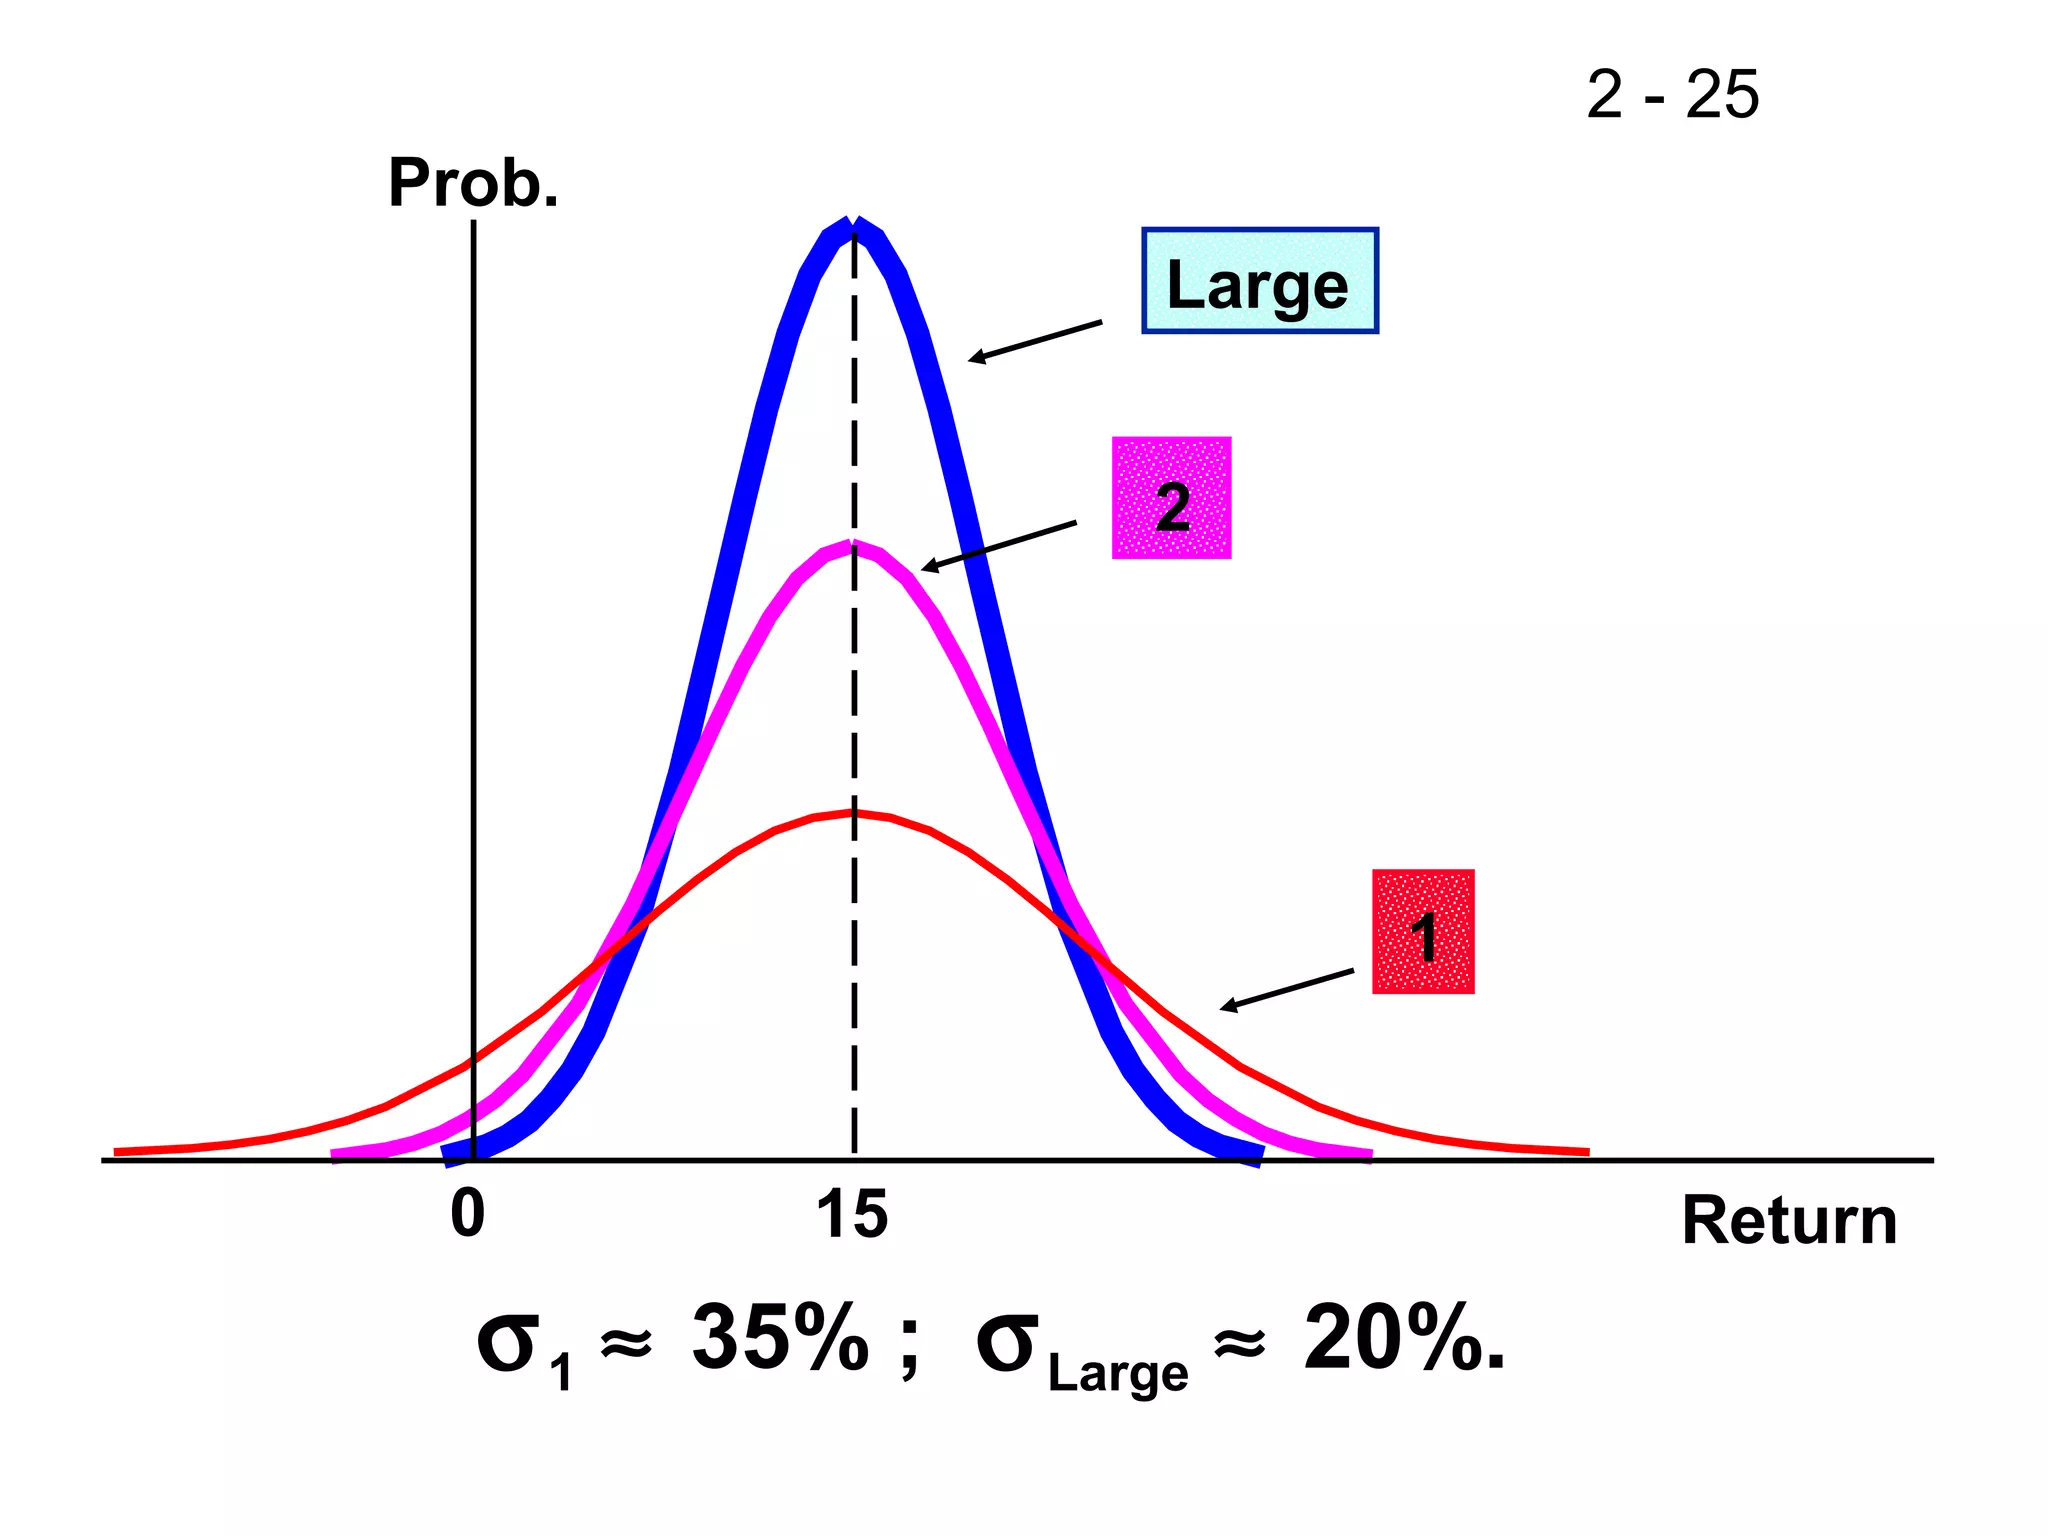
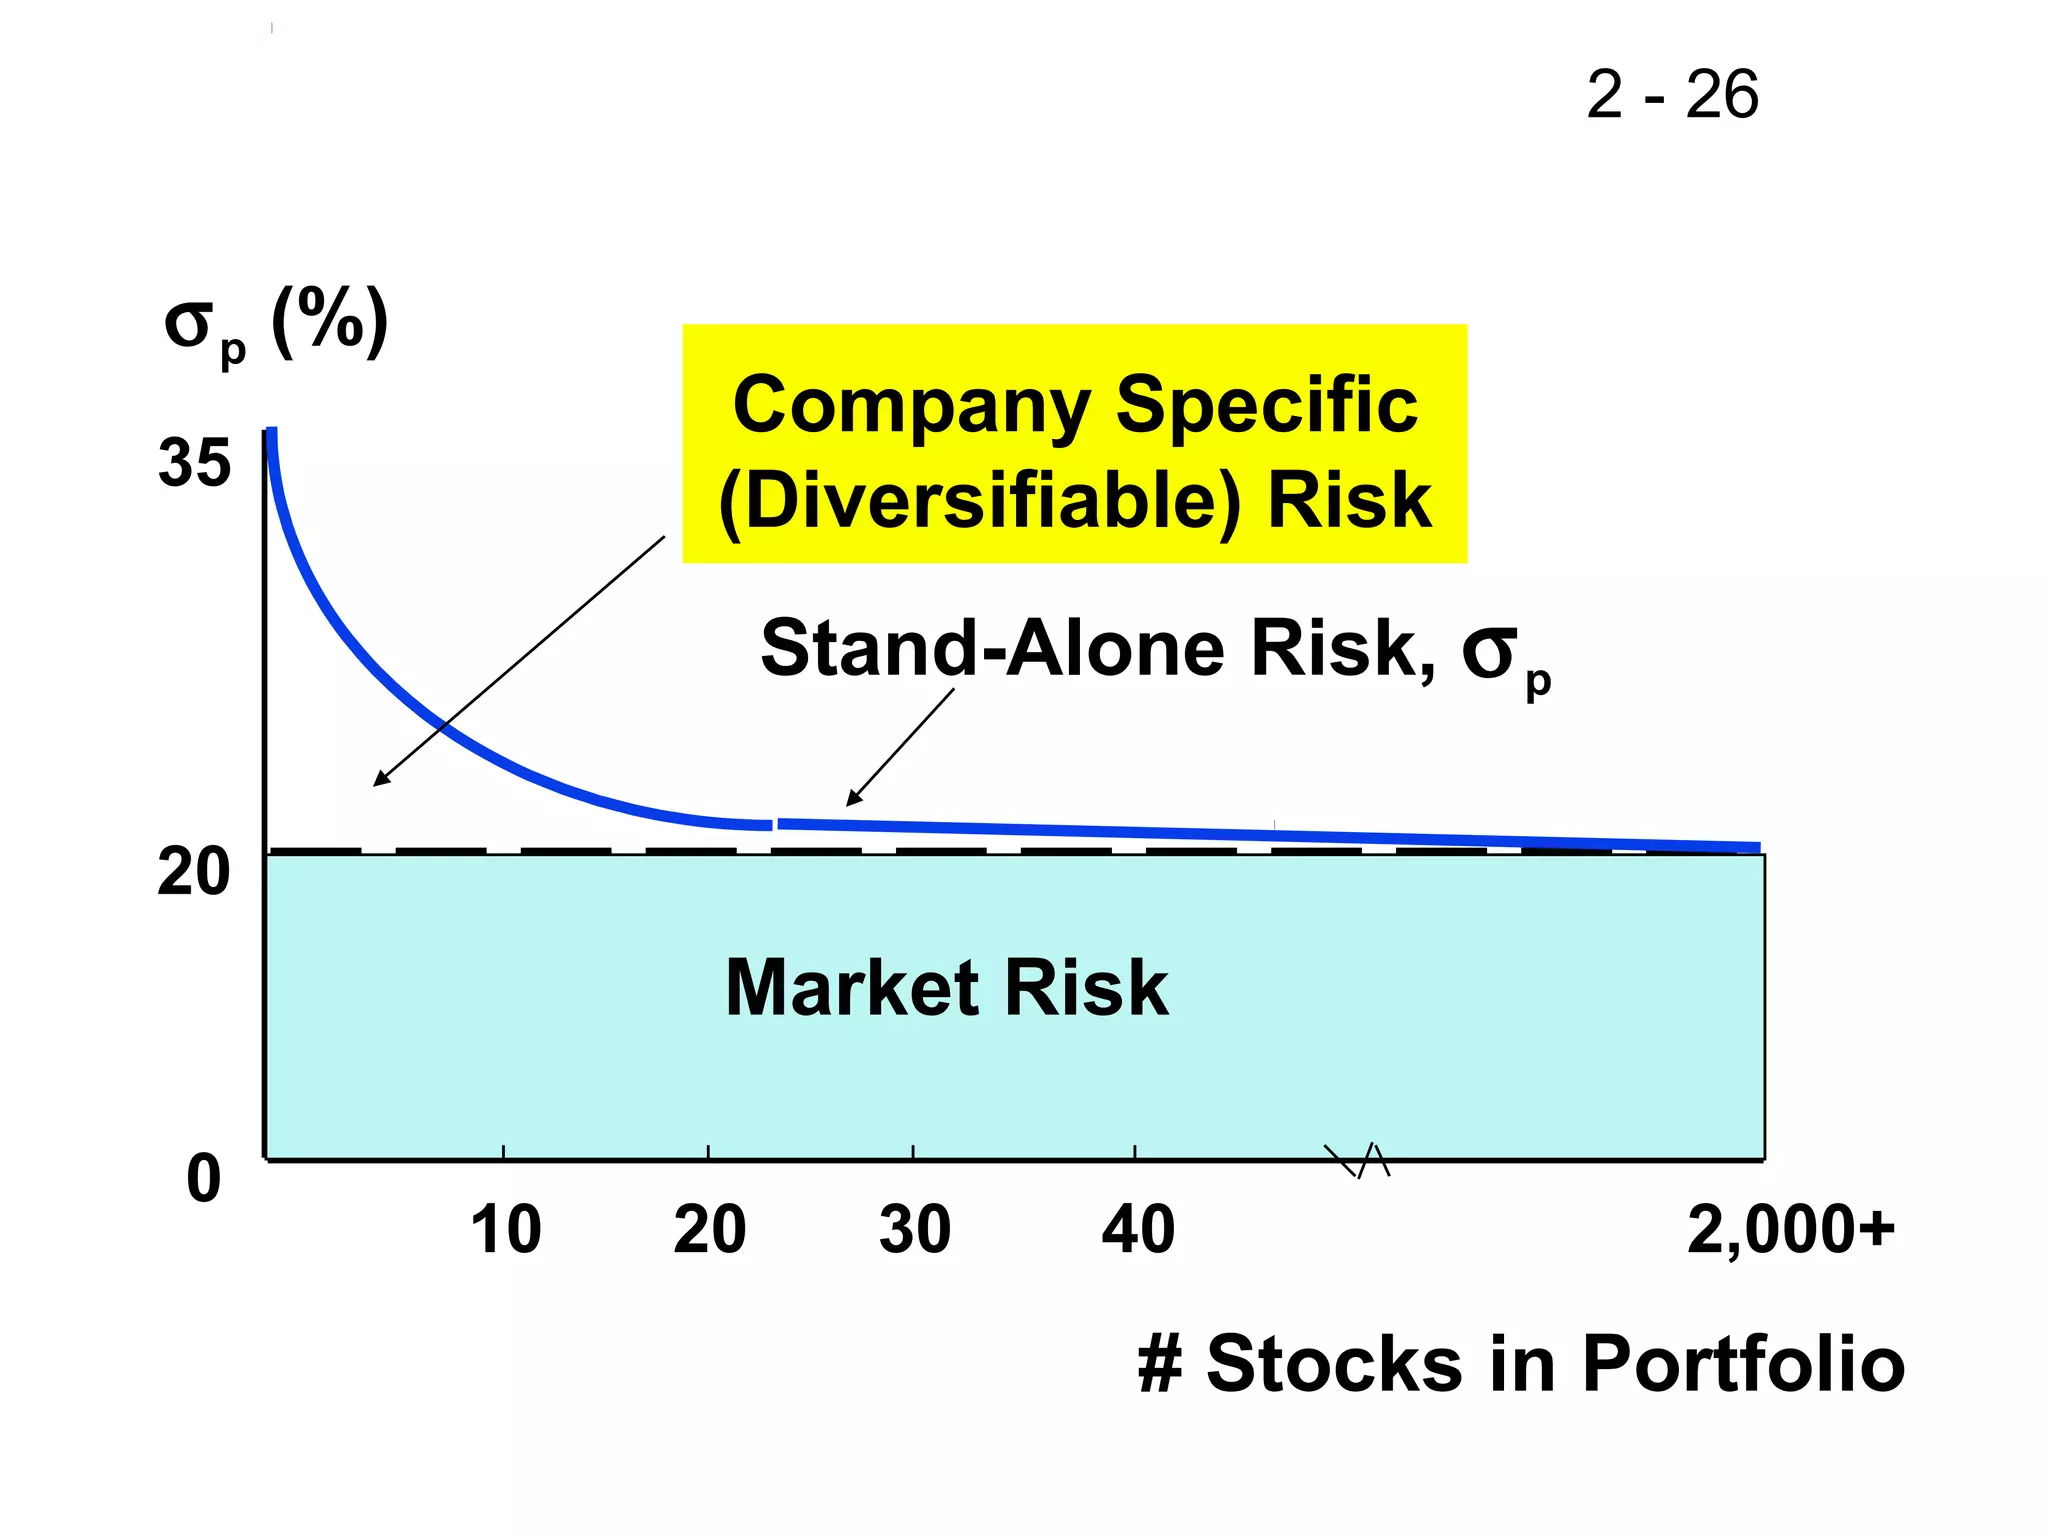
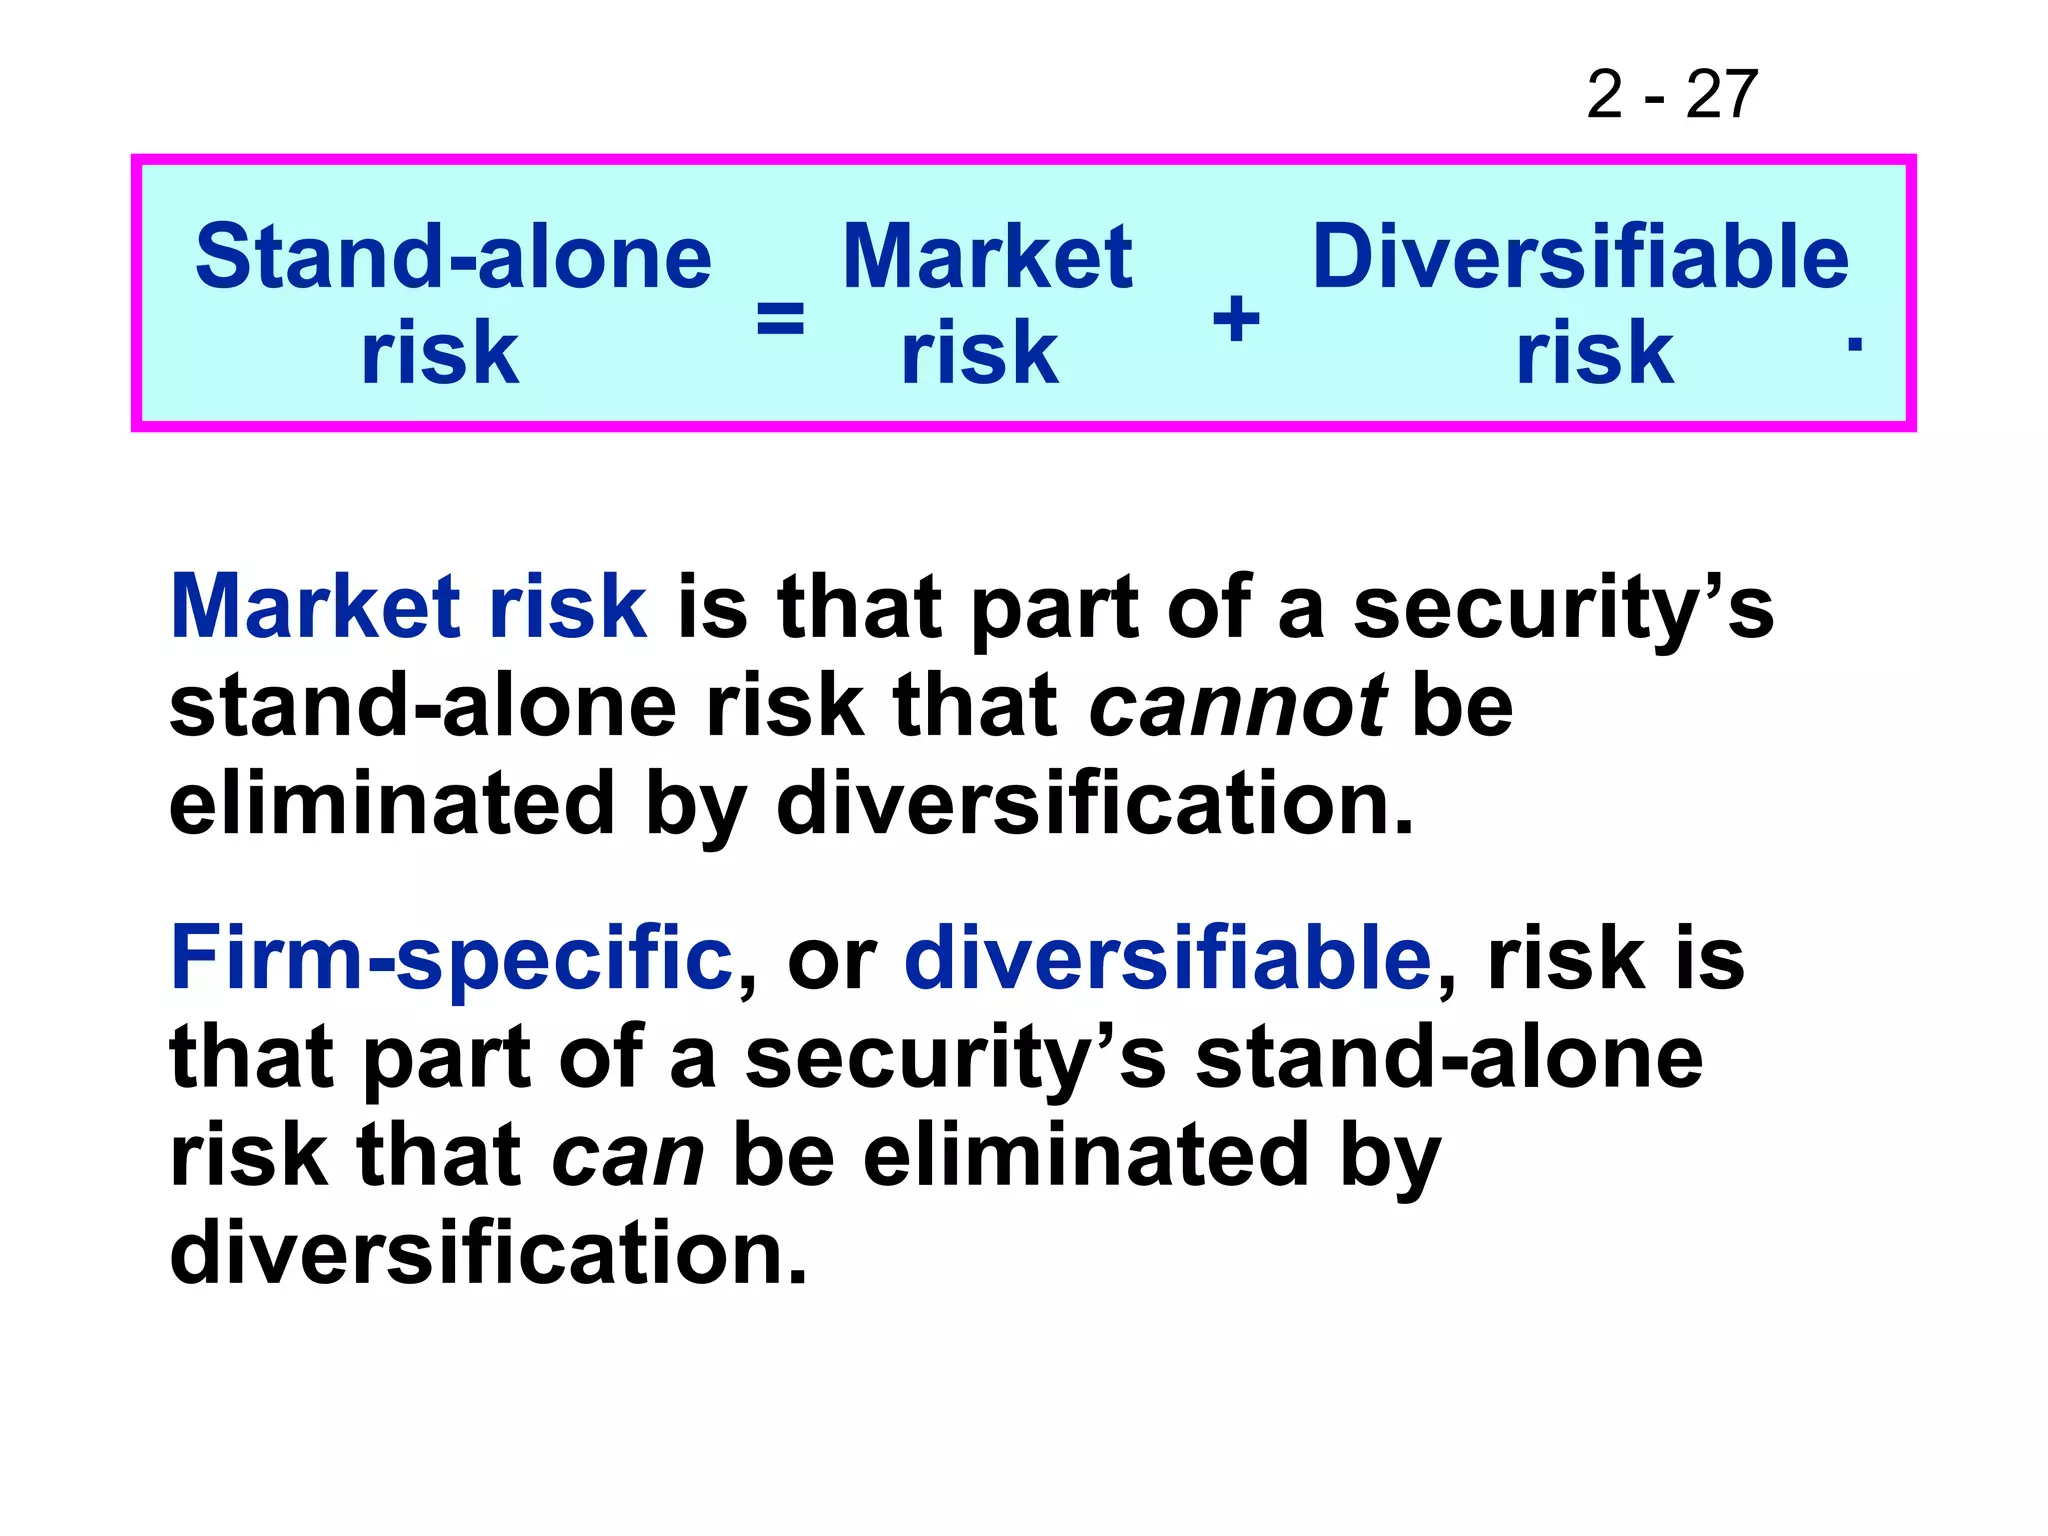
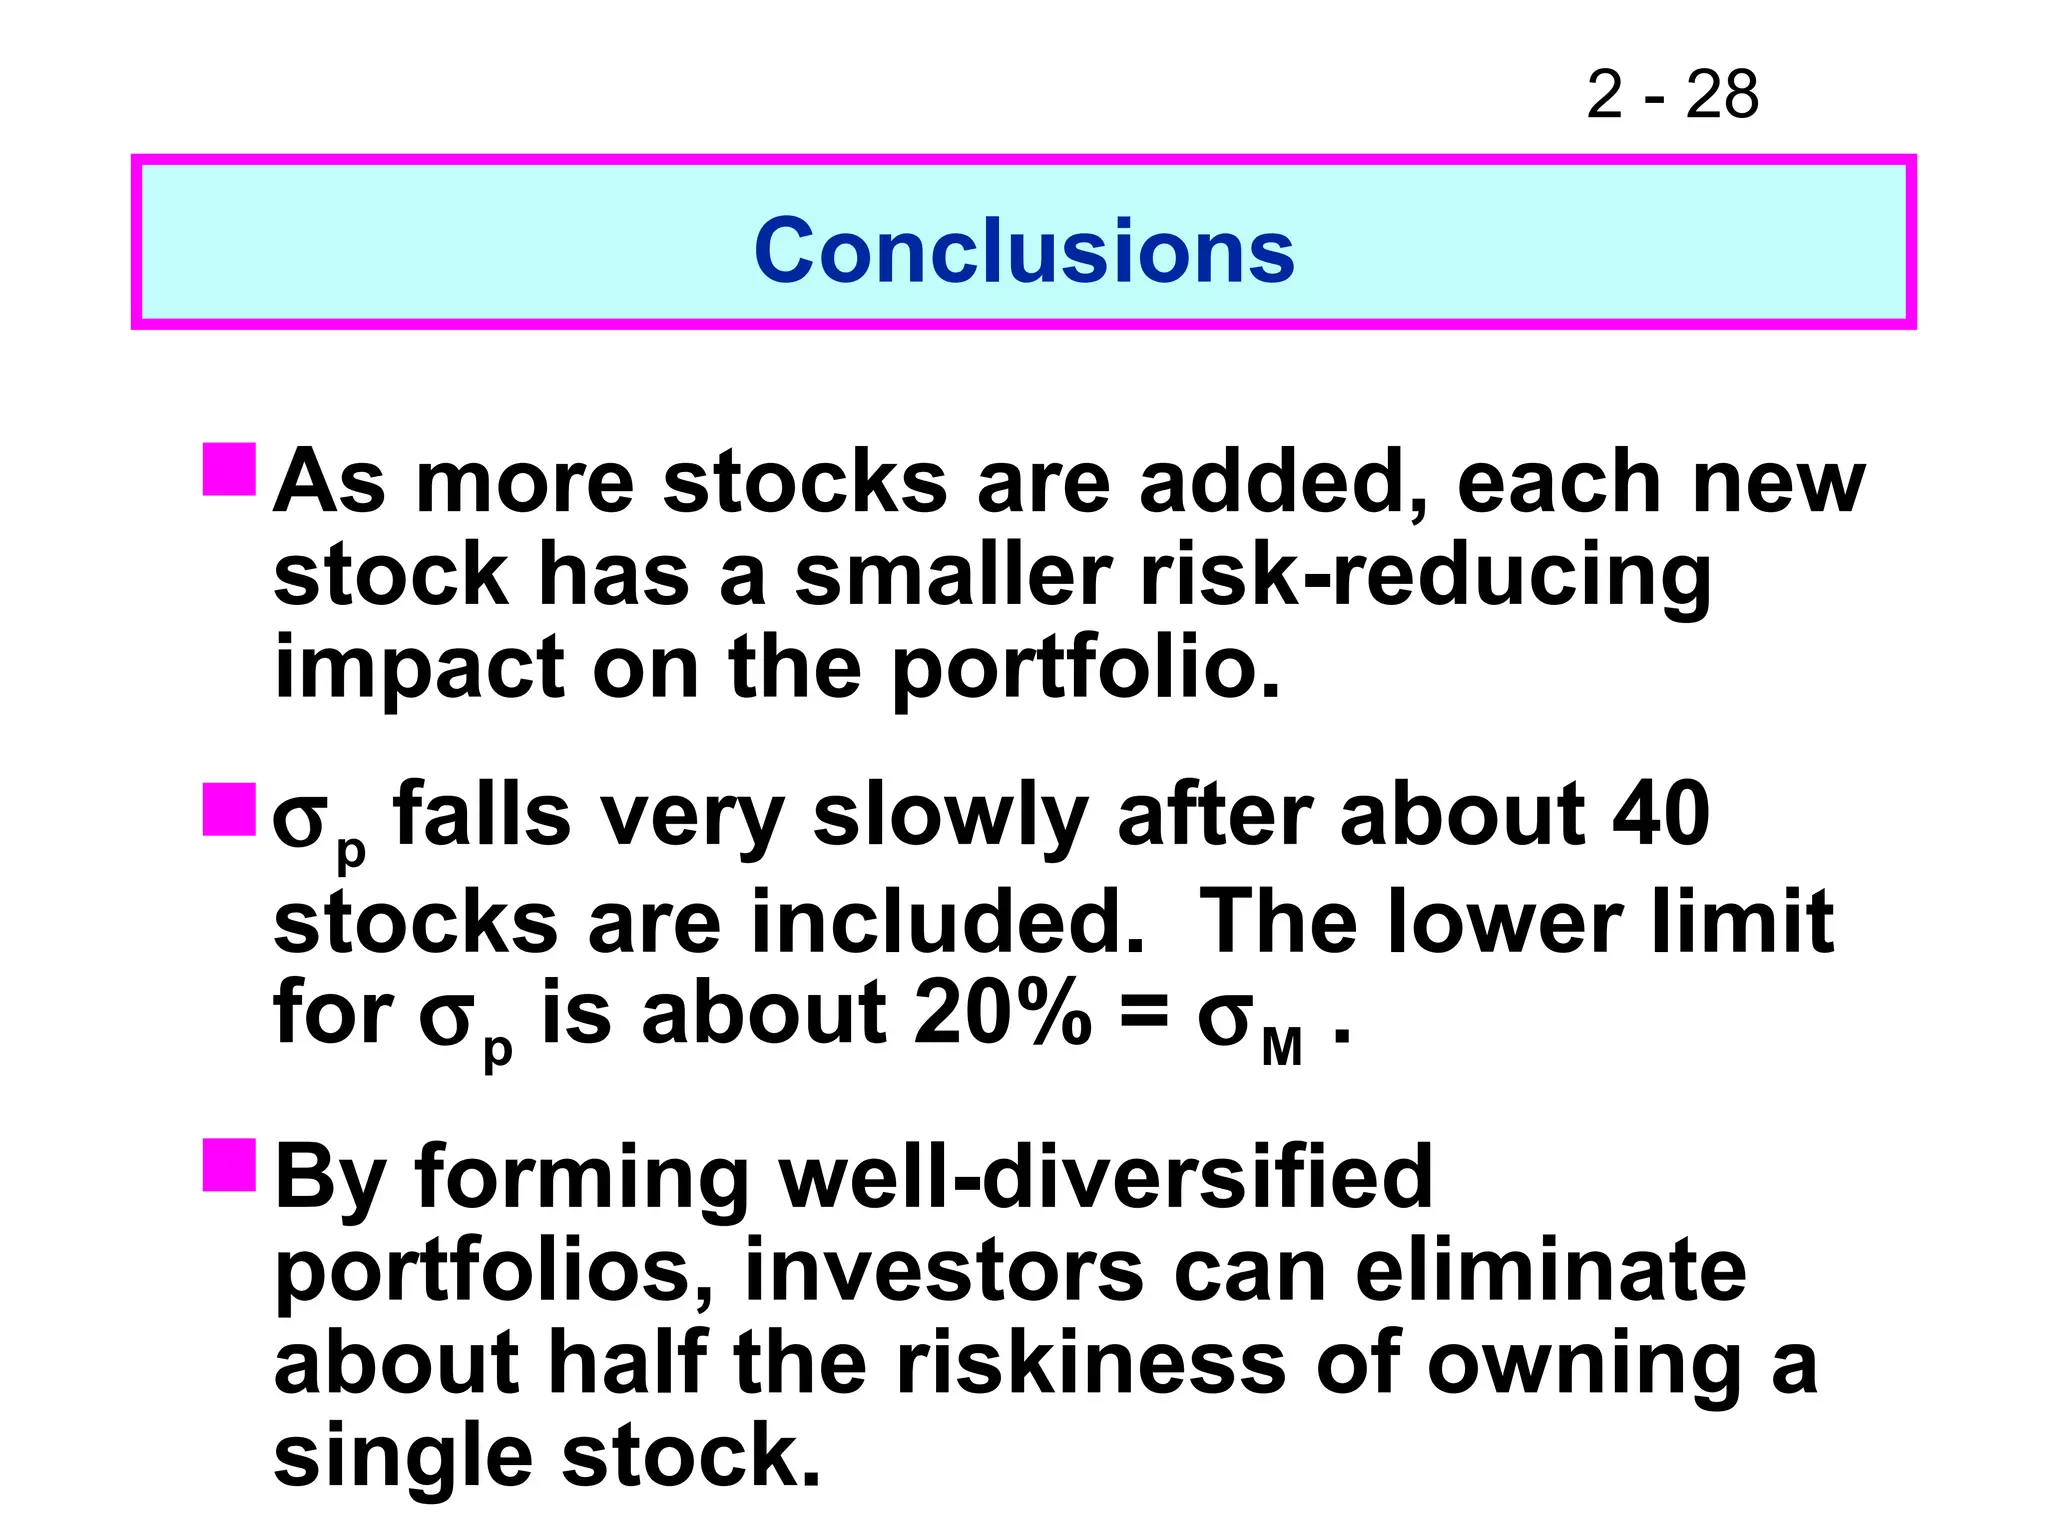
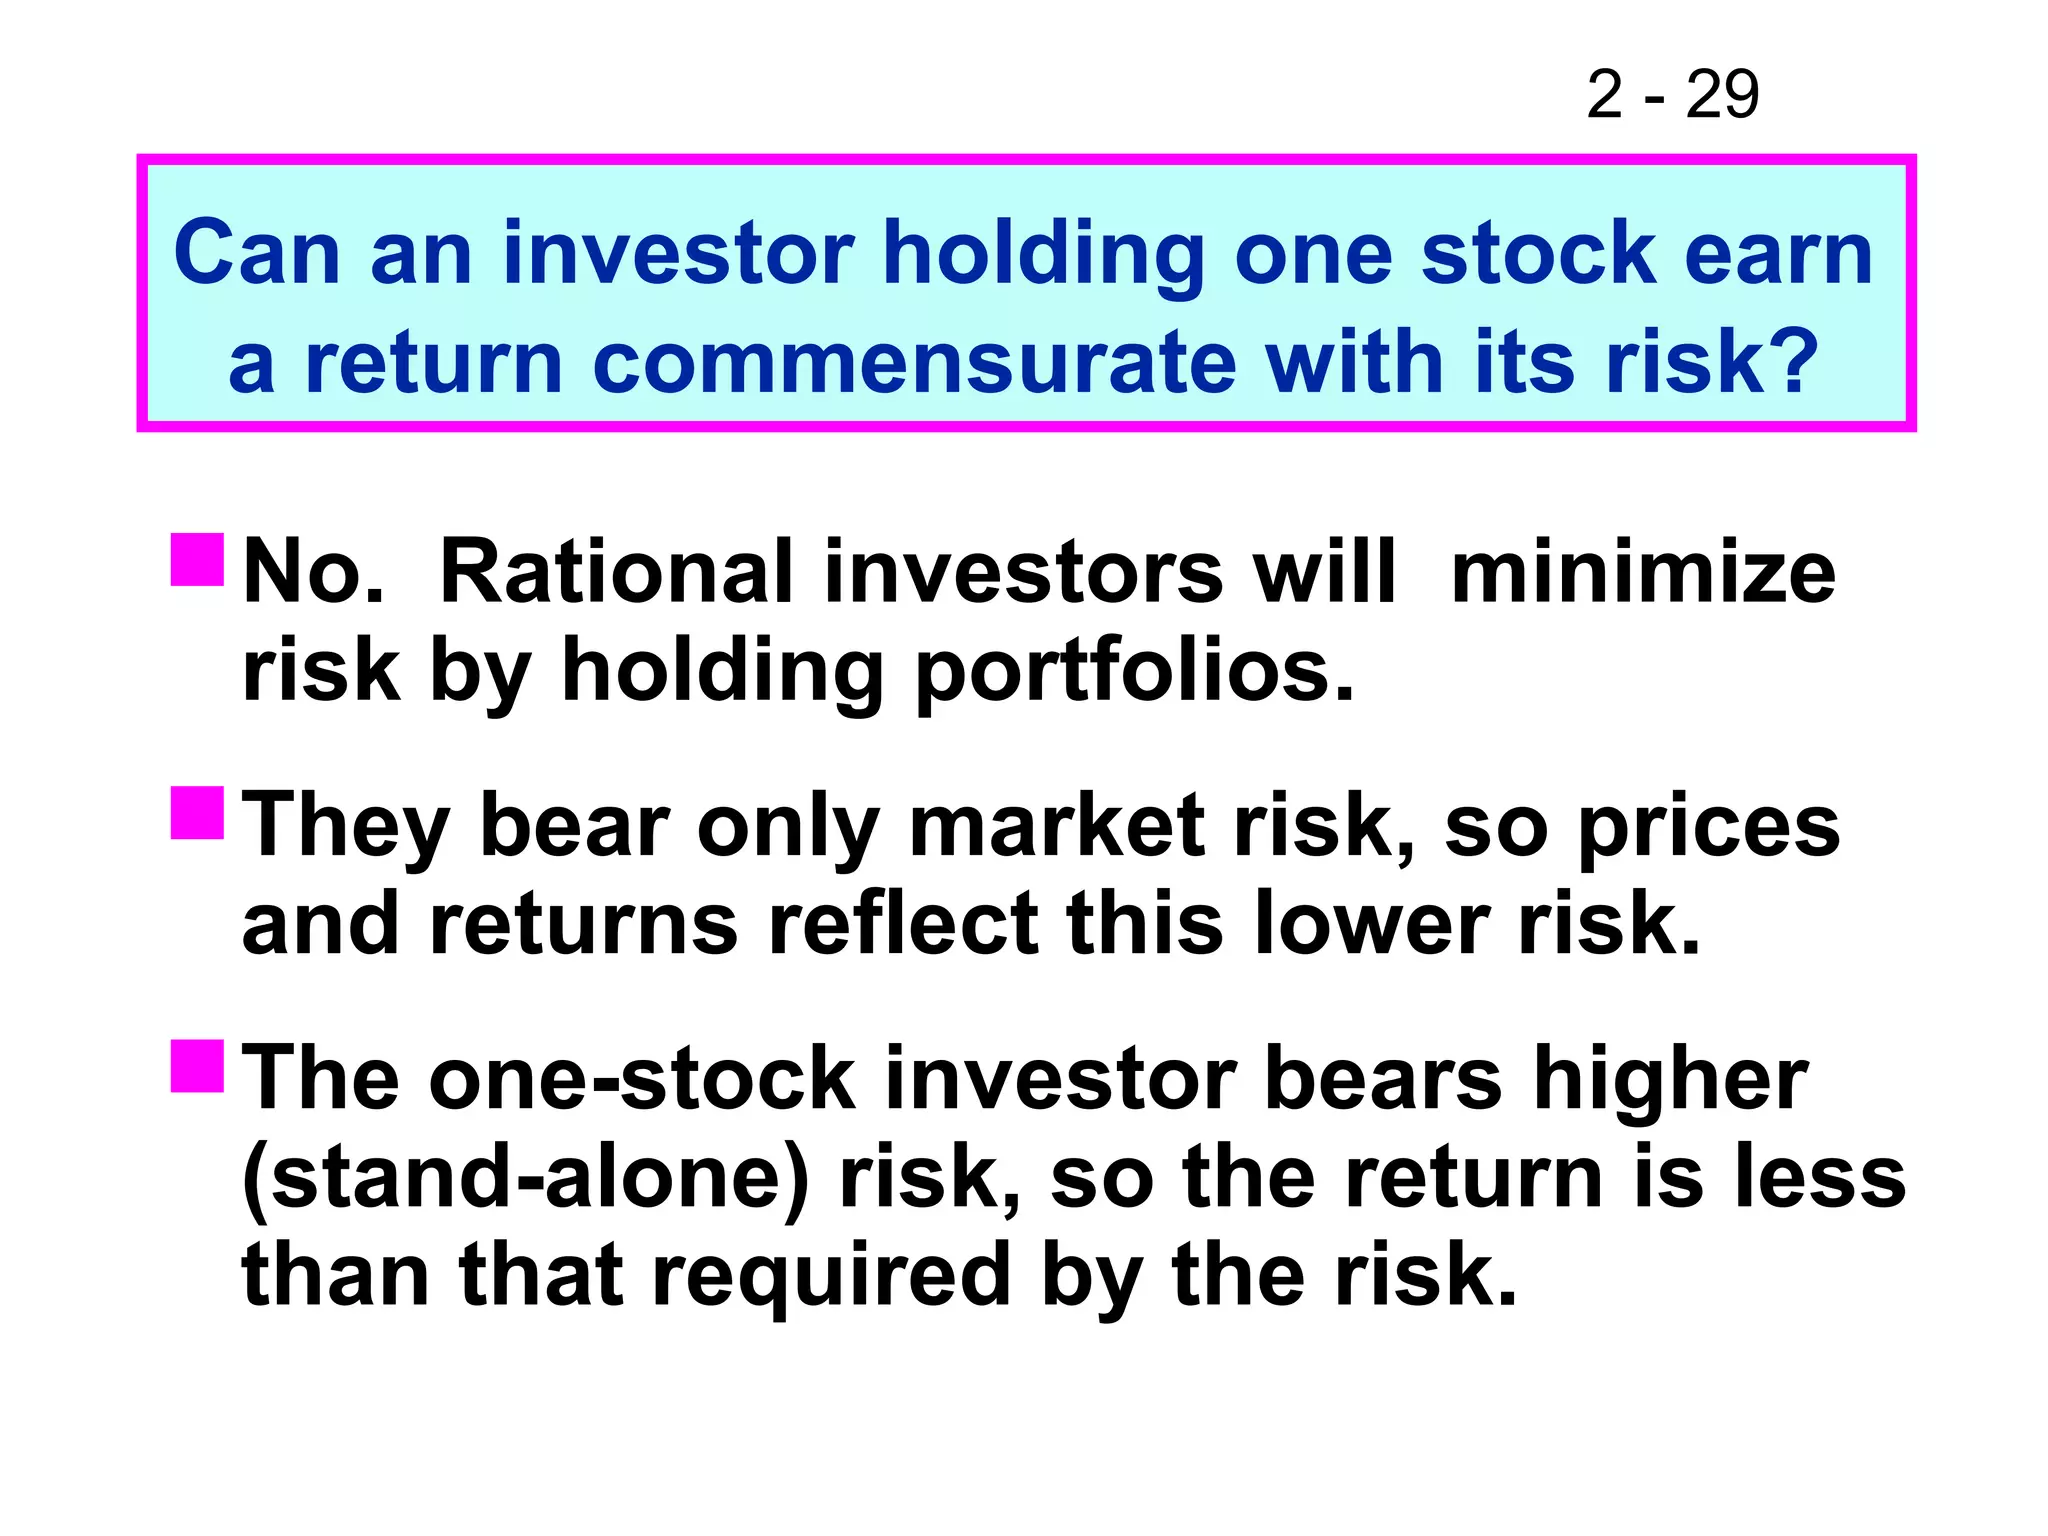
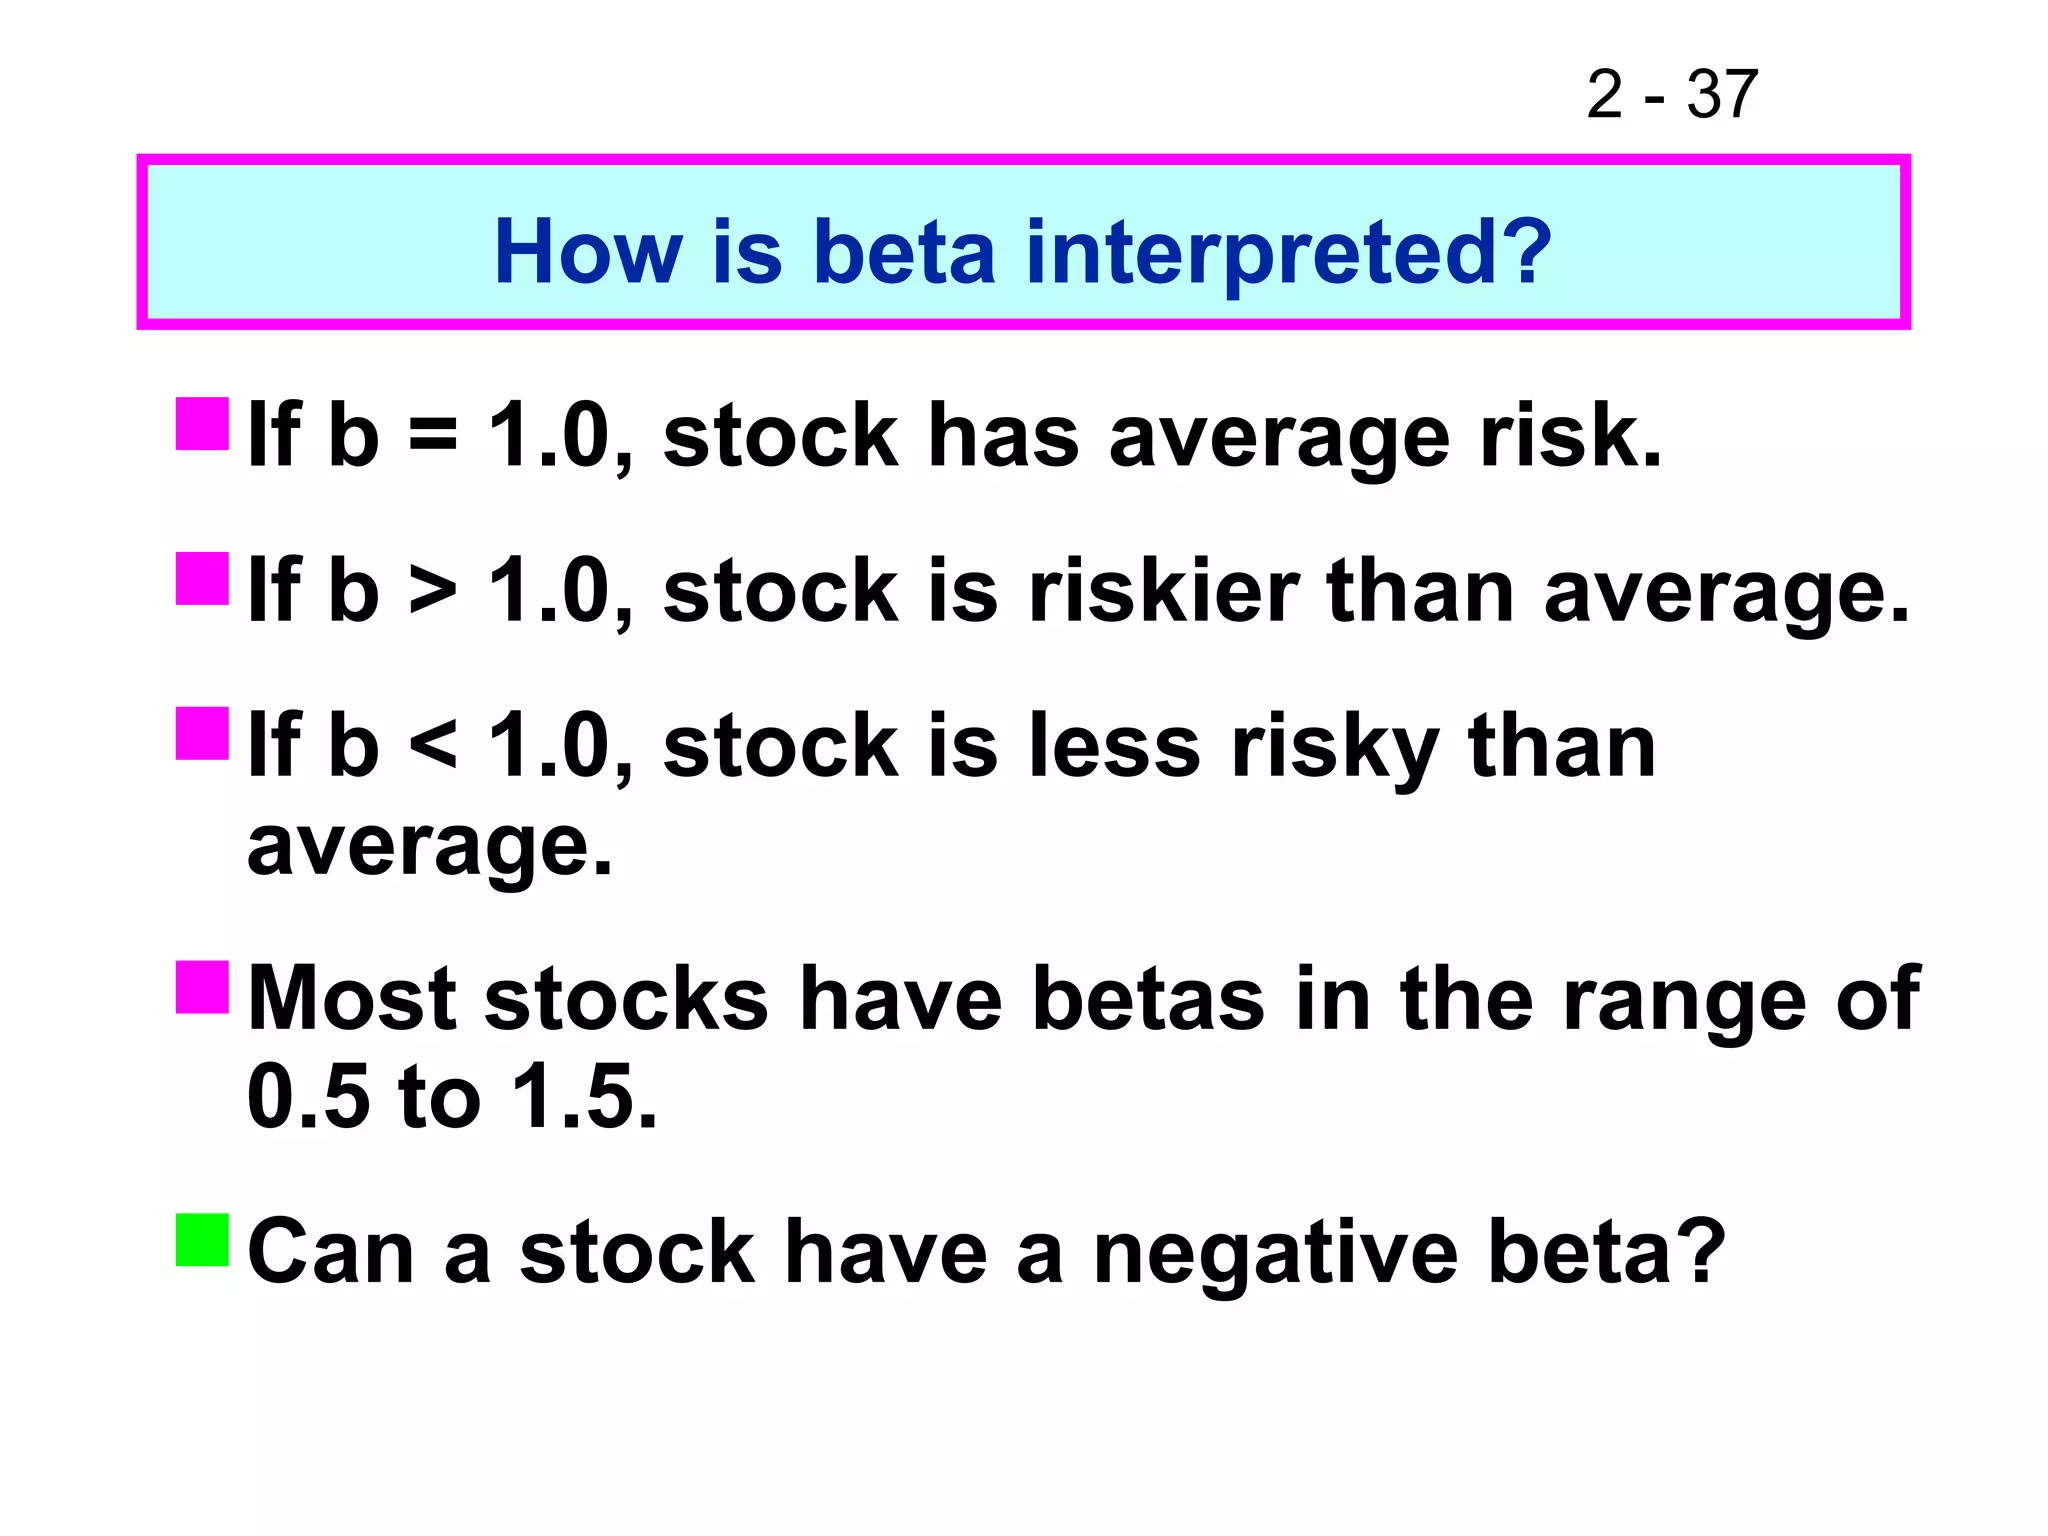
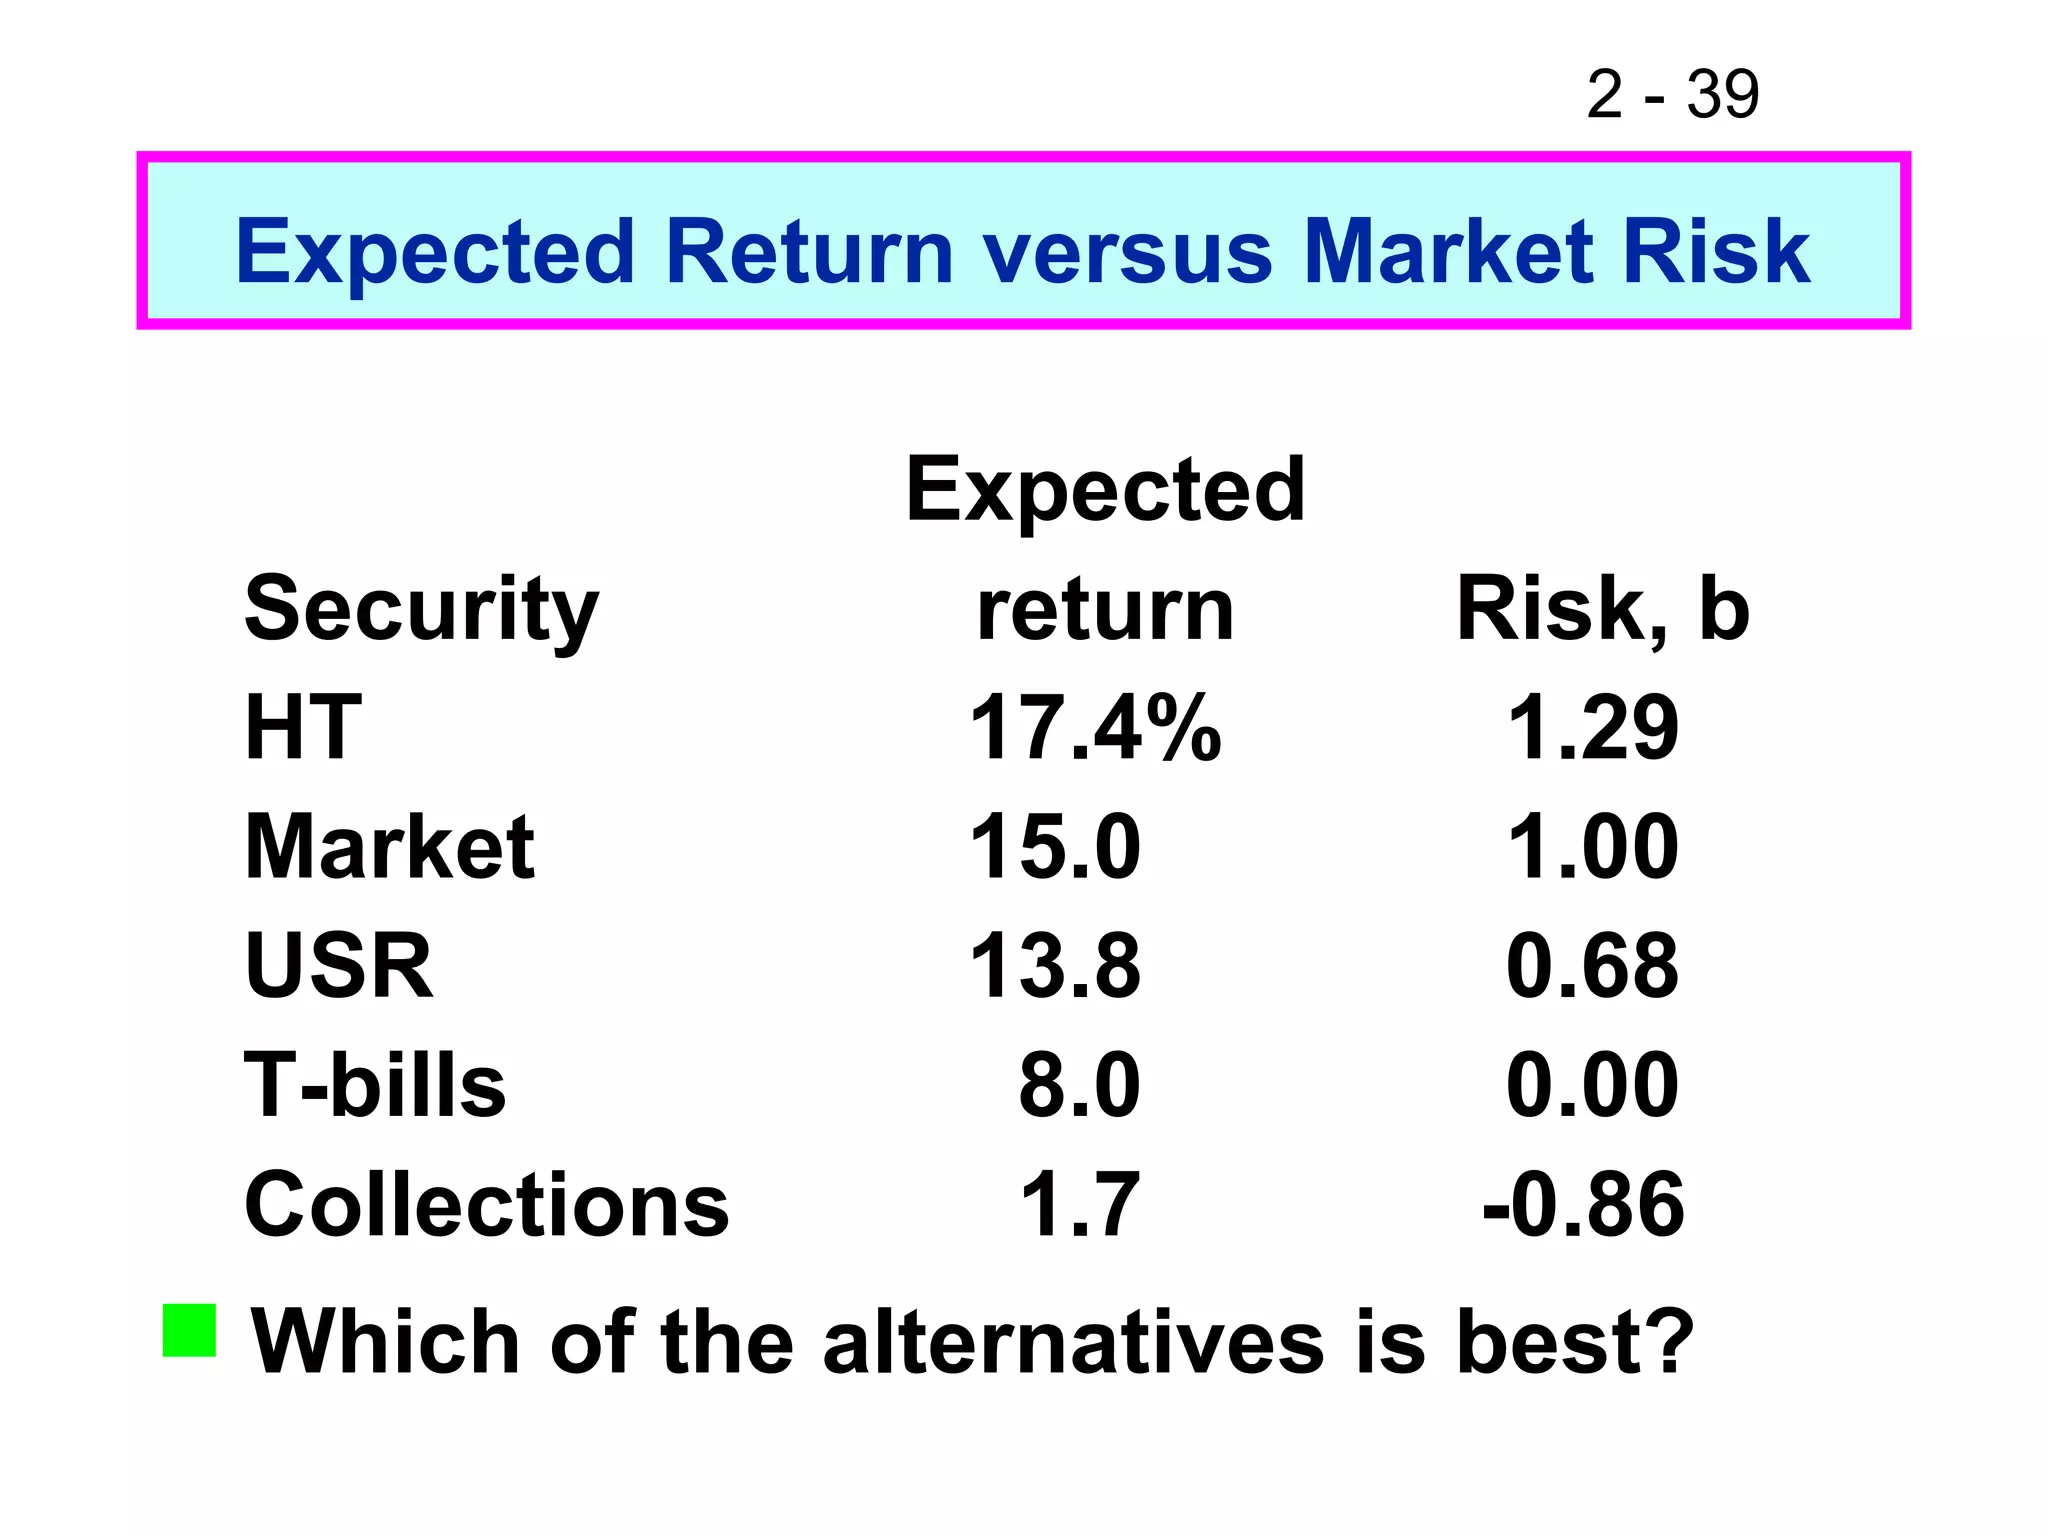
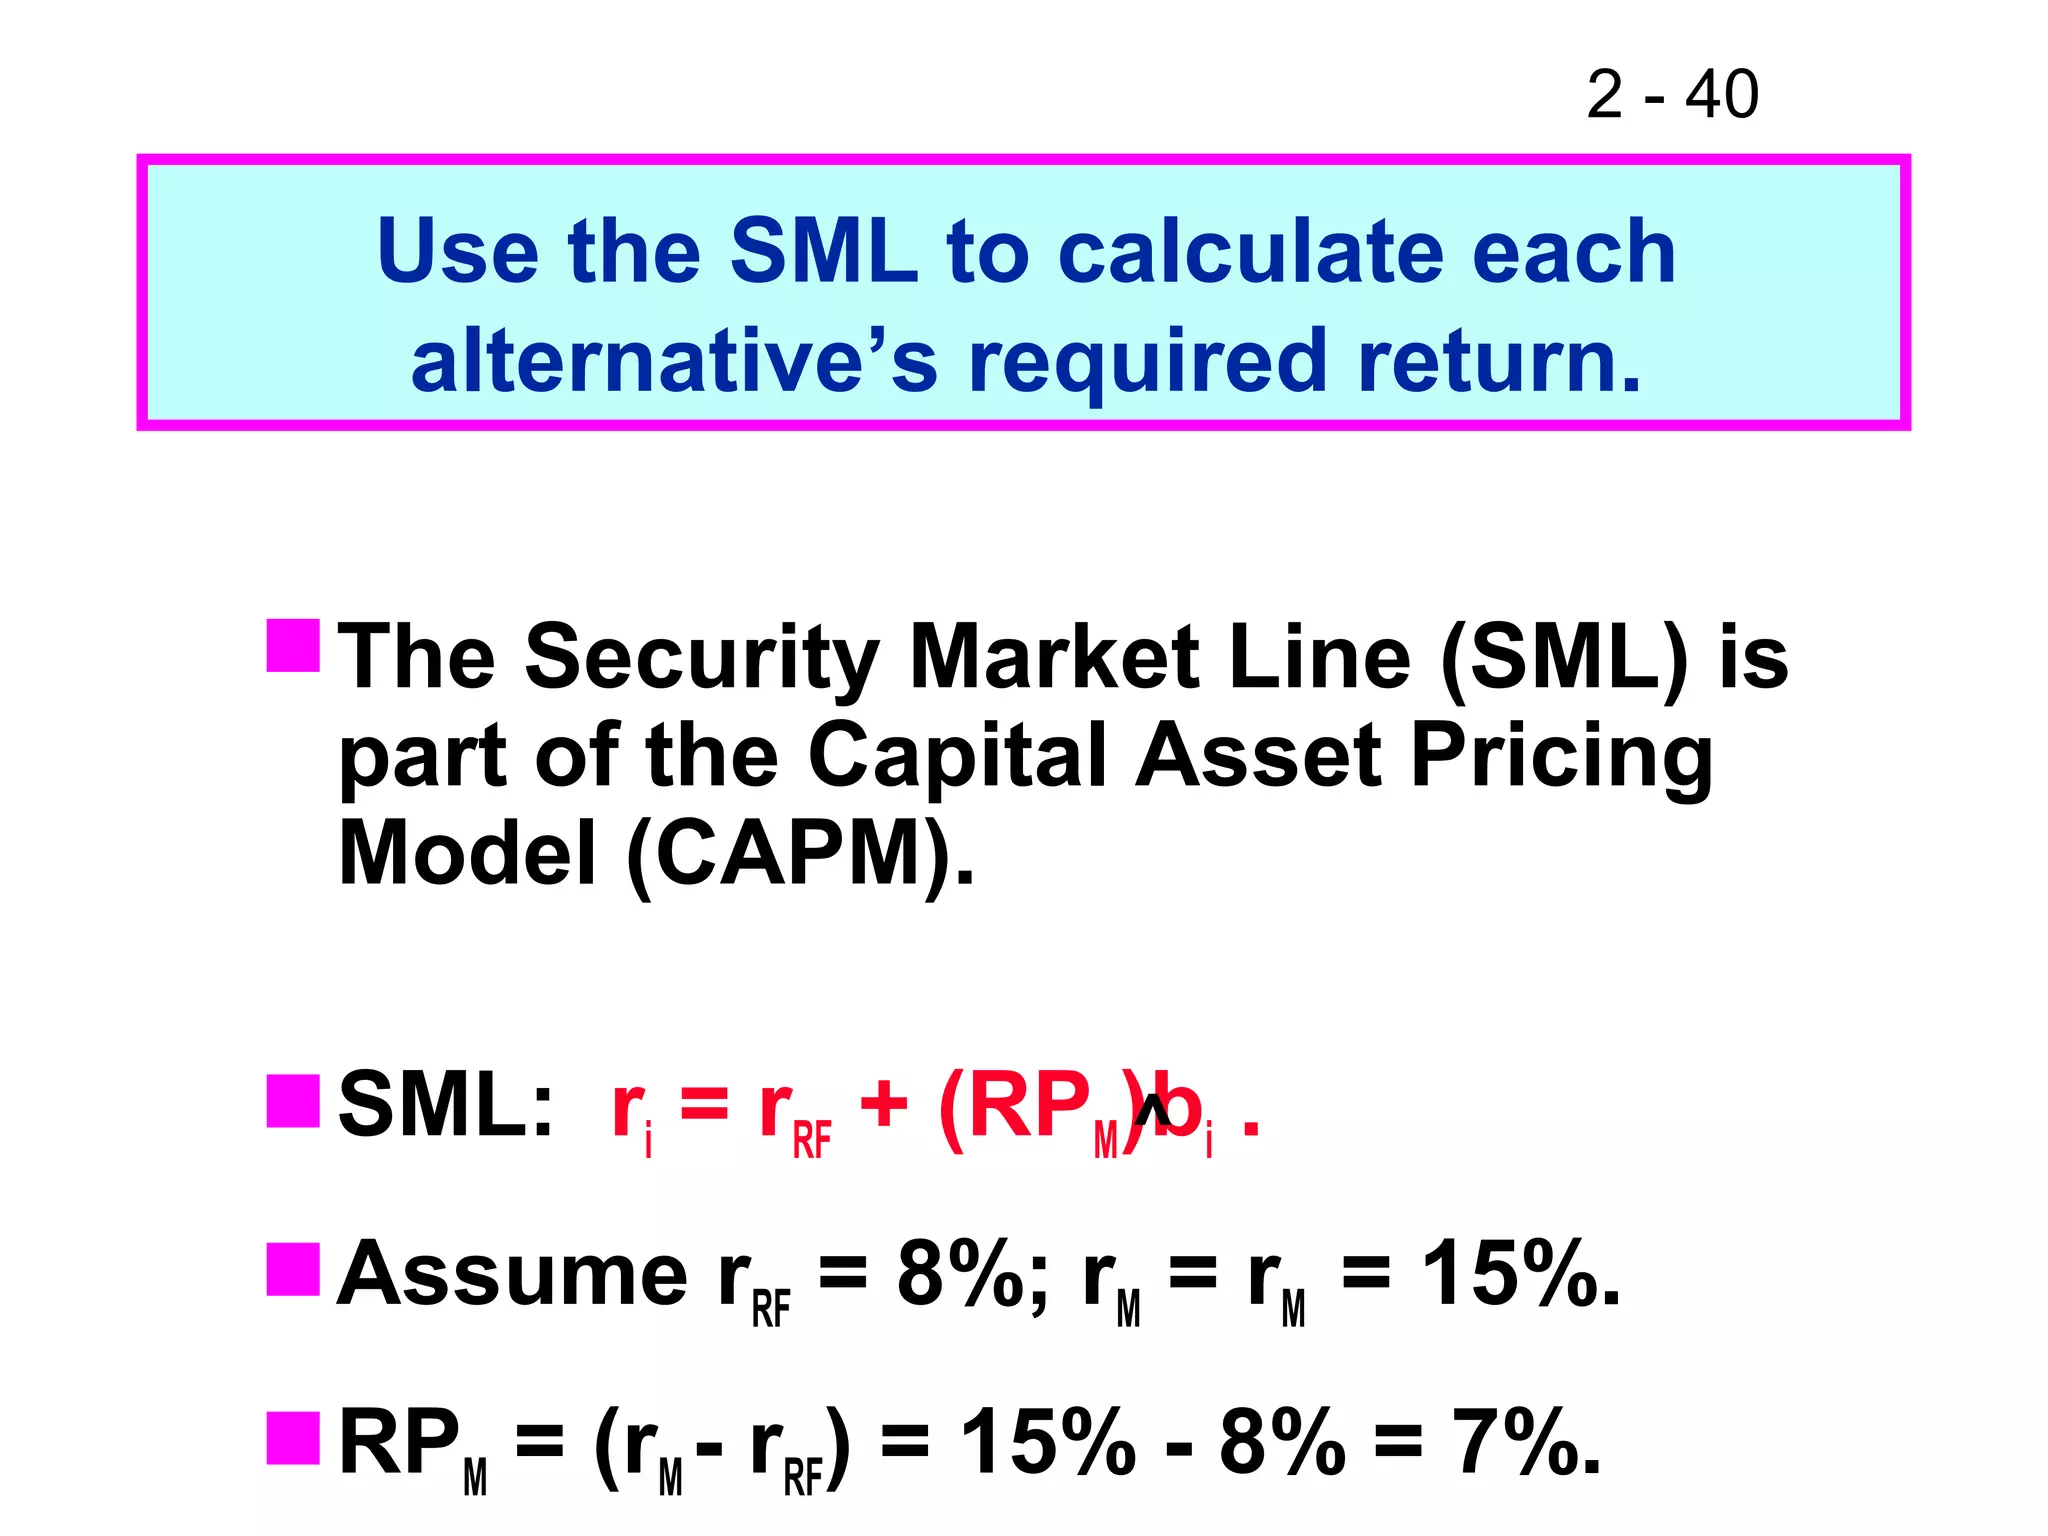
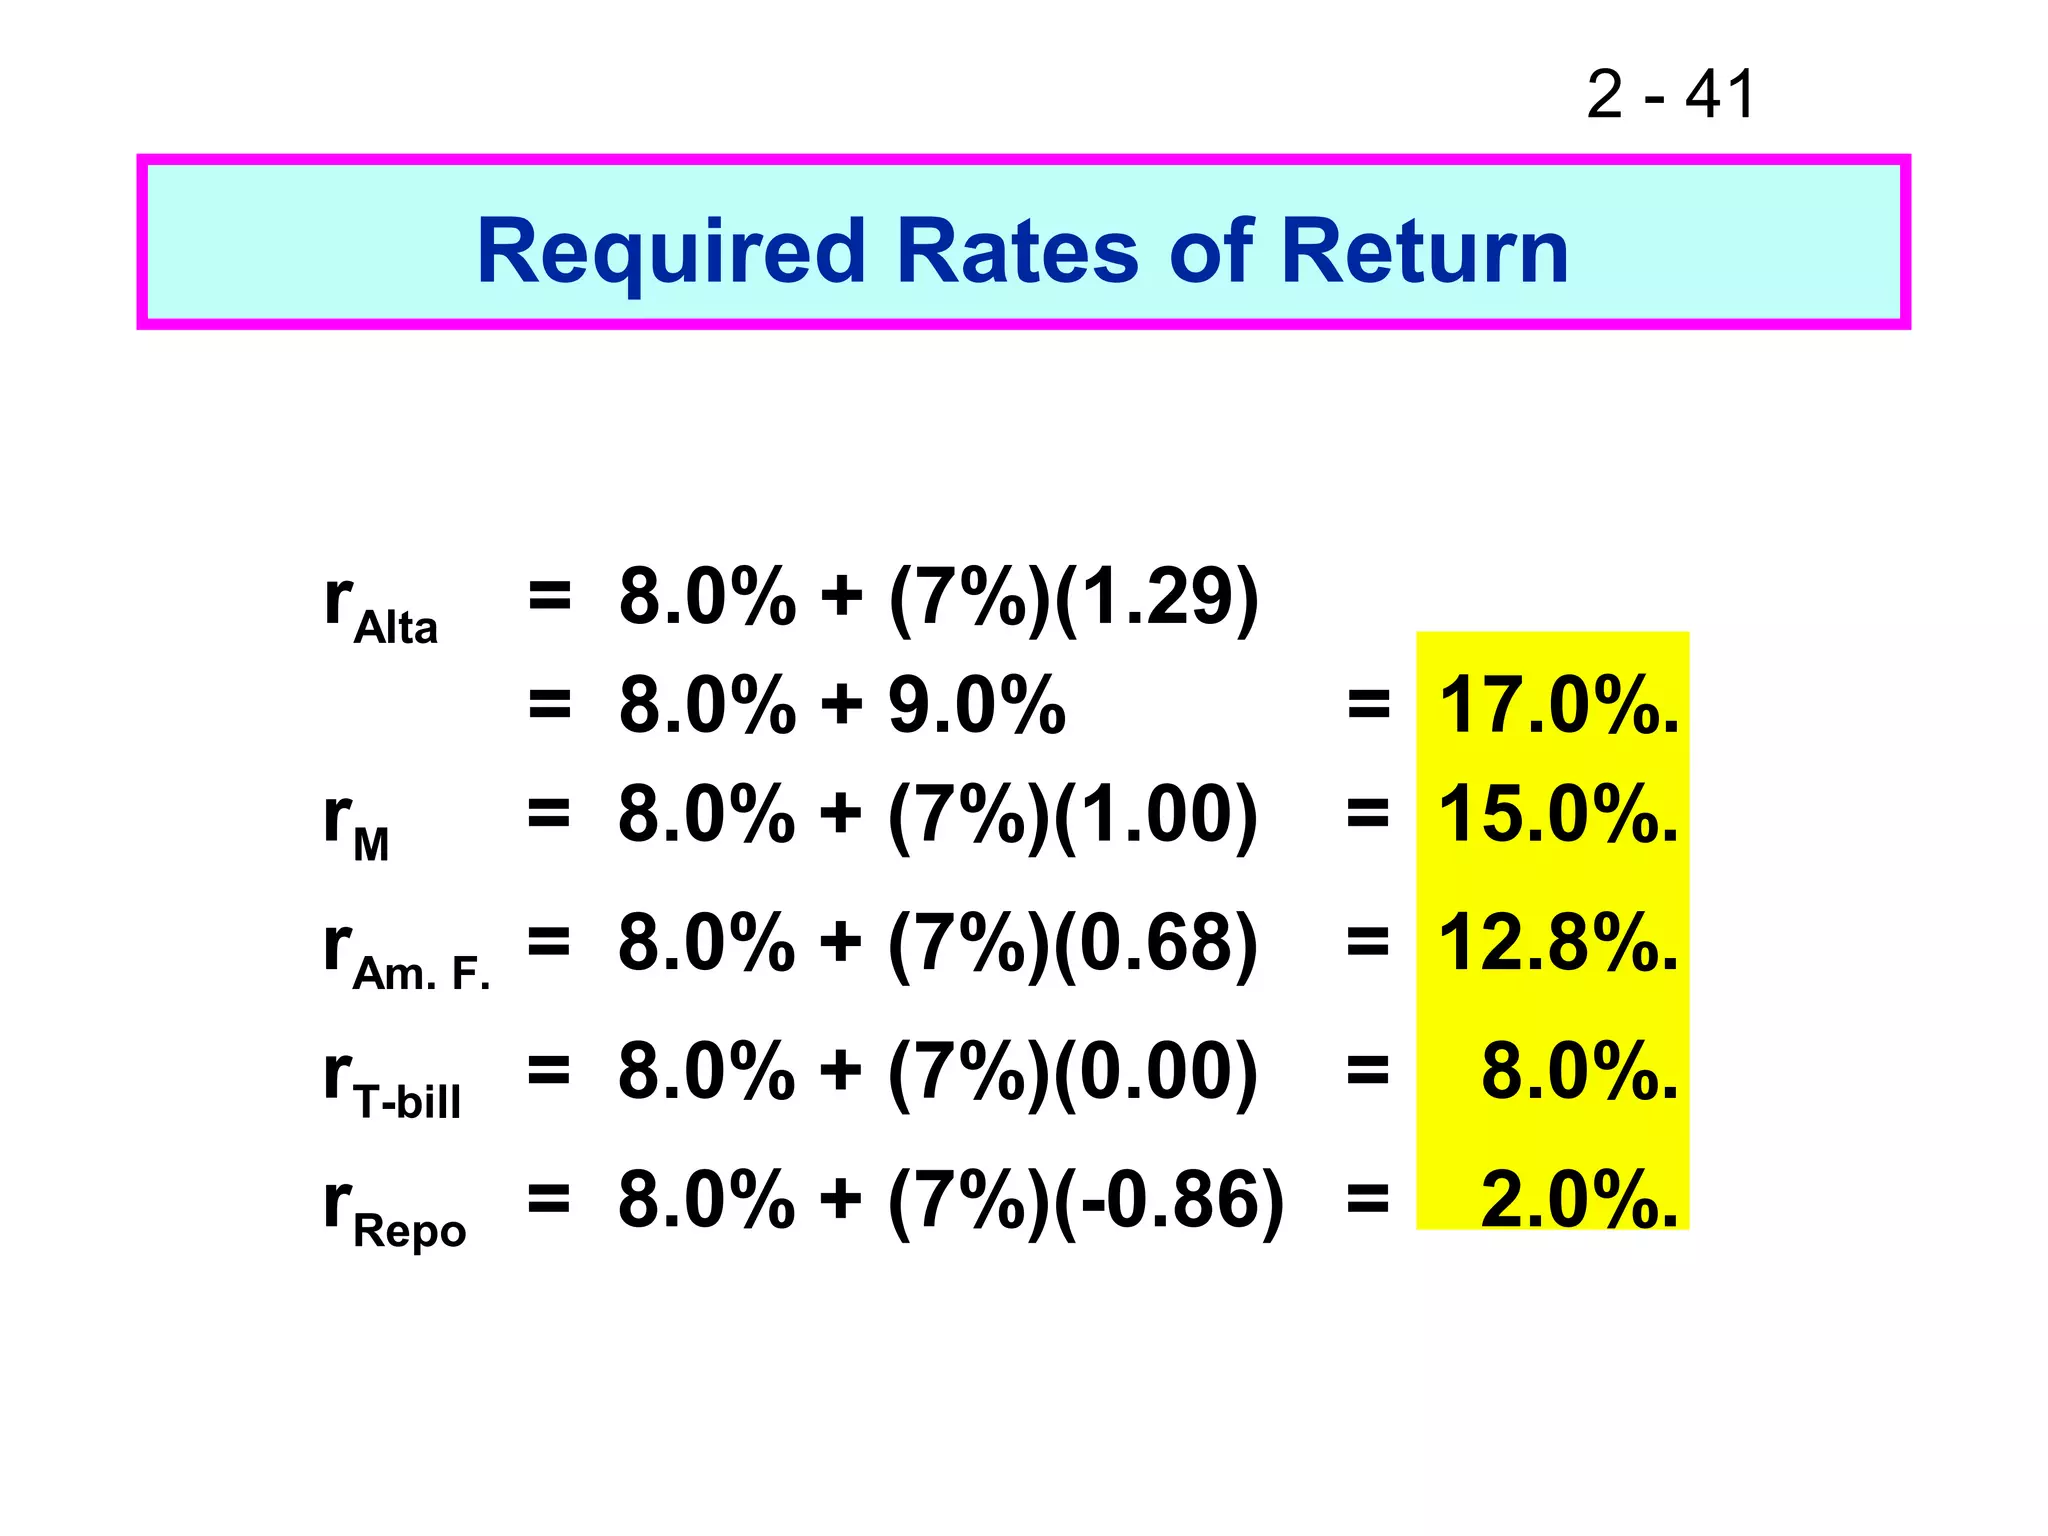
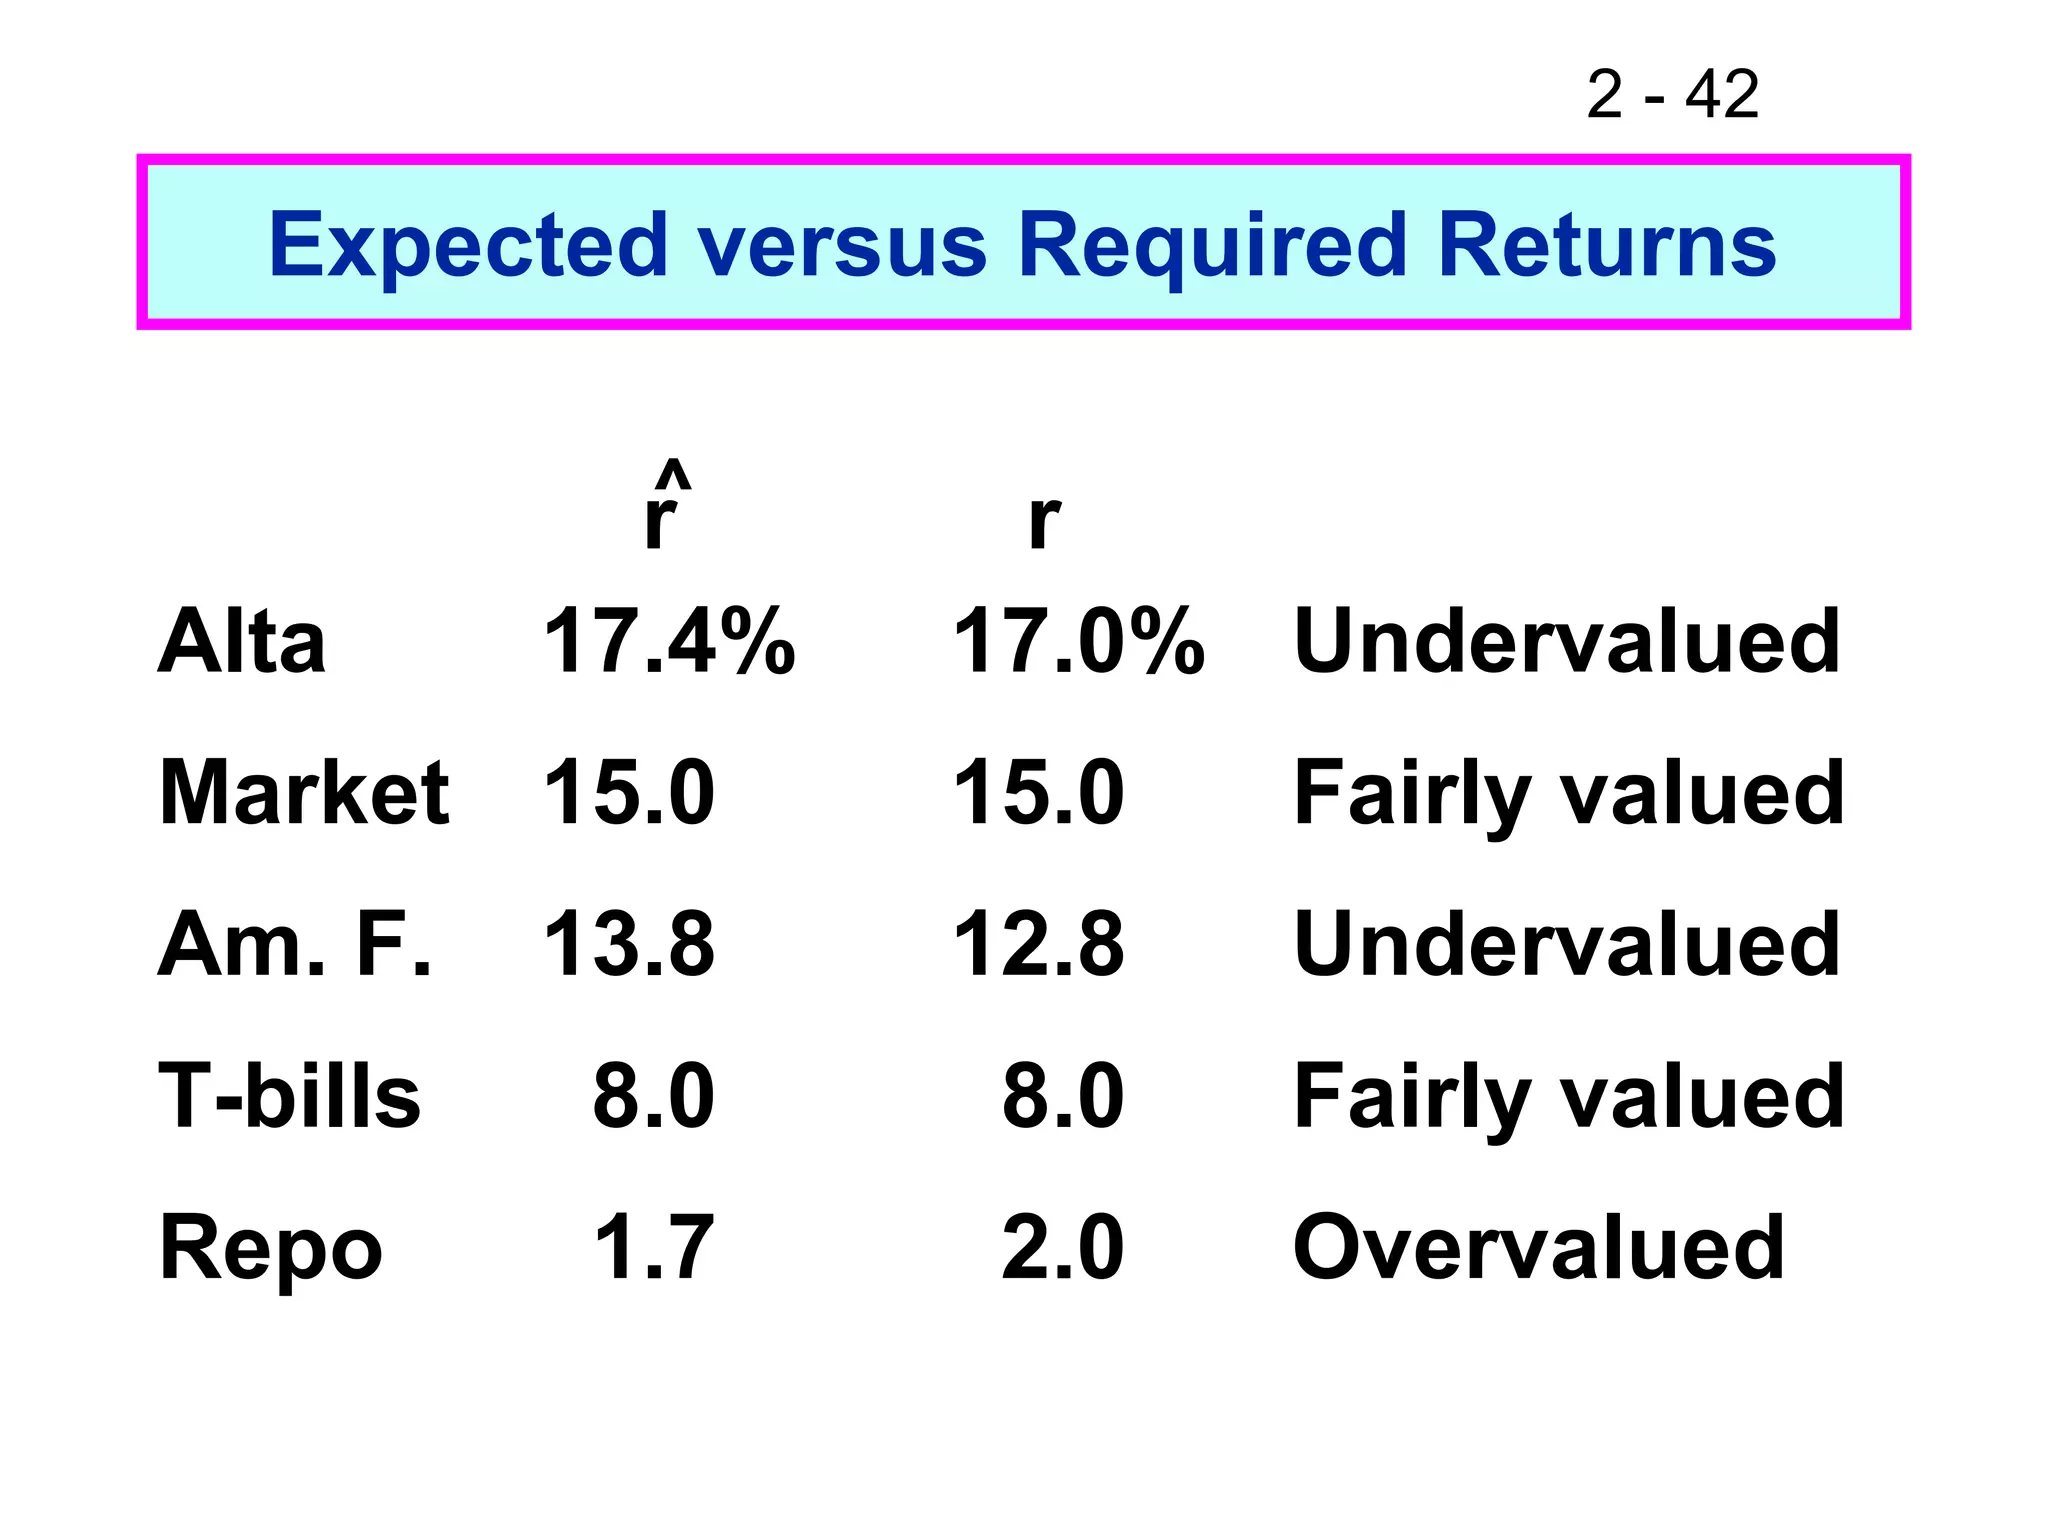
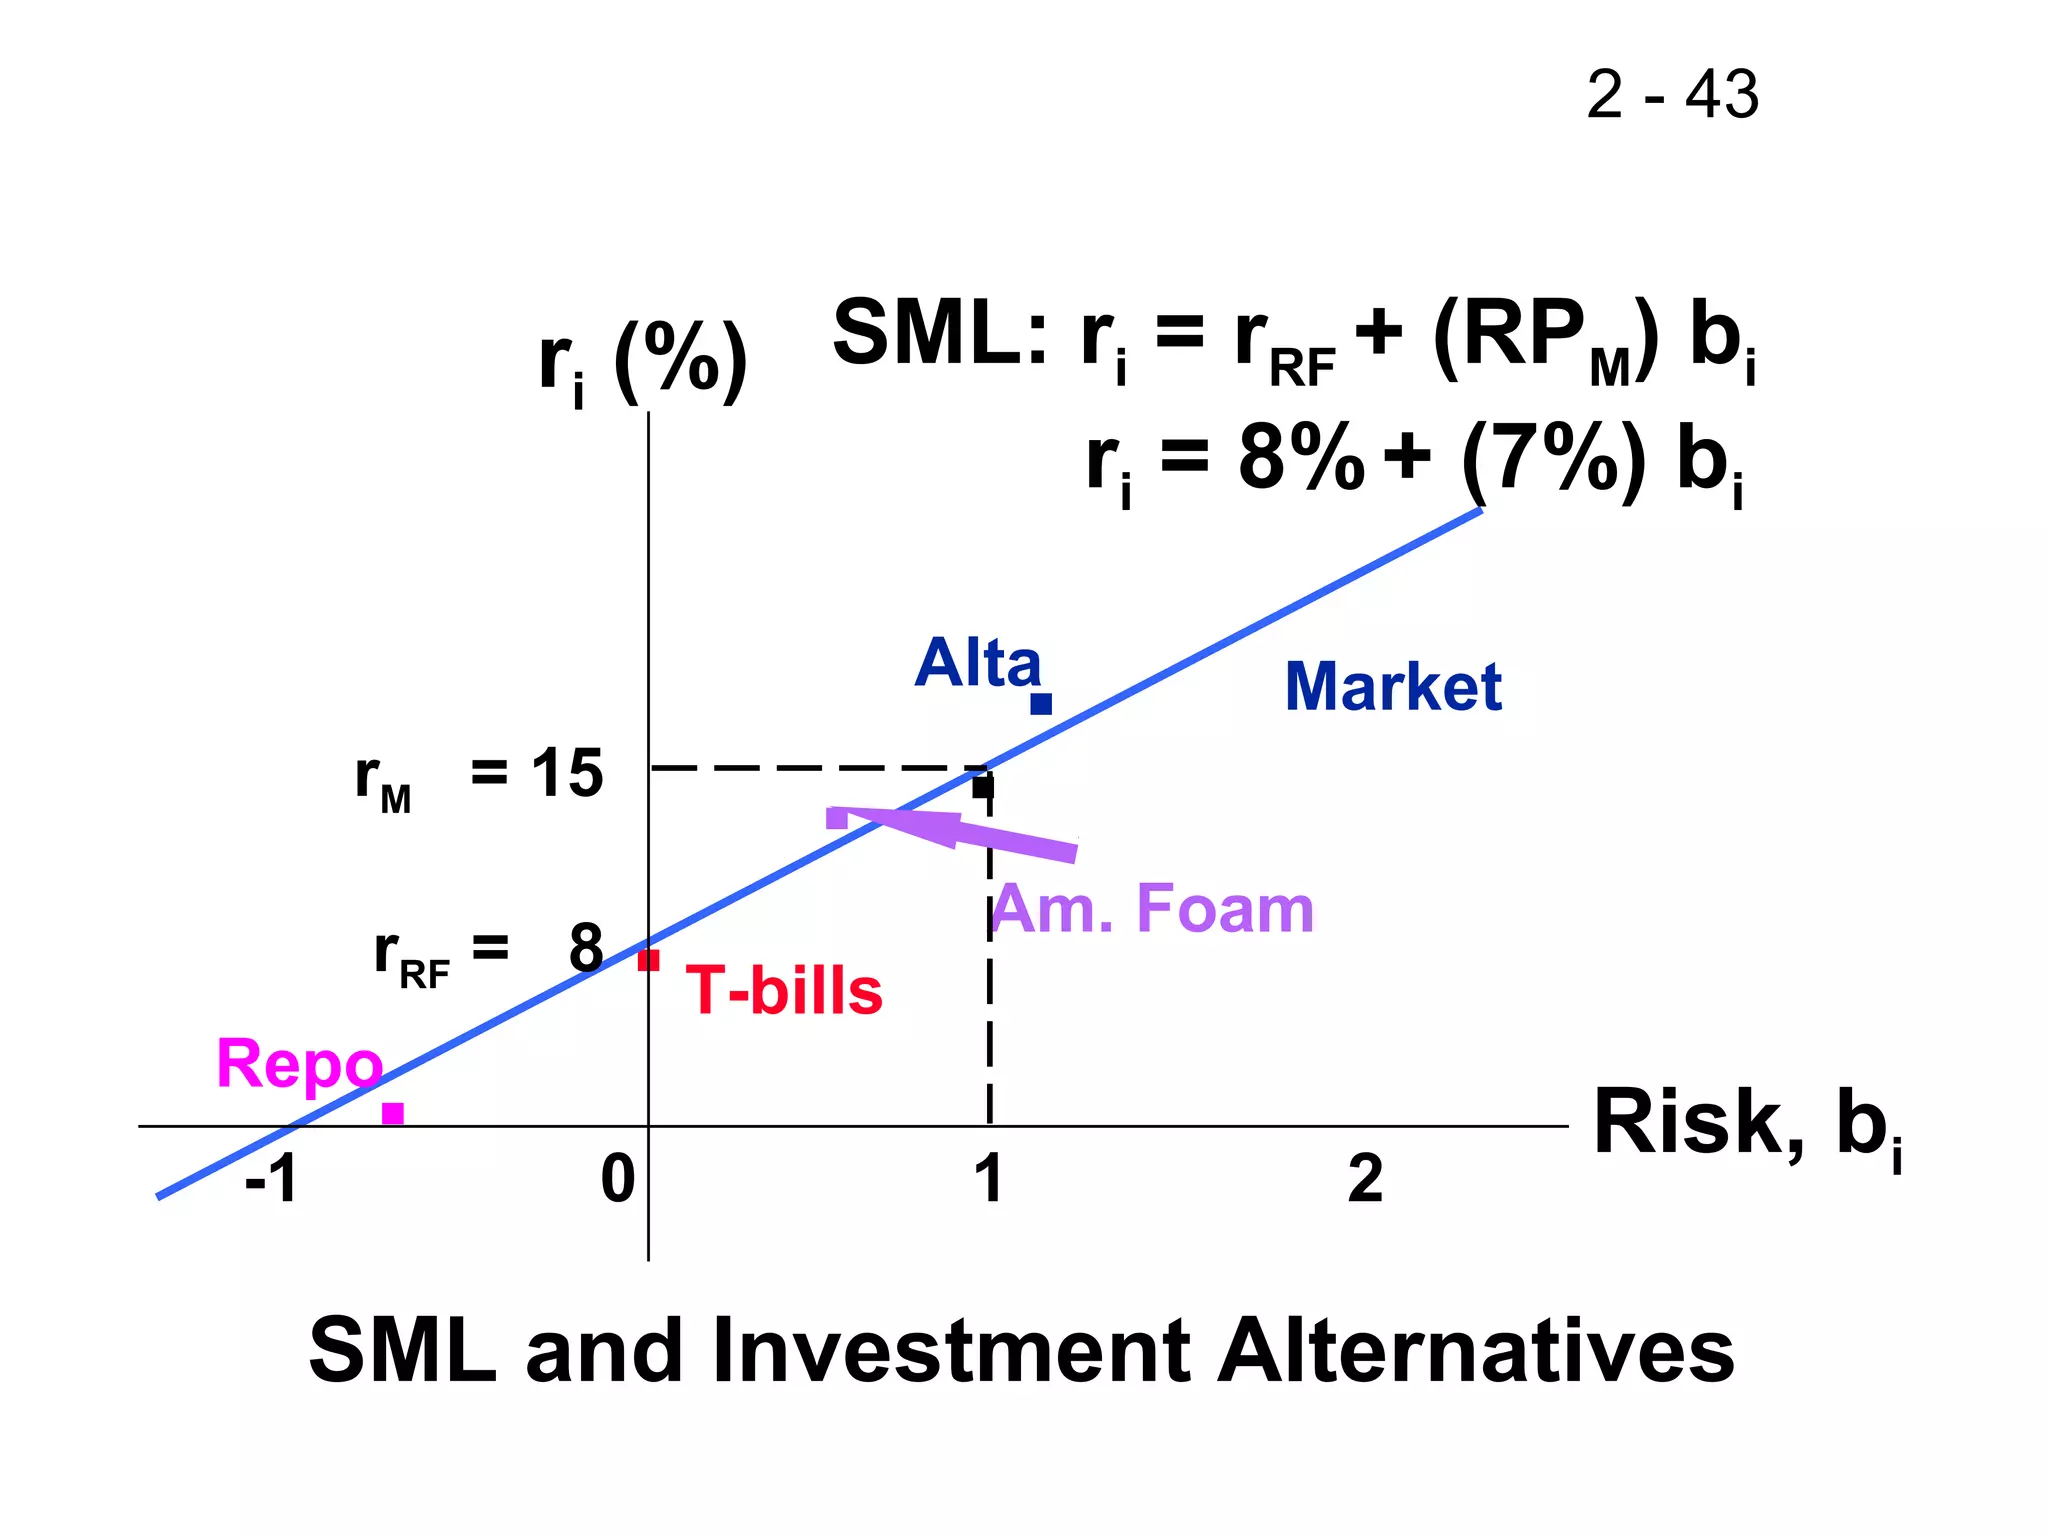
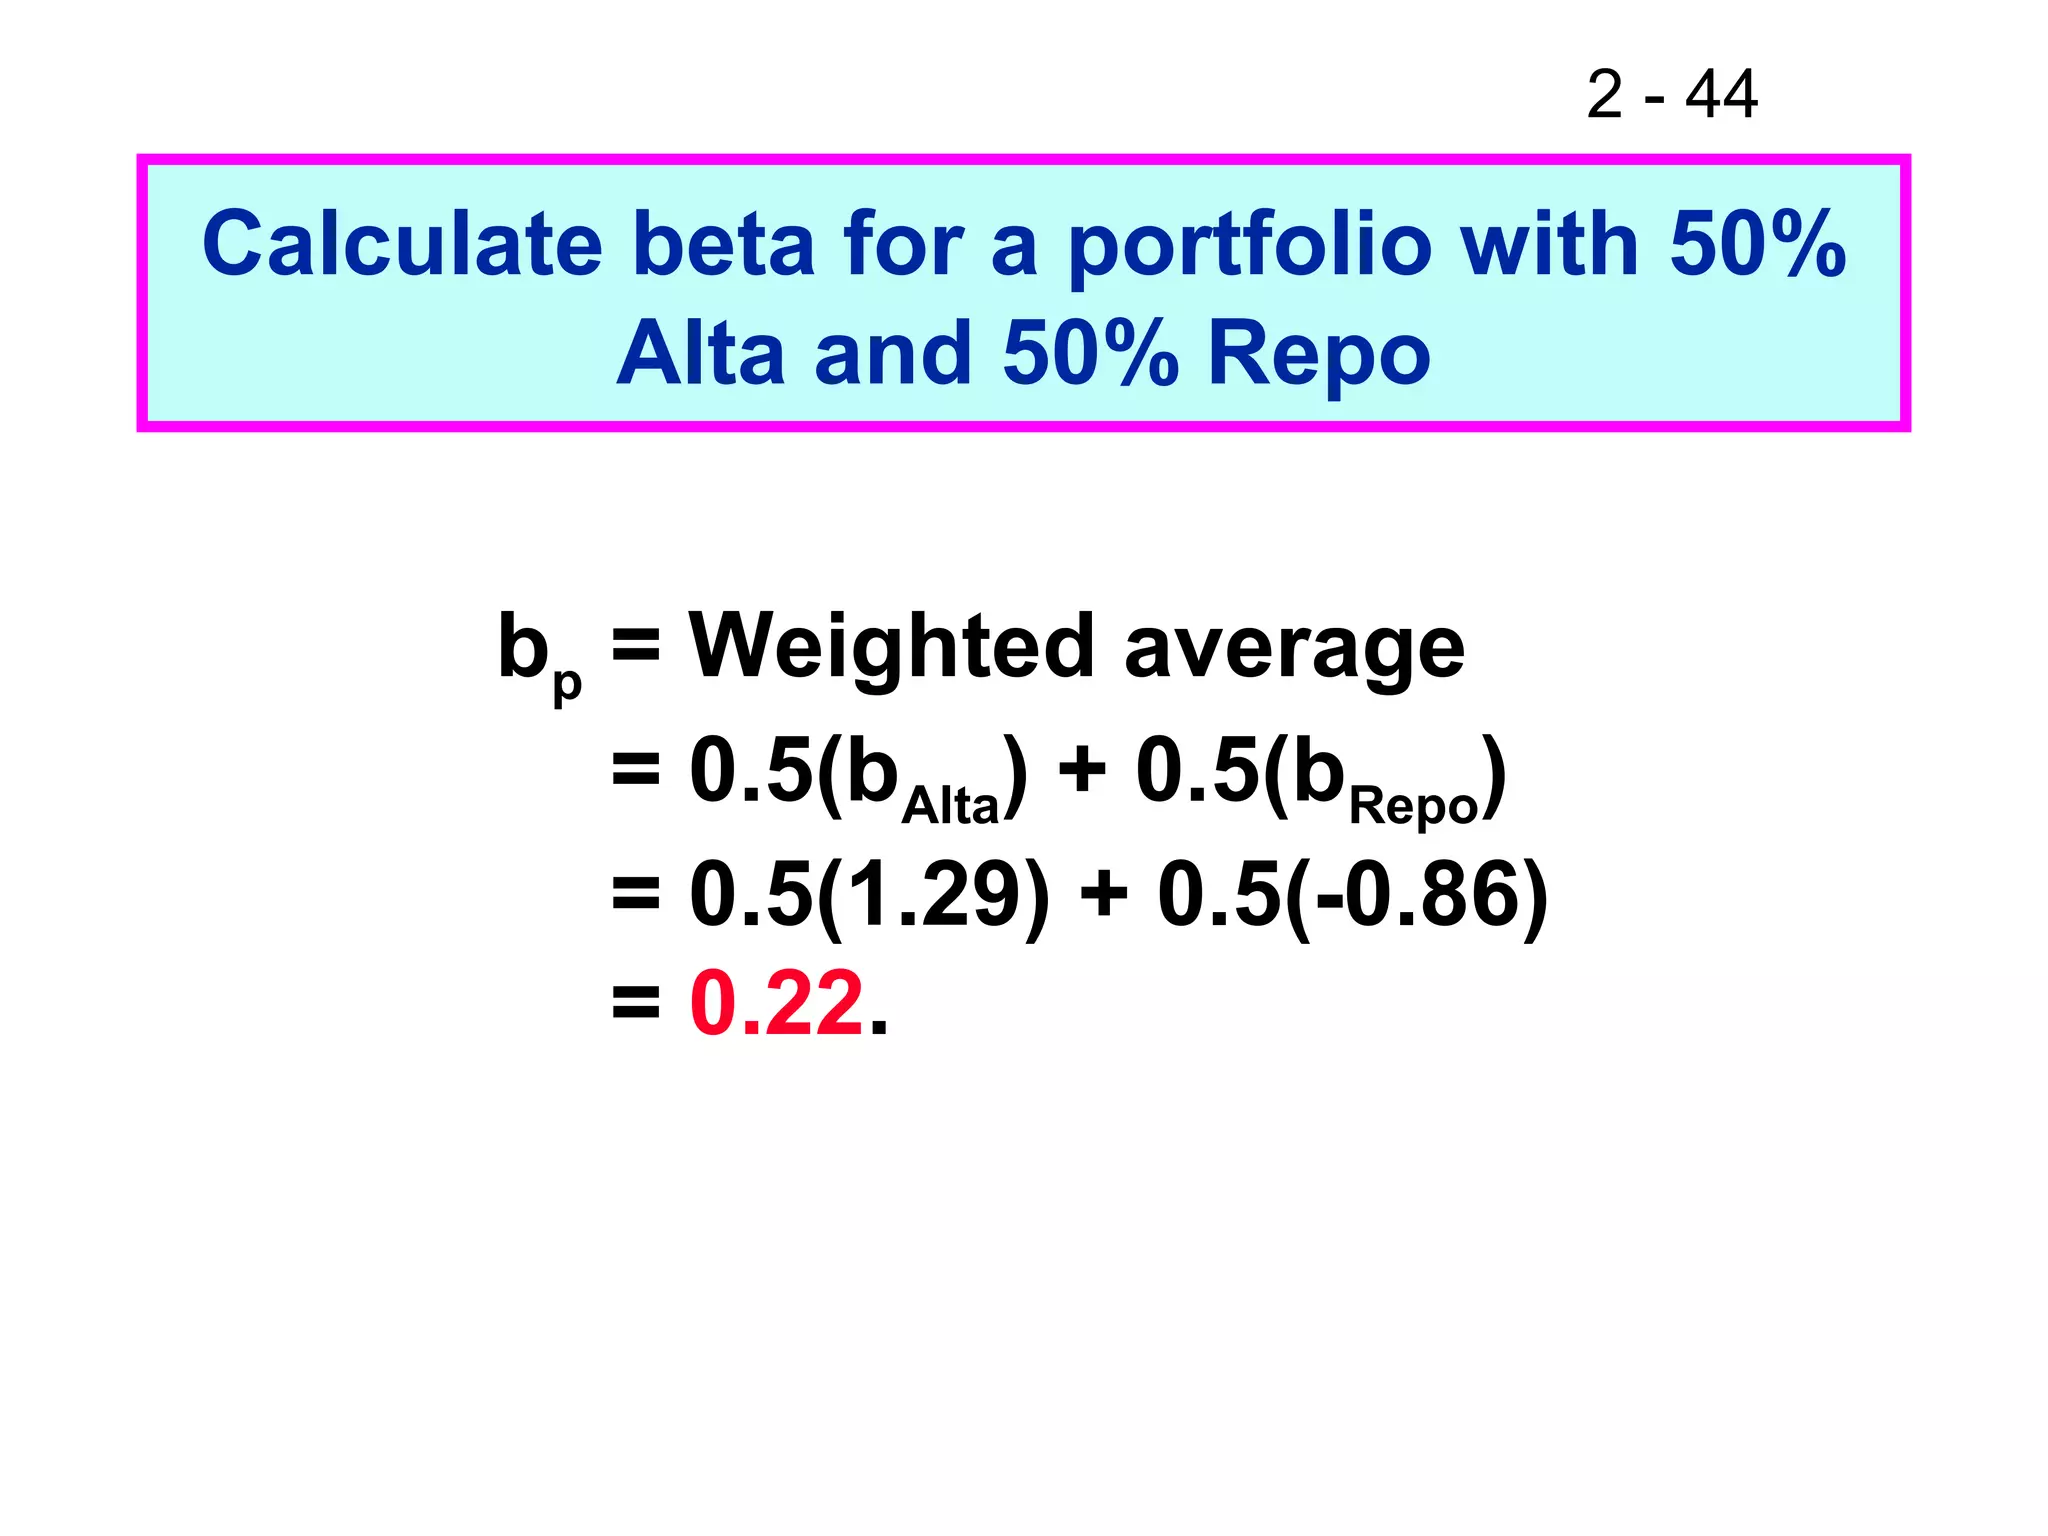
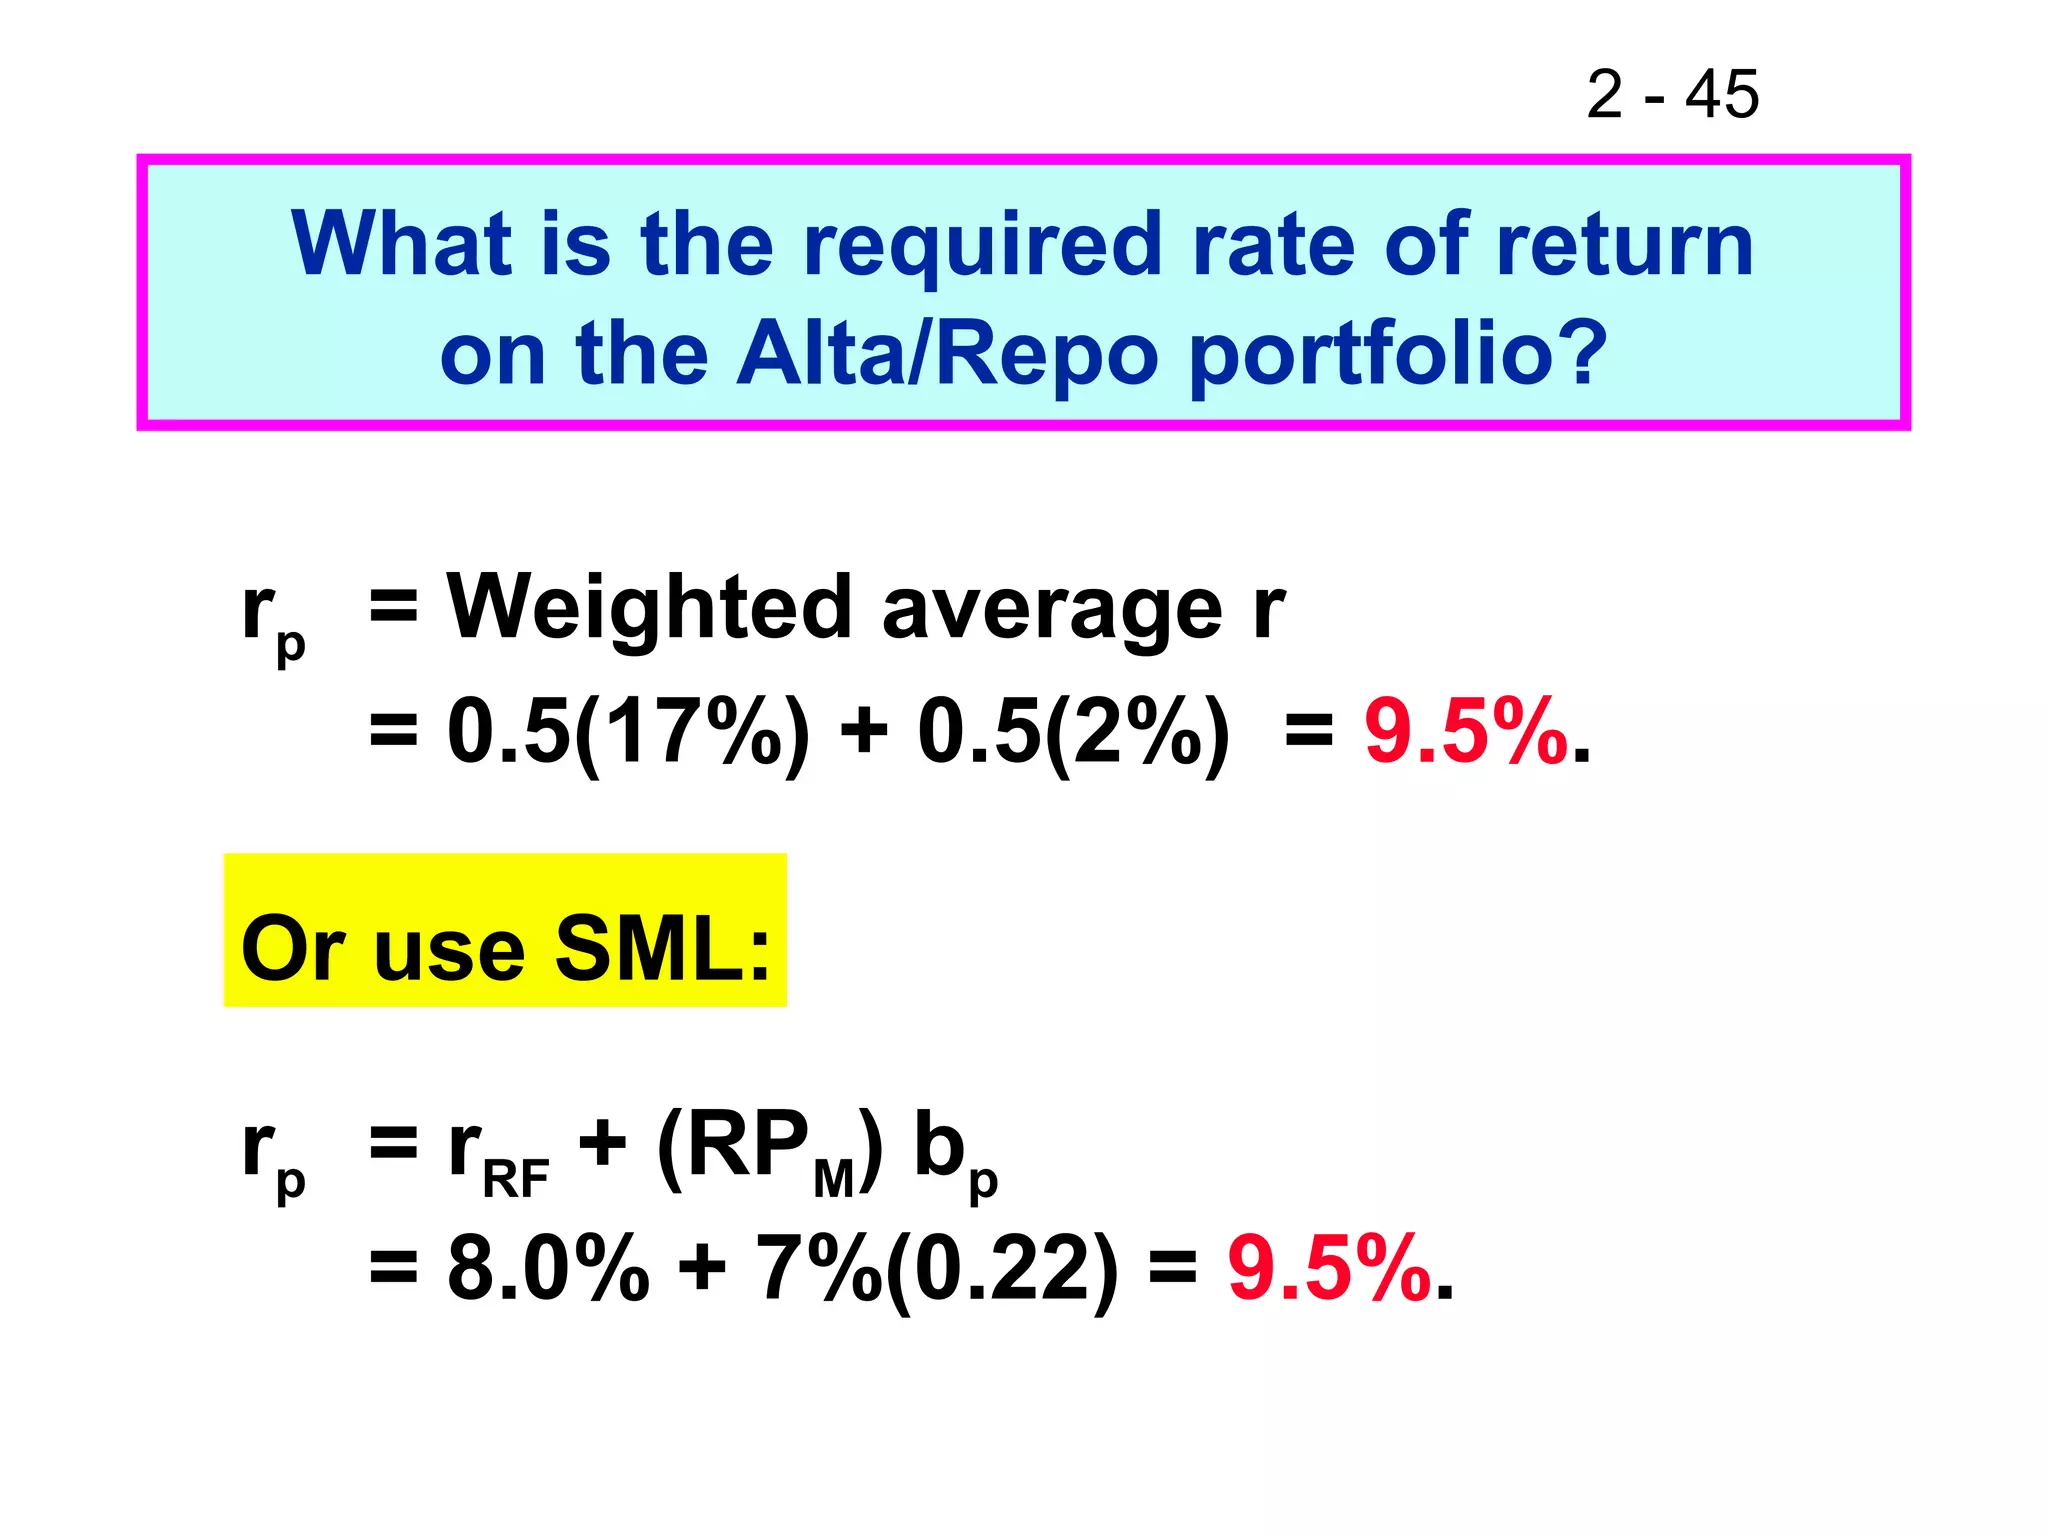
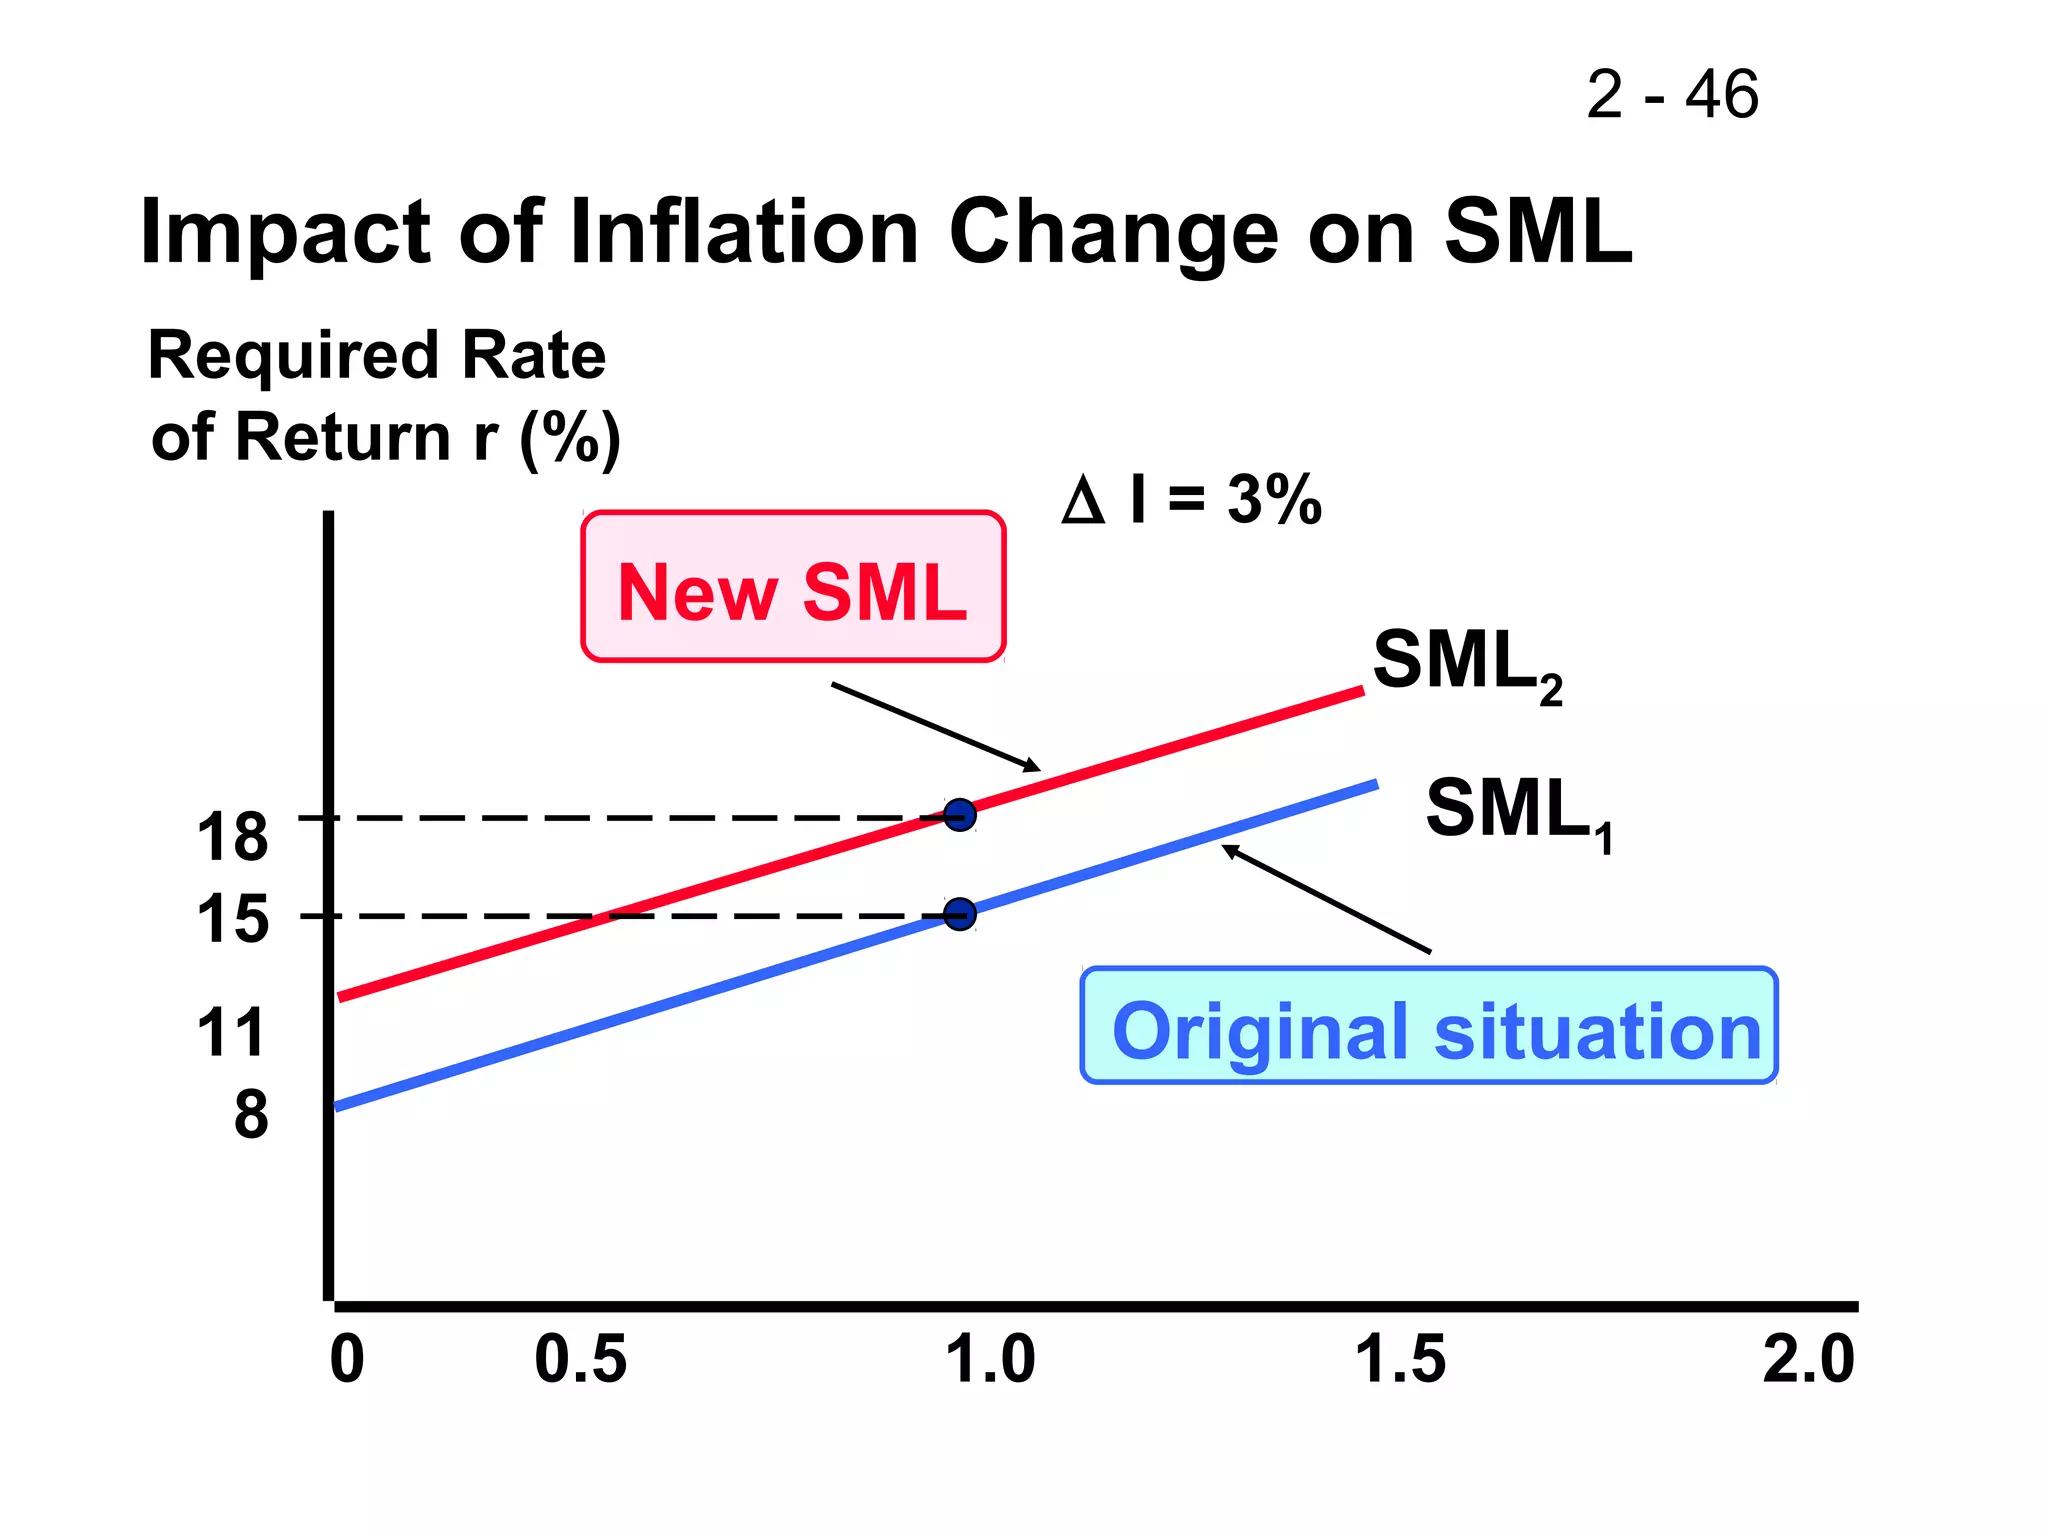
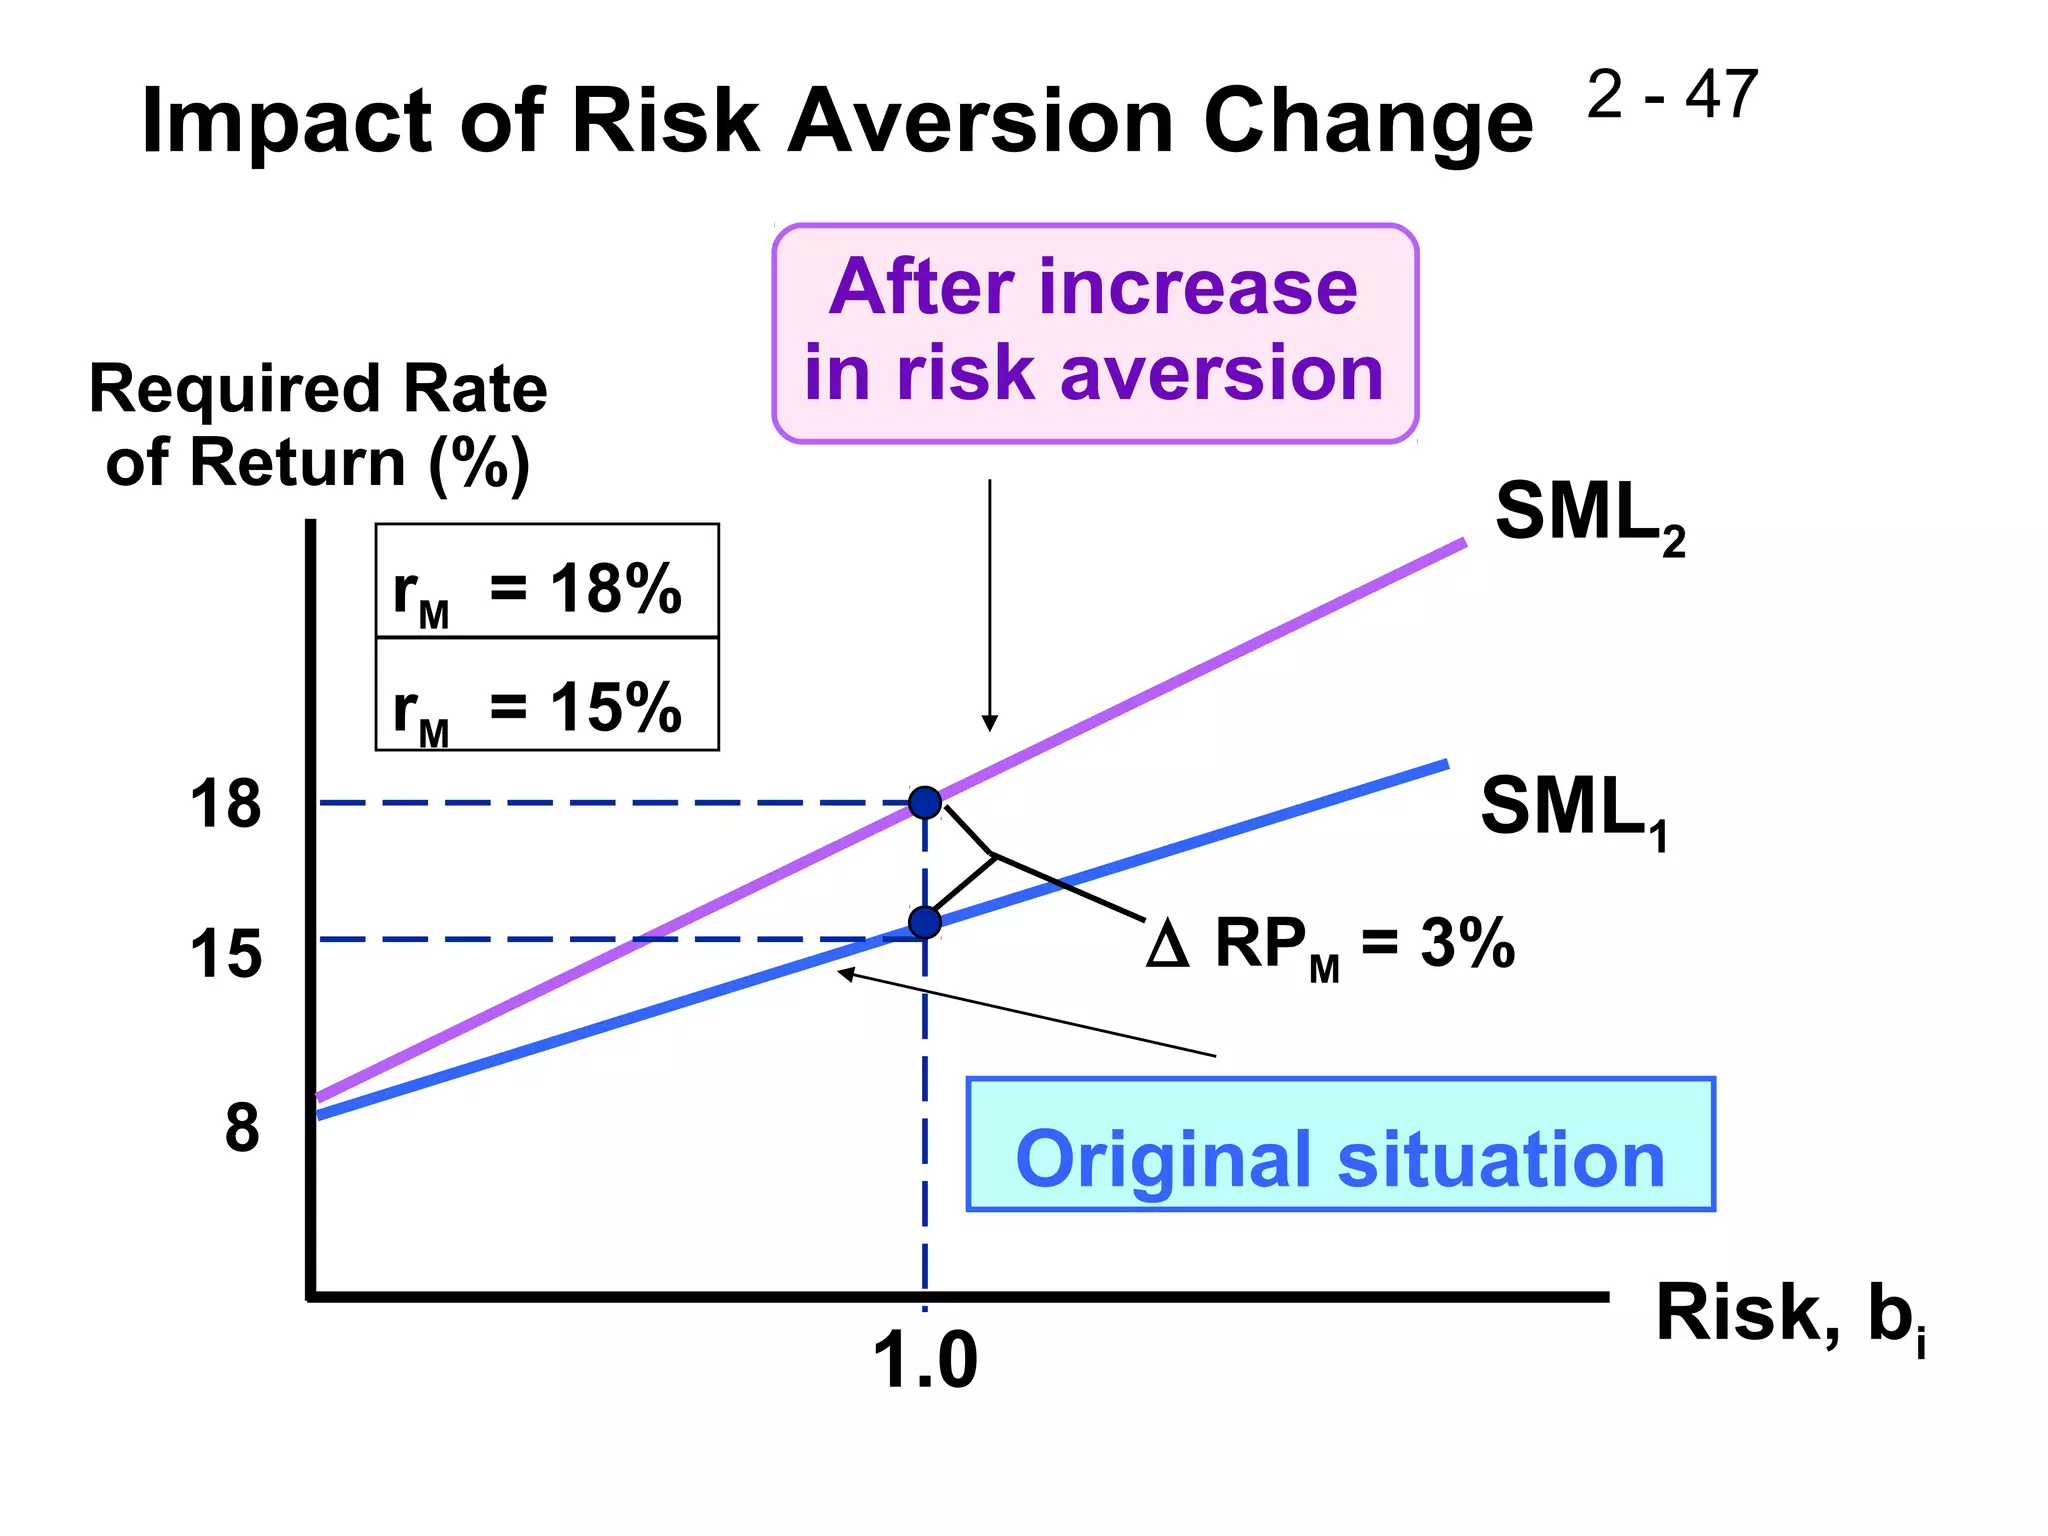
2 - 1
CHAPTER 2
Risk and Return: Part I
Basic return concepts
Basic risk concepts
Stand-alone risk
Portfolio (market) risk
Risk and return: CAPM/SML
2 - 2
What are investment returns?
Investment returns measure the
financial results of an investment.
Returns may be historical or
prospective (anticipated).
Returns can be expressed in:
Dollar terms.
Percentage terms.
2 - 3
What is the return on an investment
that costs $1,000 and is sold
after 1 year for $1,100?
Dollar return:
Percentage return:
$ Received - $ Invested
$1,100 - $1,000 = $100.
$ Return/$ Invested
$100/$1,000 = 0.10 = 10%.
2 - 4
What is investment risk?
Typically, investment returns are not
known with certainty.
Investment risk pertains to the
probability of earning a return less
than that expected.
The greater the chance of a return far
below the expected return, the
greater the risk.
2 - 5
Probability distribution
Rate of
return (%)50150-20
Stock X
Stock Y
 Which stock is riskier? Why?
2 - 6
Assume the Following
Investment Alternatives
Economy Prob. T-Bill Alta Repo Am F. MP
Recession 0.10 8.0% -22.0% 28.0% 10.0% -13.0%
Below avg. 0.20 8.0 -2.0 14.7 -10.0 1.0
Average 0.40 8.0 20.0 0.0 7.0 15.0
Above avg. 0.20 8.0 35.0 -10.0 45.0 29.0
Boom 0.10 8.0 50.0 -20.0 30.0 43.0
1.00
2 - 7
What is unique about
the T-bill return?
The T-bill will return 8% regardless
of the state of the economy.
Is the T-bill riskless? Explain.
2 - 8
Do the returns of Alta Inds. and Repo
Men move with or counter to the
economy?
 Alta Inds. moves with the economy, so it
is positively correlated with the
economy. This is the typical situation.
 Repo Men moves counter to the
economy. Such negative correlation is
unusual.
2 - 9
Calculate the expected rate of return
on each alternative.
.∑
∧ n
1=i
iiPr=r
r = expected rate of return.
rAlta = 0.10(-22%) + 0.20(-2%)
+ 0.40(20%) + 0.20(35%)
+ 0.10(50%) = 17.4%.
^
^
2 - 10
 Alta has the highest rate of return.
 Does that make it best?
r
Alta 17.4%
Market 15.0
Am. Foam 13.8
T-bill 8.0
Repo Men 1.7
^
2 - 11
What is the standard deviation
of returns for each alternative?
.
Variance
deviationStandard
1
2
2
∑=
∧






−=
==
=
n
i
ii Prr
σσ
σ
2 - 12
σT-bills = 0.0%.
σAlta = 20.0%.
σRepo = 13.4%.
σAm Foam = 18.8%.
σMarket = 15.3%.
.
1
2
∑=
∧






−=
n
i
ii Prrσ
Alta Inds:
σ = ((-22 - 17.4)2
0.10 + (-2 - 17.4)2
0.20
+ (20 - 17.4)2
0.40 + (35 - 17.4)2
0.20
+ (50 - 17.4)2
0.10)1/2
= 20.0%.
2 - 13
Prob.
Rate of Return (%)
T-bill
Am. F.
Alta
0 8 13.8 17.4
2 - 14
Standard deviation measures the
stand-alone risk of an investment.
The larger the standard deviation,
the higher the probability that
returns will be far below the
expected return.
Coefficient of variation is an
alternative measure of stand-alone
risk.
2 - 15
Expected Return versus Risk
Expected
Security return Risk, σ
Alta Inds. 17.4% 20.0%
Market 15.0 15.3
Am. Foam 13.8 18.8
T-bills 8.0 0.0
Repo Men 1.7 13.4
2 - 16
Coefficient of Variation:
CV = Standard deviation/Expected return
CVT-BILLS
= 0.0%/8.0% = 0.0.
CVAlta Inds
= 20.0%/17.4% = 1.1.
CVRepo Men
= 13.4%/1.7% = 7.9.
CVAm. Foam
= 18.8%/13.8% = 1.4.
CVM
= 15.3%/15.0% = 1.0.
2 - 17
Expected Return versus Coefficient of
Variation
Expecte
d
Risk: Risk
:
Security return σ CV
Alta Inds 17.4% 20.0% 1.1
Market 15.0 15.3 1.0
Am. Foam 13.8 18.8 1.4
T-bills 8.0 0.0 0.0
Repo Men 1.7 13.4 7.9
2 - 18
T-bills
Coll.
Mkt
USR
Alta
0.0%
2.0%
4.0%
6.0%
8.0%
10.0%
12.0%
14.0%
16.0%
18.0%
20.0%
0.0% 5.0% 10.0% 15.0% 20.0% 25.0%
Risk (Std. Dev.)
Return
Return vs. Risk (Std. Dev.):
Which investment is best?
2 - 19
Portfolio Risk and Return
Assume a two-stock portfolio with
$50,000 in Alta Inds. and $50,000 in
Repo Men.
Calculate rp and σp.^
2 - 20
Portfolio Return, rp
rp is a weighted average:
rp = 0.5(17.4%) + 0.5(1.7%) = 9.6%.
rp is between rAlta and rRepo.
^
^
^
^
^ ^
^ ^
rp = Σ wiri.
n
i = 1
2 - 21
Alternative Method
rp = (3.0%)0.10 + (6.4%)0.20 + (10.0%)0.40
+ (12.5%)0.20 + (15.0%)0.10 = 9.6%.
^
Estimated Return
(More...)
Economy Prob. Alta Repo Port.
Recession 0.10 -22.0% 28.0% 3.0%
Below avg. 0.20 -2.0 14.7 6.4
Average 0.40 20.0 0.0 10.0
Above avg. 0.20 35.0 -10.0 12.5
Boom 0.10 50.0 -20.0 15.0
2 - 22
σp = ((3.0 - 9.6)2
0.10 + (6.4 - 9.6)2
0.20 +
(10.0 - 9.6)2
0.40 + (12.5 - 9.6)2
0.20
+ (15.0 - 9.6)2
0.10)1/2
= 3.3%.
σp is much lower than:
either stock (20% and 13.4%).
average of Alta and Repo (16.7%).
The portfolio provides average return
but much lower risk. The key here is
negative correlation.
2 - 23
Two-Stock Portfolios
Two stocks can be combined to form
a riskless portfolio if ρ = -1.0.
Risk is not reduced at all if the two
stocks have ρ = +1.0.
In general, stocks have ρ ≈ 0.65, so
risk is lowered but not eliminated.
Investors typically hold many stocks.
What happens when ρ = 0?
2 - 24
What would happen to the
risk of an average 1-stock
portfolio as more randomly
selected stocks were added?
σp would decrease because the added
stocks would not be perfectly correlated,
but rp would remain relatively constant.
^
2 - 25
Large
0 15
Prob.
2
1
σ1 ≈ 35% ; σLarge ≈ 20%.
Return
2 - 26
# Stocks in Portfolio
10 20 30 40 2,000+
Company Specific
(Diversifiable) Risk
Market Risk
20
0
Stand-Alone Risk, σp
σp (%)
35
2 - 27
Stand-alone Market Diversifiable
Market risk is that part of a security’s
stand-alone risk that cannot be
eliminated by diversification.
Firm-specific, or diversifiable, risk is
that part of a security’s stand-alone
risk that can be eliminated by
diversification.
risk risk risk= + .
2 - 28
Conclusions
As more stocks are added, each new
stock has a smaller risk-reducing
impact on the portfolio.
σp falls very slowly after about 40
stocks are included. The lower limit
for σp is about 20% = σM .
By forming well-diversified
portfolios, investors can eliminate
about half the riskiness of owning a
single stock.
2 - 29
No. Rational investors will minimize
risk by holding portfolios.
They bear only market risk, so prices
and returns reflect this lower risk.
The one-stock investor bears higher
(stand-alone) risk, so the return is less
than that required by the risk.
Can an investor holding one stock earn
a return commensurate with its risk?
2 - 30
Market risk, which is relevant for stocks
held in well-diversified portfolios, is
defined as the contribution of a security
to the overall riskiness of the portfolio.
It is measured by a stock’s beta
coefficient. For stock i, its beta is:
bi = (ρiM σi) / σM
How is market risk measured for
individual securities?
2 - 31
How are betas calculated?
In addition to measuring a stock’s
contribution of risk to a portfolio,
beta also which measures the
stock’s volatility relative to the
market.
2 - 32
Using a Regression to Estimate Beta
Run a regression with returns on
the stock in question plotted on
the Y axis and returns on the
market portfolio plotted on the X
axis.
The slope of the regression line,
which measures relative volatility,
is defined as the stock’s beta
coefficient, or b.
2 - 33
Use the historical stock returns to
calculate the beta for PQU.
Year Market PQU
1 25.7% 40.0%
2 8.0% -15.0%
3 -11.0% -15.0%
4 15.0% 35.0%
5 32.5% 10.0%
6 13.7% 30.0%
7 40.0% 42.0%
8 10.0% -10.0%
9 -10.8% -25.0%
10 -13.1% 25.0%
2 - 34
Calculating Beta for PQU
r PQU = 0.83r M + 0.03
R
2
= 0.36
-40%
-20%
0%
20%
40%
-40% -20% 0% 20% 40%
r M
r KWE
2 - 35
What is beta for PQU?
The regression line, and hence
beta, can be found using a
calculator with a regression
function or a spreadsheet program.
In this example, b = 0.83.
2 - 36
Calculating Beta in Practice
Many analysts use the S&P 500 to
find the market return.
Analysts typically use four or five
years’ of monthly returns to
establish the regression line.
 Some analysts use 52 weeks of
weekly returns.
2 - 37
If b = 1.0, stock has average risk.
If b > 1.0, stock is riskier than average.
If b < 1.0, stock is less risky than
average.
Most stocks have betas in the range of
0.5 to 1.5.
Can a stock have a negative beta?
How is beta interpreted?
2 - 38
Finding Beta Estimates on the Web
Go to www.thomsonfn.com.
Enter the ticker symbol for a
“Stock Quote”, such as IBM
or Dell, then click GO.
When the quote comes up,
select Company Earnings,
then GO.
2 - 39
Expected Return versus Market Risk
 Which of the alternatives is best?
Expected
Security return Risk, b
HT 17.4% 1.29
Market 15.0 1.00
USR 13.8 0.68
T-bills 8.0 0.00
Collections 1.7 -0.86
2 - 40
Use the SML to calculate each
alternative’s required return.
The Security Market Line (SML) is
part of the Capital Asset Pricing
Model (CAPM).
SML: ri = rRF + (RPM)bi .
Assume rRF = 8%; rM = rM = 15%.
RPM = (rM - rRF) = 15% - 8% = 7%.
^
2 - 41
Required Rates of Return
rAlta = 8.0% + (7%)(1.29)
= 8.0% + 9.0% = 17.0%.
rM = 8.0% + (7%)(1.00) = 15.0%.
rAm. F. = 8.0% + (7%)(0.68) = 12.8%.
rT-bill = 8.0% + (7%)(0.00) = 8.0%.
rRepo = 8.0% + (7%)(-0.86) = 2.0%.
2 - 42
Expected versus Required Returns
^r r
Alta 17.4% 17.0% Undervalued
Market 15.0 15.0 Fairly valued
Am. F. 13.8 12.8 Undervalued
T-bills 8.0 8.0 Fairly valued
Repo 1.7 2.0 Overvalued
2 - 43
.
.Repo
.Alta
T-bills
.
Am. Foam
rM = 15
rRF = 8
-1 0 1 2
.
SML: ri = rRF + (RPM) bi
ri = 8%+ (7%) bi
ri (%)
Risk, bi
SML and Investment Alternatives
Market
2 - 44
Calculate beta for a portfolio with 50%
Alta and 50% Repo
bp = Weighted average
= 0.5(bAlta) + 0.5(bRepo)
= 0.5(1.29) + 0.5(-0.86)
= 0.22.
2 - 45
What is the required rate of return
on the Alta/Repo portfolio?
rp = Weighted average r
= 0.5(17%) + 0.5(2%) = 9.5%.
Or use SML:
rp = rRF + (RPM) bp
= 8.0% + 7%(0.22) = 9.5%.
2 - 46
SML1
Original situation
Required Rate
of Return r (%)
SML2
0 0.5 1.0 1.5 2.0
18
15
11
8
New SML
∆ I = 3%
Impact of Inflation Change on SML
2 - 47
rM = 18%
rM = 15%
SML1
Original situation
Required Rate
of Return (%)
SML2
After increase
in risk aversion
Risk, bi
18
15
8
1.0
∆ RPM = 3%
Impact of Risk Aversion Change
2 - 48
Has the CAPM been completely confirmed
or refuted through empirical tests?
No. The statistical tests have
problems that make empirical
verification or rejection virtually
impossible.
Investors’ required returns are
based on future risk, but betas are
calculated with historical data.
Investors may be concerned about
both stand-alone and market risk.

Bab 2 risk and return part i

  • 1.
    2 - 1 CHAPTER2 Risk and Return: Part I Basic return concepts Basic risk concepts Stand-alone risk Portfolio (market) risk Risk and return: CAPM/SML
  • 2.
    2 - 2 Whatare investment returns? Investment returns measure the financial results of an investment. Returns may be historical or prospective (anticipated). Returns can be expressed in: Dollar terms. Percentage terms.
  • 3.
    2 - 3 Whatis the return on an investment that costs $1,000 and is sold after 1 year for $1,100? Dollar return: Percentage return: $ Received - $ Invested $1,100 - $1,000 = $100. $ Return/$ Invested $100/$1,000 = 0.10 = 10%.
  • 4.
    2 - 4 Whatis investment risk? Typically, investment returns are not known with certainty. Investment risk pertains to the probability of earning a return less than that expected. The greater the chance of a return far below the expected return, the greater the risk.
  • 5.
    2 - 5 Probabilitydistribution Rate of return (%)50150-20 Stock X Stock Y  Which stock is riskier? Why?
  • 6.
    2 - 6 Assumethe Following Investment Alternatives Economy Prob. T-Bill Alta Repo Am F. MP Recession 0.10 8.0% -22.0% 28.0% 10.0% -13.0% Below avg. 0.20 8.0 -2.0 14.7 -10.0 1.0 Average 0.40 8.0 20.0 0.0 7.0 15.0 Above avg. 0.20 8.0 35.0 -10.0 45.0 29.0 Boom 0.10 8.0 50.0 -20.0 30.0 43.0 1.00
  • 7.
    2 - 7 Whatis unique about the T-bill return? The T-bill will return 8% regardless of the state of the economy. Is the T-bill riskless? Explain.
  • 8.
    2 - 8 Dothe returns of Alta Inds. and Repo Men move with or counter to the economy?  Alta Inds. moves with the economy, so it is positively correlated with the economy. This is the typical situation.  Repo Men moves counter to the economy. Such negative correlation is unusual.
  • 9.
    2 - 9 Calculatethe expected rate of return on each alternative. .∑ ∧ n 1=i iiPr=r r = expected rate of return. rAlta = 0.10(-22%) + 0.20(-2%) + 0.40(20%) + 0.20(35%) + 0.10(50%) = 17.4%. ^ ^
  • 10.
    2 - 10 Alta has the highest rate of return.  Does that make it best? r Alta 17.4% Market 15.0 Am. Foam 13.8 T-bill 8.0 Repo Men 1.7 ^
  • 11.
    2 - 11 Whatis the standard deviation of returns for each alternative? . Variance deviationStandard 1 2 2 ∑= ∧       −= == = n i ii Prr σσ σ
  • 12.
    2 - 12 σT-bills= 0.0%. σAlta = 20.0%. σRepo = 13.4%. σAm Foam = 18.8%. σMarket = 15.3%. . 1 2 ∑= ∧       −= n i ii Prrσ Alta Inds: σ = ((-22 - 17.4)2 0.10 + (-2 - 17.4)2 0.20 + (20 - 17.4)2 0.40 + (35 - 17.4)2 0.20 + (50 - 17.4)2 0.10)1/2 = 20.0%.
  • 13.
    2 - 13 Prob. Rateof Return (%) T-bill Am. F. Alta 0 8 13.8 17.4
  • 14.
    2 - 14 Standarddeviation measures the stand-alone risk of an investment. The larger the standard deviation, the higher the probability that returns will be far below the expected return. Coefficient of variation is an alternative measure of stand-alone risk.
  • 15.
    2 - 15 ExpectedReturn versus Risk Expected Security return Risk, σ Alta Inds. 17.4% 20.0% Market 15.0 15.3 Am. Foam 13.8 18.8 T-bills 8.0 0.0 Repo Men 1.7 13.4
  • 16.
    2 - 16 Coefficientof Variation: CV = Standard deviation/Expected return CVT-BILLS = 0.0%/8.0% = 0.0. CVAlta Inds = 20.0%/17.4% = 1.1. CVRepo Men = 13.4%/1.7% = 7.9. CVAm. Foam = 18.8%/13.8% = 1.4. CVM = 15.3%/15.0% = 1.0.
  • 17.
    2 - 17 ExpectedReturn versus Coefficient of Variation Expecte d Risk: Risk : Security return σ CV Alta Inds 17.4% 20.0% 1.1 Market 15.0 15.3 1.0 Am. Foam 13.8 18.8 1.4 T-bills 8.0 0.0 0.0 Repo Men 1.7 13.4 7.9
  • 18.
    2 - 18 T-bills Coll. Mkt USR Alta 0.0% 2.0% 4.0% 6.0% 8.0% 10.0% 12.0% 14.0% 16.0% 18.0% 20.0% 0.0%5.0% 10.0% 15.0% 20.0% 25.0% Risk (Std. Dev.) Return Return vs. Risk (Std. Dev.): Which investment is best?
  • 19.
    2 - 19 PortfolioRisk and Return Assume a two-stock portfolio with $50,000 in Alta Inds. and $50,000 in Repo Men. Calculate rp and σp.^
  • 20.
    2 - 20 PortfolioReturn, rp rp is a weighted average: rp = 0.5(17.4%) + 0.5(1.7%) = 9.6%. rp is between rAlta and rRepo. ^ ^ ^ ^ ^ ^ ^ ^ rp = Σ wiri. n i = 1
  • 21.
    2 - 21 AlternativeMethod rp = (3.0%)0.10 + (6.4%)0.20 + (10.0%)0.40 + (12.5%)0.20 + (15.0%)0.10 = 9.6%. ^ Estimated Return (More...) Economy Prob. Alta Repo Port. Recession 0.10 -22.0% 28.0% 3.0% Below avg. 0.20 -2.0 14.7 6.4 Average 0.40 20.0 0.0 10.0 Above avg. 0.20 35.0 -10.0 12.5 Boom 0.10 50.0 -20.0 15.0
  • 22.
    2 - 22 σp= ((3.0 - 9.6)2 0.10 + (6.4 - 9.6)2 0.20 + (10.0 - 9.6)2 0.40 + (12.5 - 9.6)2 0.20 + (15.0 - 9.6)2 0.10)1/2 = 3.3%. σp is much lower than: either stock (20% and 13.4%). average of Alta and Repo (16.7%). The portfolio provides average return but much lower risk. The key here is negative correlation.
  • 23.
    2 - 23 Two-StockPortfolios Two stocks can be combined to form a riskless portfolio if ρ = -1.0. Risk is not reduced at all if the two stocks have ρ = +1.0. In general, stocks have ρ ≈ 0.65, so risk is lowered but not eliminated. Investors typically hold many stocks. What happens when ρ = 0?
  • 24.
    2 - 24 Whatwould happen to the risk of an average 1-stock portfolio as more randomly selected stocks were added? σp would decrease because the added stocks would not be perfectly correlated, but rp would remain relatively constant. ^
  • 25.
    2 - 25 Large 015 Prob. 2 1 σ1 ≈ 35% ; σLarge ≈ 20%. Return
  • 26.
    2 - 26 #Stocks in Portfolio 10 20 30 40 2,000+ Company Specific (Diversifiable) Risk Market Risk 20 0 Stand-Alone Risk, σp σp (%) 35
  • 27.
    2 - 27 Stand-aloneMarket Diversifiable Market risk is that part of a security’s stand-alone risk that cannot be eliminated by diversification. Firm-specific, or diversifiable, risk is that part of a security’s stand-alone risk that can be eliminated by diversification. risk risk risk= + .
  • 28.
    2 - 28 Conclusions Asmore stocks are added, each new stock has a smaller risk-reducing impact on the portfolio. σp falls very slowly after about 40 stocks are included. The lower limit for σp is about 20% = σM . By forming well-diversified portfolios, investors can eliminate about half the riskiness of owning a single stock.
  • 29.
    2 - 29 No.Rational investors will minimize risk by holding portfolios. They bear only market risk, so prices and returns reflect this lower risk. The one-stock investor bears higher (stand-alone) risk, so the return is less than that required by the risk. Can an investor holding one stock earn a return commensurate with its risk?
  • 30.
    2 - 30 Marketrisk, which is relevant for stocks held in well-diversified portfolios, is defined as the contribution of a security to the overall riskiness of the portfolio. It is measured by a stock’s beta coefficient. For stock i, its beta is: bi = (ρiM σi) / σM How is market risk measured for individual securities?
  • 31.
    2 - 31 Howare betas calculated? In addition to measuring a stock’s contribution of risk to a portfolio, beta also which measures the stock’s volatility relative to the market.
  • 32.
    2 - 32 Usinga Regression to Estimate Beta Run a regression with returns on the stock in question plotted on the Y axis and returns on the market portfolio plotted on the X axis. The slope of the regression line, which measures relative volatility, is defined as the stock’s beta coefficient, or b.
  • 33.
    2 - 33 Usethe historical stock returns to calculate the beta for PQU. Year Market PQU 1 25.7% 40.0% 2 8.0% -15.0% 3 -11.0% -15.0% 4 15.0% 35.0% 5 32.5% 10.0% 6 13.7% 30.0% 7 40.0% 42.0% 8 10.0% -10.0% 9 -10.8% -25.0% 10 -13.1% 25.0%
  • 34.
    2 - 34 CalculatingBeta for PQU r PQU = 0.83r M + 0.03 R 2 = 0.36 -40% -20% 0% 20% 40% -40% -20% 0% 20% 40% r M r KWE
  • 35.
    2 - 35 Whatis beta for PQU? The regression line, and hence beta, can be found using a calculator with a regression function or a spreadsheet program. In this example, b = 0.83.
  • 36.
    2 - 36 CalculatingBeta in Practice Many analysts use the S&P 500 to find the market return. Analysts typically use four or five years’ of monthly returns to establish the regression line.  Some analysts use 52 weeks of weekly returns.
  • 37.
    2 - 37 Ifb = 1.0, stock has average risk. If b > 1.0, stock is riskier than average. If b < 1.0, stock is less risky than average. Most stocks have betas in the range of 0.5 to 1.5. Can a stock have a negative beta? How is beta interpreted?
  • 38.
    2 - 38 FindingBeta Estimates on the Web Go to www.thomsonfn.com. Enter the ticker symbol for a “Stock Quote”, such as IBM or Dell, then click GO. When the quote comes up, select Company Earnings, then GO.
  • 39.
    2 - 39 ExpectedReturn versus Market Risk  Which of the alternatives is best? Expected Security return Risk, b HT 17.4% 1.29 Market 15.0 1.00 USR 13.8 0.68 T-bills 8.0 0.00 Collections 1.7 -0.86
  • 40.
    2 - 40 Usethe SML to calculate each alternative’s required return. The Security Market Line (SML) is part of the Capital Asset Pricing Model (CAPM). SML: ri = rRF + (RPM)bi . Assume rRF = 8%; rM = rM = 15%. RPM = (rM - rRF) = 15% - 8% = 7%. ^
  • 41.
    2 - 41 RequiredRates of Return rAlta = 8.0% + (7%)(1.29) = 8.0% + 9.0% = 17.0%. rM = 8.0% + (7%)(1.00) = 15.0%. rAm. F. = 8.0% + (7%)(0.68) = 12.8%. rT-bill = 8.0% + (7%)(0.00) = 8.0%. rRepo = 8.0% + (7%)(-0.86) = 2.0%.
  • 42.
    2 - 42 Expectedversus Required Returns ^r r Alta 17.4% 17.0% Undervalued Market 15.0 15.0 Fairly valued Am. F. 13.8 12.8 Undervalued T-bills 8.0 8.0 Fairly valued Repo 1.7 2.0 Overvalued
  • 43.
    2 - 43 . .Repo .Alta T-bills . Am.Foam rM = 15 rRF = 8 -1 0 1 2 . SML: ri = rRF + (RPM) bi ri = 8%+ (7%) bi ri (%) Risk, bi SML and Investment Alternatives Market
  • 44.
    2 - 44 Calculatebeta for a portfolio with 50% Alta and 50% Repo bp = Weighted average = 0.5(bAlta) + 0.5(bRepo) = 0.5(1.29) + 0.5(-0.86) = 0.22.
  • 45.
    2 - 45 Whatis the required rate of return on the Alta/Repo portfolio? rp = Weighted average r = 0.5(17%) + 0.5(2%) = 9.5%. Or use SML: rp = rRF + (RPM) bp = 8.0% + 7%(0.22) = 9.5%.
  • 46.
    2 - 46 SML1 Originalsituation Required Rate of Return r (%) SML2 0 0.5 1.0 1.5 2.0 18 15 11 8 New SML ∆ I = 3% Impact of Inflation Change on SML
  • 47.
    2 - 47 rM= 18% rM = 15% SML1 Original situation Required Rate of Return (%) SML2 After increase in risk aversion Risk, bi 18 15 8 1.0 ∆ RPM = 3% Impact of Risk Aversion Change
  • 48.
    2 - 48 Hasthe CAPM been completely confirmed or refuted through empirical tests? No. The statistical tests have problems that make empirical verification or rejection virtually impossible. Investors’ required returns are based on future risk, but betas are calculated with historical data. Investors may be concerned about both stand-alone and market risk.