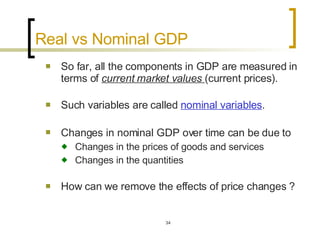
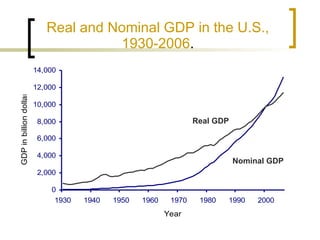
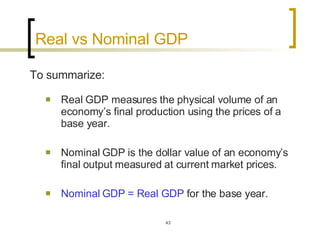
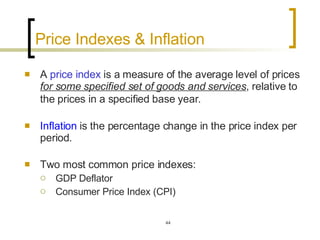
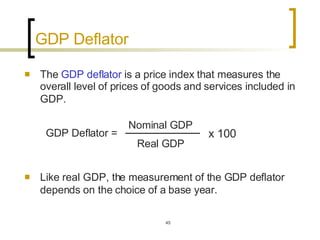
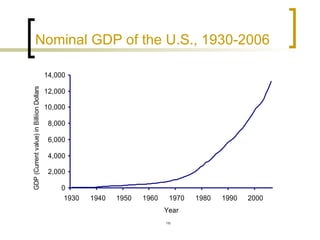
Chapter 2 The Measurement and Structure  of the National Economy
National Income Accounting National income accounts : an accounting framework used in measuring current economic activity.  These accounts are set up in a way that mirrors the structure of the economy, so they help us understand how the macroeconomy works.
How to measure economic activity ?   Producers Consumers $ Output Produced Incomes received Expenditures
How to measure economic activity ?   Product Approach :  measure the amount of  output produced , excluding output used up in intermediate stages of production.   Income Approach :  measure the  incomes received  by the producers of output. Expenditure Approach : measure the amount of  spending  by the ultimate purchasers of output.
How to measure economic activity ?   In principle, the 3 approaches should yield the same measurement of current economic activity. In practice, there might be some discrepancies due to incomplete or misreported data.
An Example   OrangeInc JuiceInc Consumers $ orange orange $ juice
An Example   OrangeInc Transactions Wage bill    $15,000 Tax payment  $ 5,000 Revenue Orange sold to public  $10,000 Orange sold to JuiceInc  $ 25,000 Total  $ 35,000 JuiceInc Transactions Wage bill  $ 10,000 Tax payment  $ 2,000 Oranges purchased from OrangeInc  $ 25,000 Revenue  $ 40,000
An Example :  Income Approach The income approach measures economic activity by adding all income generated by production, including  wages received by workers  (after-tax) profits received by owners of firms tax revenues received by the government
An Example: Income Approach   OrangeInc Transactions Wage bill    $15,000 Tax payment  $ 5,000 Revenue Orange sold to public  $10,000 Orange sold to JuiceInc  $ 25,000 Total  $ 35,000 Profits = Revenue - wage - tax  = $ 35,000 - $15,000 - $5,000 = $ 15,000  JuiceInc Transactions Wage bill  $ 10,000 Tax payment  $ 2,000 Oranges purchased from OrangeInc  $ 25,000 Revenue  $ 40,000 Profits = Revenue – wage – inputs - tax = $ 3,000
An Example :  Income Approach Total Income: Profits for OrangeInc  $ 15,000 Profits for JuiceInc  $ 3,000 Wage received by  OrangeInc Employees  $ 15,000 Wage received by  JuiceInc Employees  $ 10,000 Taxes from OrangeInc  $ 5,000 Taxes from JuiceInc  $ 2,000 Total  $ 50,000
An Example: Expenditure Approach The expenditure approach measures activity by adding the amount spent by all  ultimate users  of output.   In this example, the ultimate users are the consumers. Total Expenditures Buy oranges from OrangeInc  $ 10,000 Buy juices from JuiceInc  $ 40,000 Total  $ 50,000
An Example :  Product Approach The product approach measures the amount of output produced, excluding output used up in intermediate stages of production.  Q: In this example, is this the same as adding up the revenues of the OrangeInc and JuiceInc ?  A: NO.
An Example :  Product Approach For JuiceInc,   Revenue / Output $40,000 Oranges $25,000 Value-added $15,000
An Example :  Product Approach The  value added  of any producer is the value of its output minus the value of the inputs it purchases from other producers ( intermediate goods ).  The product approach computes economic activity by summing the value added by all producers.
An Example: Product Approach   OrangeInc Transactions Wage bill    $15,000 Tax payment  $ 5,000 Revenue Orange sold to public  $10,000 Orange sold to JuiceInc  $ 25,000 Total  $ 35,000 Value-added  $ 35,000 JuiceInc Transactions Wage bill  $ 10,000 Tax payment  $ 2,000 Oranges purchased from OrangeInc  $ 25,000 Revenue  $ 40,000 Value-added   $40,000-$25,000 =  $15,000 Total value added = $50,000
Gross Domestic Product (GDP) GDP is the most commonly used measure of aggregate economic activity.  GDP data can be obtained from the following website:  http:// www.bea.gov/national/index.htm#gdp
Nominal GDP of the U.S., 1930-2006
GDP: Income Approach The  income approach  calculates GDP by adding the incomes received by producers, including profits, and taxes paid to the government.  8 categories of income
GDP: Income Approach Compensation of employees  is the  before-tax  income of workers (excluding the self-employed).  [57% of GDP in 2005.] Corporate Profits  represent the remainder of the corporate revenue after wages, interest, rents and other costs have been paid but before taxes have been paid.  [10.8% of GDP in 2005.] Proprietor’s income  is the income of the non-incorporated self-employed.  [7.5% of GDP in 2005.]
GDP: Income Approach Taxes on production and imports  include indirect business taxes (such as sales taxes) as well as custom duties and taxes on residential real estate.  [6.8% of GDP in 2005.] Net interest  is interest earned by individuals from businesses and foreign sources minus interest paid by individuals.  [4.0% of GDP in 2005.]
GDP: Income Approach Rental income of persons Business current transfer payments Current surplus of government enterprises.   (See Chapter 2 for details)
GDP: Expenditure Approach The expenditure approach measures GDP as total spending on final goods and services  produced within a nation  during a specified period of time.  4 major categories of spending:  Consumption (C) Investment (I) Government purchases of goods and services (G) Net exports (NX) Income-expenditure identity: Y = C + I + G + NX
Table 2.1  Expenditure Approach to Measuring GDP in the United States, 2005
GDP: Expenditure Approach Consumption:  spending by  domestic households  on  final goods and services , including those produced abroad (i.e. imports).  3 categories of consumption spending: Consumer durables , e.g. cars, DVD players, ipod. Nondurable goods , e.g. food, clothing. Services , e.g. education, health care, transportation.
GDP: Expenditure Approach Q: In the definition, you said we only count the spending on final goods and services  produced within a nation . But now you said we also include  imports  in the consumption component. A: We include imports in  Consumption (C)  but we take these out in  Net Exports (NX).  So imports are cancelled out in C + NX.
GDP: Expenditure Approach Domestic Producers Foreign Producers Domestic Households Foreign Households (1) (2) (3) (4) Import = (2) Export = (3) Consumption (C) = (1) + (2) Net Export  (NX) = (3) – (2) C + NX  = (1) + (3)
GDP: Expenditure Approach Investment:   Fixed investment:  spending for new capital goods Business fixed investment :  spending by businesses on structures, equipment and software etc.. Residential investment : spending on the construction of new houses and apartment buildings. How about investment made by the government ? Inventory investment:  increases in firm’s inventory holdings.
GDP: Expenditure Approach Government purchases of goods and services : any expenditure by the government for a currently produced good or service, foreign or domestic.  Not all government spending is included in here Transfers  (such as Social Security and Medicare benefits, welfare payments) are excluded.  Interest payments on the national debt are also excluded.
GDP: Product Approach Product Approach : The product approach defines a nation’s GDP as the  market value  of  final goods and services   newly produced  within a nation during a fixed period to time.
GDP: Product Approach Market value (or current value):  the value of goods and services at the prices at which they are sold ( market prices ).  If we think of market-determined prices as measures of  relative economic values , then using market value to measure production will take into account differences in the relative economic importance of different items.
GDP: Product Approach Market value: Q: What if some commodities are not sold in formal markets ? A: They are either not included or only partially included in GDP. Examples:   Child care performed within the family without pay.  Activities that improve the environment. Activities in the underground economy.
GDP: Product Approach Final goods and services:  Intermediate goods  are those  used up  in the production of other goods in the  same period  that they themselves were produced.  Capital good : good that is itself produced, used to produce other goods but is not used up in the same period that it is produced. Examples: buildings, machinery, software.  Capital goods are classified as final goods in the national income accounts.
GDP: Product Approach Final goods and services:  Inventories  are stock of unsold finished goods and raw materials held by firms.  Inventory investment is the amount by which inventories increase during the year.  Inventory investment is treated as final good.
GDP: Product Approach Q: Which of the following is included in the GDP of 2006 ? The sale of a car produced in 2006. The sale of a used car in 2006. The sale of an unused car from a  manufacturer’s inventory.  The sale of a machine used to produce cars. Services provided by private day-care  center.  YES NO NO YES YES
Real vs Nominal GDP  So far, all the components in GDP are measured in terms of  current market values  (current prices). Such variables are called  nominal variables . Changes in nominal GDP over time can be due to   Changes in the prices of goods and services Changes in the quantities  How can we remove the effects of price changes ?
Real GDP: An Example 2005  2006 Quantity   Computers  5  10 Bicycles  200  250 Price Computers  $1,200@  $600@ Bicycles  $200@  $240@ Value Computers  5 x $1200 = $6,000  10 x $600 = $6,000 Bicycles  200 x $200 = $40,000  250 x $240 = $60,000 Nominal GDP  $6,000 + $40,000  $6,000 + $ 60,000 =  $46,000   =  $ 66,000
Real GDP: An Example Percentage change of Nominal GDP  from 2005 to 2006 New Value – Old Value  Old Value  $ 66,000 - $ 46,000 $ 46,000 =  43.5% x 100% = = x 100%
Real GDP & Price Indices To remove the effects of price changes: Pick one year as the  base year Calculate the value of production in each year by using the prices from the base year.
Real GDP: An Example 2005  (Base Year)   2006 Quantity   Computers  5  10 Bicycles  200  250 Price  Computers  $1,200@  $1,200@ Bicycles  $200@  $200@ Value Computers  5 x $1200 = $6,000  10 x  $1,200  = $12,000 Bicycles  200 x $200 = $40,000  250 x  $200  = $50,000 Real  GDP  $6,000 + $40,000  $12,000 + $ 50,000 =  $46,000   =  $ 62,000 (No change)
Real GDP: An Example 2005   2006  (Base Year)   Quantity   Computers  5  10 Bicycles  200  250 Price  Computers  $600@   $600@ Bicycles  $240@   $240@ Value Computers  5 x  $600  = $3,000  10 x $600 = $6,000 Bicycles  200 x  $240  = $48,000  250 x $240 = $60,000 Real  GDP  $3,000 + $48,000  $12,000 + $ 50,000 =  $51,000   =  $ 62,000 (No change)
Real GDP: An Example 2005   2006  % change Nominal GDP  $ 46,000  $ 66,000   43.5%   Real GDP  $ 46,000  $ 62,000  34.8% (Base year = 2005)   Real GDP  $ 51,000  $ 66,000  29.4% (Base year = 2006)
Real GDP: An Example % change of Nominal GDP =  43.5% % change of Real GDP using 2005 as base year  $ 62,000 - $ 46,000 $ 46,000 % change of Real GDP using 2006 as base year $ 66,000 - $ 51,000 $ 51,000 x 100%  =  34.8 % = = x 100%  =  29.4 %
Real and Nominal GDP in the U.S., 1930-2006 . Real GDP Nominal GDP
Real vs Nominal GDP  To summarize: Real GDP measures the physical volume of an economy’s final production using the prices of a base year.  Nominal GDP is the dollar value of an economy’s final output measured at current market prices.  Nominal GDP = Real GDP  for the base year.
Price Indexes & Inflation A  price index  is a measure of the average level of prices  for some specified set of goods and services , relative to the prices in a specified base year.   Inflation  is the percentage change in the price index per period.  Two most common price indexes: GDP Deflator Consumer Price Index (CPI)
GDP Deflator The  GDP deflator  is a price index that measures the overall level of prices of goods and services included in GDP.   Like real GDP, the measurement of the GDP deflator depends on the choice of a base year.   GDP Deflator = Nominal GDP Real GDP x 100
GDP Deflator: An Example 2005   2006  % change Nominal GDP  $ 46,000  $ 66,000   43.5%   Real GDP  $ 46,000  $ 62,000  34.8% (Base year = 2005)   GDP Deflator  100  106.5  6.5%   (Inflation)
Consumer Price Index (CPI)  CPI measures the prices of  consumer goods .  Every month the Bureau of Labor Statistics collect the current prices of a fixed basket of consumer goods an services such as food, housing and fuel.  The BLS also collects information on consumers’ expenditure patterns.  This information is used to weight the prices.
Consumer Price Index (CPI)  The CPI is intended to reflect the costs of living.  Many government payments and taxes are tied, or indexed, to the CPI. For example, social security benefits are raised every year by the same % as the CPI.  But there are reasons to believe that increases in the CPI  might overstate the actual rate at which the cost of living rises.
Consumer Price Index (CPI)  This can arise when the CPI fails to account for quality improvements in goods and services.  Example:  The processing speed of computer is increased by 10% and the price of computer increases accordingly.  The price increase should not be considered as an increase in the cost of living. If the BLS fail to account for the improved quality of computer but simply note the price increase, then the price change will be incorrectly interpreted as inflation.
Consumer Price Index (CPI)  Monthly data on the CPI can be obtained from the following website: http:// www.bls.gov
What we have learned in this chapter ?   The 3 approaches to measure economic activity, namely the product approach, the income approach and the expenditure approach.  How to use these approaches to measure GDP. Real vs Nominal GDP
Preparing for the Quiz Be familiar with the following concepts:  Product, income and expenditure approach Value added of producers Intermediate goods Capital goods Inventory and inventory investment Consumption, investment, government purchases and net export (GDP = C + I + G + NX) Market value of final goods and services Real and nominal variables Price index
Preparing for the Quiz Know the differences between Intermediate goods vs Capital goods GDP vs GNP GDP deflator vs Consumer Price Index Know how to compute Nominal GDP Real GDP GDP deflator % Changes in these variables

Chapter 2

  • 1.
    Chapter 2 TheMeasurement and Structure of the National Economy
  • 2.
    National Income AccountingNational income accounts : an accounting framework used in measuring current economic activity. These accounts are set up in a way that mirrors the structure of the economy, so they help us understand how the macroeconomy works.
  • 3.
    How to measureeconomic activity ? Producers Consumers $ Output Produced Incomes received Expenditures
  • 4.
    How to measureeconomic activity ? Product Approach : measure the amount of output produced , excluding output used up in intermediate stages of production. Income Approach : measure the incomes received by the producers of output. Expenditure Approach : measure the amount of spending by the ultimate purchasers of output.
  • 5.
    How to measureeconomic activity ? In principle, the 3 approaches should yield the same measurement of current economic activity. In practice, there might be some discrepancies due to incomplete or misreported data.
  • 6.
    An Example OrangeInc JuiceInc Consumers $ orange orange $ juice
  • 7.
    An Example OrangeInc Transactions Wage bill $15,000 Tax payment $ 5,000 Revenue Orange sold to public $10,000 Orange sold to JuiceInc $ 25,000 Total $ 35,000 JuiceInc Transactions Wage bill $ 10,000 Tax payment $ 2,000 Oranges purchased from OrangeInc $ 25,000 Revenue $ 40,000
  • 8.
    An Example : Income Approach The income approach measures economic activity by adding all income generated by production, including wages received by workers (after-tax) profits received by owners of firms tax revenues received by the government
  • 9.
    An Example: IncomeApproach OrangeInc Transactions Wage bill $15,000 Tax payment $ 5,000 Revenue Orange sold to public $10,000 Orange sold to JuiceInc $ 25,000 Total $ 35,000 Profits = Revenue - wage - tax = $ 35,000 - $15,000 - $5,000 = $ 15,000 JuiceInc Transactions Wage bill $ 10,000 Tax payment $ 2,000 Oranges purchased from OrangeInc $ 25,000 Revenue $ 40,000 Profits = Revenue – wage – inputs - tax = $ 3,000
  • 10.
    An Example : Income Approach Total Income: Profits for OrangeInc $ 15,000 Profits for JuiceInc $ 3,000 Wage received by OrangeInc Employees $ 15,000 Wage received by JuiceInc Employees $ 10,000 Taxes from OrangeInc $ 5,000 Taxes from JuiceInc $ 2,000 Total $ 50,000
  • 11.
    An Example: ExpenditureApproach The expenditure approach measures activity by adding the amount spent by all ultimate users of output. In this example, the ultimate users are the consumers. Total Expenditures Buy oranges from OrangeInc $ 10,000 Buy juices from JuiceInc $ 40,000 Total $ 50,000
  • 12.
    An Example : Product Approach The product approach measures the amount of output produced, excluding output used up in intermediate stages of production. Q: In this example, is this the same as adding up the revenues of the OrangeInc and JuiceInc ? A: NO.
  • 13.
    An Example : Product Approach For JuiceInc, Revenue / Output $40,000 Oranges $25,000 Value-added $15,000
  • 14.
    An Example : Product Approach The value added of any producer is the value of its output minus the value of the inputs it purchases from other producers ( intermediate goods ). The product approach computes economic activity by summing the value added by all producers.
  • 15.
    An Example: ProductApproach OrangeInc Transactions Wage bill $15,000 Tax payment $ 5,000 Revenue Orange sold to public $10,000 Orange sold to JuiceInc $ 25,000 Total $ 35,000 Value-added $ 35,000 JuiceInc Transactions Wage bill $ 10,000 Tax payment $ 2,000 Oranges purchased from OrangeInc $ 25,000 Revenue $ 40,000 Value-added $40,000-$25,000 = $15,000 Total value added = $50,000
  • 16.
    Gross Domestic Product(GDP) GDP is the most commonly used measure of aggregate economic activity. GDP data can be obtained from the following website: http:// www.bea.gov/national/index.htm#gdp
  • 17.
    Nominal GDP ofthe U.S., 1930-2006
  • 18.
    GDP: Income ApproachThe income approach calculates GDP by adding the incomes received by producers, including profits, and taxes paid to the government. 8 categories of income
  • 19.
    GDP: Income ApproachCompensation of employees is the before-tax income of workers (excluding the self-employed). [57% of GDP in 2005.] Corporate Profits represent the remainder of the corporate revenue after wages, interest, rents and other costs have been paid but before taxes have been paid. [10.8% of GDP in 2005.] Proprietor’s income is the income of the non-incorporated self-employed. [7.5% of GDP in 2005.]
  • 20.
    GDP: Income ApproachTaxes on production and imports include indirect business taxes (such as sales taxes) as well as custom duties and taxes on residential real estate. [6.8% of GDP in 2005.] Net interest is interest earned by individuals from businesses and foreign sources minus interest paid by individuals. [4.0% of GDP in 2005.]
  • 21.
    GDP: Income ApproachRental income of persons Business current transfer payments Current surplus of government enterprises. (See Chapter 2 for details)
  • 22.
    GDP: Expenditure ApproachThe expenditure approach measures GDP as total spending on final goods and services produced within a nation during a specified period of time. 4 major categories of spending: Consumption (C) Investment (I) Government purchases of goods and services (G) Net exports (NX) Income-expenditure identity: Y = C + I + G + NX
  • 23.
    Table 2.1 Expenditure Approach to Measuring GDP in the United States, 2005
  • 24.
    GDP: Expenditure ApproachConsumption: spending by domestic households on final goods and services , including those produced abroad (i.e. imports). 3 categories of consumption spending: Consumer durables , e.g. cars, DVD players, ipod. Nondurable goods , e.g. food, clothing. Services , e.g. education, health care, transportation.
  • 25.
    GDP: Expenditure ApproachQ: In the definition, you said we only count the spending on final goods and services produced within a nation . But now you said we also include imports in the consumption component. A: We include imports in Consumption (C) but we take these out in Net Exports (NX). So imports are cancelled out in C + NX.
  • 26.
    GDP: Expenditure ApproachDomestic Producers Foreign Producers Domestic Households Foreign Households (1) (2) (3) (4) Import = (2) Export = (3) Consumption (C) = (1) + (2) Net Export (NX) = (3) – (2) C + NX = (1) + (3)
  • 27.
    GDP: Expenditure ApproachInvestment: Fixed investment: spending for new capital goods Business fixed investment : spending by businesses on structures, equipment and software etc.. Residential investment : spending on the construction of new houses and apartment buildings. How about investment made by the government ? Inventory investment: increases in firm’s inventory holdings.
  • 28.
    GDP: Expenditure ApproachGovernment purchases of goods and services : any expenditure by the government for a currently produced good or service, foreign or domestic. Not all government spending is included in here Transfers (such as Social Security and Medicare benefits, welfare payments) are excluded. Interest payments on the national debt are also excluded.
  • 29.
    GDP: Product ApproachProduct Approach : The product approach defines a nation’s GDP as the market value of final goods and services newly produced within a nation during a fixed period to time.
  • 30.
    GDP: Product ApproachMarket value (or current value): the value of goods and services at the prices at which they are sold ( market prices ). If we think of market-determined prices as measures of relative economic values , then using market value to measure production will take into account differences in the relative economic importance of different items.
  • 31.
    GDP: Product ApproachMarket value: Q: What if some commodities are not sold in formal markets ? A: They are either not included or only partially included in GDP. Examples: Child care performed within the family without pay. Activities that improve the environment. Activities in the underground economy.
  • 32.
    GDP: Product ApproachFinal goods and services: Intermediate goods are those used up in the production of other goods in the same period that they themselves were produced. Capital good : good that is itself produced, used to produce other goods but is not used up in the same period that it is produced. Examples: buildings, machinery, software. Capital goods are classified as final goods in the national income accounts.
  • 33.
    GDP: Product ApproachFinal goods and services: Inventories are stock of unsold finished goods and raw materials held by firms. Inventory investment is the amount by which inventories increase during the year. Inventory investment is treated as final good.
  • 34.
    GDP: Product ApproachQ: Which of the following is included in the GDP of 2006 ? The sale of a car produced in 2006. The sale of a used car in 2006. The sale of an unused car from a manufacturer’s inventory. The sale of a machine used to produce cars. Services provided by private day-care center. YES NO NO YES YES
  • 35.
    Real vs NominalGDP So far, all the components in GDP are measured in terms of current market values (current prices). Such variables are called nominal variables . Changes in nominal GDP over time can be due to Changes in the prices of goods and services Changes in the quantities How can we remove the effects of price changes ?
  • 36.
    Real GDP: AnExample 2005 2006 Quantity Computers 5 10 Bicycles 200 250 Price Computers $1,200@ $600@ Bicycles $200@ $240@ Value Computers 5 x $1200 = $6,000 10 x $600 = $6,000 Bicycles 200 x $200 = $40,000 250 x $240 = $60,000 Nominal GDP $6,000 + $40,000 $6,000 + $ 60,000 = $46,000 = $ 66,000
  • 37.
    Real GDP: AnExample Percentage change of Nominal GDP from 2005 to 2006 New Value – Old Value Old Value $ 66,000 - $ 46,000 $ 46,000 = 43.5% x 100% = = x 100%
  • 38.
    Real GDP &Price Indices To remove the effects of price changes: Pick one year as the base year Calculate the value of production in each year by using the prices from the base year.
  • 39.
    Real GDP: AnExample 2005 (Base Year) 2006 Quantity Computers 5 10 Bicycles 200 250 Price Computers $1,200@ $1,200@ Bicycles $200@ $200@ Value Computers 5 x $1200 = $6,000 10 x $1,200 = $12,000 Bicycles 200 x $200 = $40,000 250 x $200 = $50,000 Real GDP $6,000 + $40,000 $12,000 + $ 50,000 = $46,000 = $ 62,000 (No change)
  • 40.
    Real GDP: AnExample 2005 2006 (Base Year) Quantity Computers 5 10 Bicycles 200 250 Price Computers $600@ $600@ Bicycles $240@ $240@ Value Computers 5 x $600 = $3,000 10 x $600 = $6,000 Bicycles 200 x $240 = $48,000 250 x $240 = $60,000 Real GDP $3,000 + $48,000 $12,000 + $ 50,000 = $51,000 = $ 62,000 (No change)
  • 41.
    Real GDP: AnExample 2005 2006 % change Nominal GDP $ 46,000 $ 66,000 43.5% Real GDP $ 46,000 $ 62,000 34.8% (Base year = 2005) Real GDP $ 51,000 $ 66,000 29.4% (Base year = 2006)
  • 42.
    Real GDP: AnExample % change of Nominal GDP = 43.5% % change of Real GDP using 2005 as base year $ 62,000 - $ 46,000 $ 46,000 % change of Real GDP using 2006 as base year $ 66,000 - $ 51,000 $ 51,000 x 100% = 34.8 % = = x 100% = 29.4 %
  • 43.
    Real and NominalGDP in the U.S., 1930-2006 . Real GDP Nominal GDP
  • 44.
    Real vs NominalGDP To summarize: Real GDP measures the physical volume of an economy’s final production using the prices of a base year. Nominal GDP is the dollar value of an economy’s final output measured at current market prices. Nominal GDP = Real GDP for the base year.
  • 45.
    Price Indexes &Inflation A price index is a measure of the average level of prices for some specified set of goods and services , relative to the prices in a specified base year. Inflation is the percentage change in the price index per period. Two most common price indexes: GDP Deflator Consumer Price Index (CPI)
  • 46.
    GDP Deflator The GDP deflator is a price index that measures the overall level of prices of goods and services included in GDP. Like real GDP, the measurement of the GDP deflator depends on the choice of a base year. GDP Deflator = Nominal GDP Real GDP x 100
  • 47.
    GDP Deflator: AnExample 2005 2006 % change Nominal GDP $ 46,000 $ 66,000 43.5% Real GDP $ 46,000 $ 62,000 34.8% (Base year = 2005) GDP Deflator 100 106.5 6.5% (Inflation)
  • 48.
    Consumer Price Index(CPI) CPI measures the prices of consumer goods . Every month the Bureau of Labor Statistics collect the current prices of a fixed basket of consumer goods an services such as food, housing and fuel. The BLS also collects information on consumers’ expenditure patterns. This information is used to weight the prices.
  • 49.
    Consumer Price Index(CPI) The CPI is intended to reflect the costs of living. Many government payments and taxes are tied, or indexed, to the CPI. For example, social security benefits are raised every year by the same % as the CPI. But there are reasons to believe that increases in the CPI might overstate the actual rate at which the cost of living rises.
  • 50.
    Consumer Price Index(CPI) This can arise when the CPI fails to account for quality improvements in goods and services. Example: The processing speed of computer is increased by 10% and the price of computer increases accordingly. The price increase should not be considered as an increase in the cost of living. If the BLS fail to account for the improved quality of computer but simply note the price increase, then the price change will be incorrectly interpreted as inflation.
  • 51.
    Consumer Price Index(CPI) Monthly data on the CPI can be obtained from the following website: http:// www.bls.gov
  • 52.
    What we havelearned in this chapter ? The 3 approaches to measure economic activity, namely the product approach, the income approach and the expenditure approach. How to use these approaches to measure GDP. Real vs Nominal GDP
  • 53.
    Preparing for theQuiz Be familiar with the following concepts: Product, income and expenditure approach Value added of producers Intermediate goods Capital goods Inventory and inventory investment Consumption, investment, government purchases and net export (GDP = C + I + G + NX) Market value of final goods and services Real and nominal variables Price index
  • 54.
    Preparing for theQuiz Know the differences between Intermediate goods vs Capital goods GDP vs GNP GDP deflator vs Consumer Price Index Know how to compute Nominal GDP Real GDP GDP deflator % Changes in these variables