Download to read offline

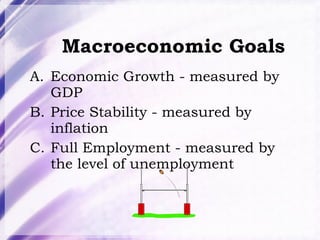
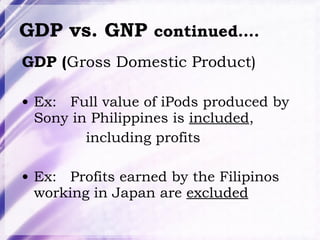
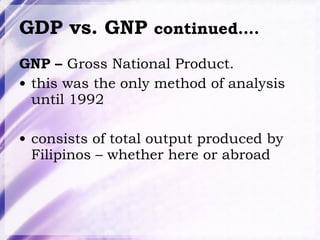


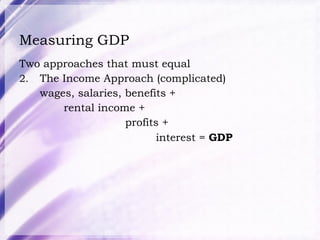
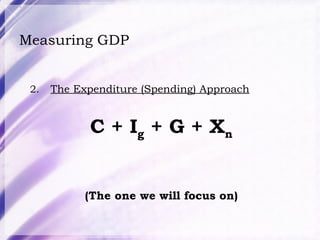
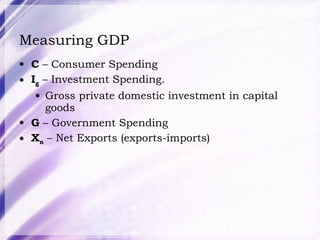
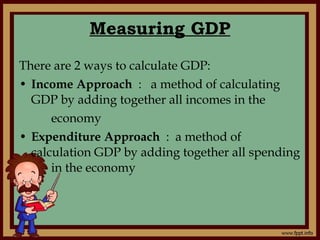
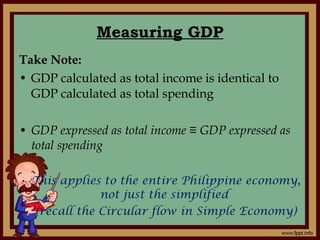
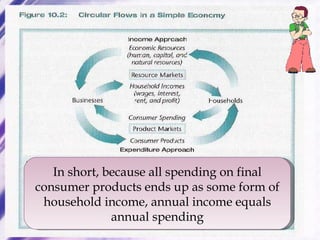
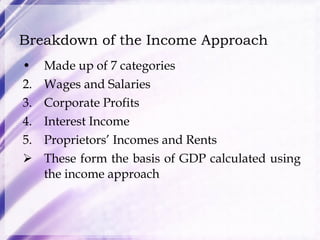


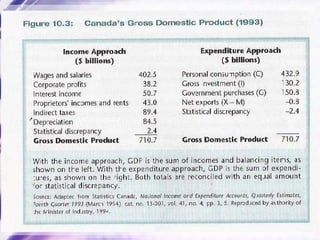


The document discusses key economic indicators used to measure economic performance, including GDP, GNP, and their components. It explains that GDP is the total value of goods and services produced domestically in a year, while GNP includes output produced by a country's citizens abroad. The main components of GDP are consumer spending, investment, government spending, and net exports. GDP can be calculated via the expenditure approach or income approach.


