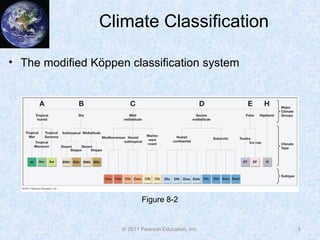
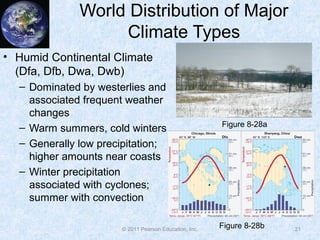
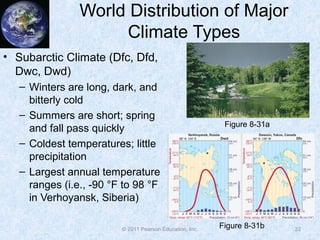
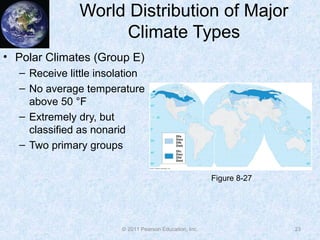
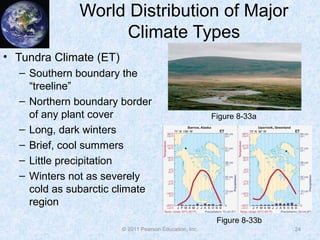
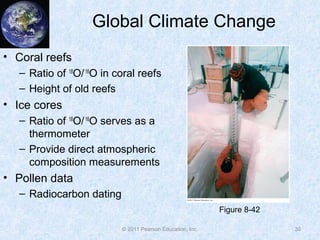
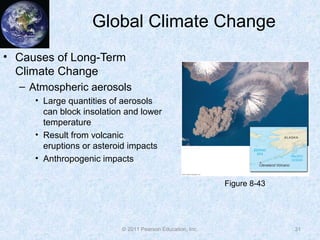
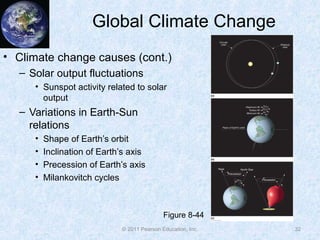
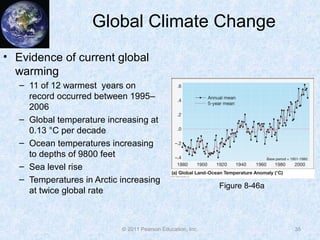
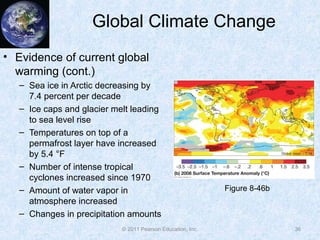
© 2011 Pearson Education, Inc.
Chapter 8: Climate and
Climate Change
McKnight’s Physical Geography:
A Landscape Appreciation,
Tenth Edition, Hess
© 2011 Pearson Education, Inc.
Climate and Climate Change
2
• Climate Classification
• World Distribution of Major Climate Types
• Global Patterns Idealized
• Global Climate Change
© 2011 Pearson Education, Inc.
Climate Classification
• Need a consistent climate
classification scheme to
understand numerous climate
regions
• Earliest known scheme was
by the ancient Greeks 2200
years ago
• Classified three major climate
regions
3
Figure 8-1
© 2011 Pearson Education, Inc.
Climate Classification
• Köppen climate classification system
• Based on a database of annual and monthly average
temperature and precipitation
• Four of five major groups classified by temperature
• Fifth group classified by precipitation
• Subdivided the five groups further based on
temperature and precipitation relationships
• Köppen letter code system
– Three letters; first describes group, second describes
precipitation, third describes temperature
• Climographs
4
© 2011 Pearson Education, Inc.
Climate Classification
5
Figure 8-2
• The modified Köppen classification system
© 2011 Pearson Education, Inc.
World Distribution of Major
Climate Types
6
Figure 8-11
• Weather records. How do we explain their locations?
© 2011 Pearson Education, Inc.
World Distribution of Major
Climate Types
• Tropical Humid Climates
(Group A—Figure 8-5)
– Molded by the tropical
latitudinal regions
– Winterless climates; little
temperature change
– Moisture is prevalent
– Precipitation influenced
by ITCZ
– Three subtypes
7
Figure 8-5
© 2011 Pearson Education, Inc.
World Distribution of Major
Climate Types
• Tropical wet climate (Af)
– Equatorial
– Monotonous climate
– Daily temperature range
exceeds annual range
– High humidity
– Rainfall multiple times a
day
– High solar angle year
round; ITCZ influences
rainfall
8
Figure 8-6b
Figure 8-6a
© 2011 Pearson Education, Inc.
World Distribution of Major
Climate Types
• Tropical savannah
climate (Aw)
– Lies north and south of
Af climates
– Seasonal alteration of
wet and dry periods due
to position changes of
ITCZ
– Smallest rainfall
amounts of tropical
regions
9
Figure 8-8b
Figure 8-8a
© 2011 Pearson Education, Inc.
World Distribution of Major
Climate Types
• Tropical monsoonal
climate (Am)
– Regions with prominent
monsoonal wind pattern
– Extensive rainfall during
high-Sun season
– Cherrapunji, India
averages 425 inches
– Cloud cover reduces
temperatures slightly in
summer versus spring
10
Figure 8-10b
Figure 8-10a
© 2011 Pearson Education, Inc.
World Distribution of Major
Climate Types
• Dry climates (Group B –
Figure 8-12)
– Cover about 30% of
land area worldwide
– Lack of uplift or lack of
moisture
– Typical in subtropics
– Marine deserts
– Two main types, two
subtypes
11
Figure 8-12
© 2011 Pearson Education, Inc.
World Distribution of Major
Climate Types
• Subtropical desert climate
(BWh)
– Lie near subtropical highs
– Precipitation is scarce
(rare) and unreliable
(highly variable)
– Precipitation that does
form is short lived and
intense
– Hot temperatures
– Large diurnal range of
temperature
12
Figure 8-14b
Figure 8-14a
© 2011 Pearson Education, Inc.
World Distribution of Major
Climate Types
• Subtropical steppe climate
(BSh)
– Typically surrounds BWh
climates
– Separate desert climate
from humid climate
– Extremes are muted in
steppe regions
• Cooler temperatures
• More rainfall
– Seasonal concentration
of rainfall
13
Figure 8-17
© 2011 Pearson Education, Inc.
World Distribution of Major
Climate Types
• Midlatitude desert climate
(BWk)
– Far removed from oceanic
influence
– Meager and erratic
precipitation
– Most precipitation occurs
in summer
– Cold winters, overall
cooler temperatures
– Greater annual
temperature range
14
Figure 8-18a
Figure 8-18b
© 2011 Pearson Education, Inc.
World Distribution of Major
Climate Types
• Midlatitude steppe climate
(BSk)
– Occupies transitions
between desert and
humid climates
– Greater precipitation than
midlatitude deserts
– Less temperature
extremes than midlatitude
deserts
15
Figure 8-19
© 2011 Pearson Education, Inc.
World Distribution of Major
Climate Types
• Mild Midlatitude Climates
(Group C—Figure 8-20
– Transition between
warmer tropical climates
and colder severe
midlatitude climates
– Hot summers, mild
winters
– Highly variable
precipitation amounts
– Three primary groups
16
Figure 8-20
© 2011 Pearson Education, Inc.
World Distribution of Major
Climate Types
• Mediterranean Climate
(Csa, Csb)
– Modest annual
precipitation in winter,
summer is virtually rainless
– Mild winters and hot
summers
– Clear skies especially in
summer
– Most is Csa (hot
summers); Csb climates
have mild summers and
are more coastal 17
Figure 8-21a
Figure 8-21b
© 2011 Pearson Education, Inc.
World Distribution of Major
Climate Types
• Humid Subtropical Climate
(Cfa, Cwa)
– Warm to hot summers;
high humidity (Cfa days are
hot and sultry)
– Precipitation reaches
summer maximum, some
drop off for winter
– Winter temperatures in Cfa
regions are mild; typically
cooler than mediterranean
climates
18
Figure 8-24a
Figure 8-24b
© 2011 Pearson Education, Inc.
World Distribution of Major
Climate Types
• Marine West Coast Climate
(Cfb, Cfc)
– Influenced by onshore flow
from midlatitude westerlies
– Occurs when no topographic
boundaries inhibit flow of
maritime air inland
– Frequently cloudy with
precipitation
– Temperate climate
– Wettest of the midlatitudes
19
Figure 8-26a
Figure 8-26b
© 2011 Pearson Education, Inc.
World Distribution of Major
Climate Types
• Severe Midlatitude
Climates (Group D)
– Only in Northern
Hemisphere
– Continentality—
remoteness from oceans
– Four recognizable
seasons; long, cold winter
and short summer
– Subdivided into two types
based on temperature
20
Figure 8-27
© 2011 Pearson Education, Inc.
World Distribution of Major
Climate Types
• Humid Continental Climate
(Dfa, Dfb, Dwa, Dwb)
– Dominated by westerlies and
associated frequent weather
changes
– Warm summers, cold winters
– Generally low precipitation;
higher amounts near coasts
– Winter precipitation
associated with cyclones;
summer with convection
21
Figure 8-28a
Figure 8-28b
© 2011 Pearson Education, Inc.
World Distribution of Major
Climate Types
• Subarctic Climate (Dfc, Dfd,
Dwc, Dwd)
– Winters are long, dark, and
bitterly cold
– Summers are short; spring
and fall pass quickly
– Coldest temperatures; little
precipitation
– Largest annual temperature
ranges (i.e., -90 °F to 98 °F
in Verhoyansk, Siberia)
22
Figure 8-31a
Figure 8-31b
© 2011 Pearson Education, Inc.
World Distribution of Major
Climate Types
• Polar Climates (Group E)
– Receive little insolation
– No average temperature
above 50 °F
– Extremely dry, but
classified as nonarid
– Two primary groups
23
Figure 8-27
© 2011 Pearson Education, Inc.
World Distribution of Major
Climate Types
• Tundra Climate (ET)
– Southern boundary the
“treeline”
– Northern boundary border
of any plant cover
– Long, dark winters
– Brief, cool summers
– Little precipitation
– Winters not as severely
cold as subarctic climate
region
24
Figure 8-33a
Figure 8-33b
© 2011 Pearson Education, Inc.
World Distribution of Major
Climate Types
• Ice Cap Climate (EF)
– Mainly Greenland and
most of Antarctica
– Permanent cover of ice
and snow
– Ice plateaus; high latitude
with high altitude
– Very limited precipitation,
essentially polar deserts
25
Figure 8-34a
Figure 8-34b
© 2011 Pearson Education, Inc.
World Distribution of Major
Climate Types
• Highland Climate
(Group H)
– Nearly infinite variations
from place to place
– Altitude more significant
than latitude in highlands
– Exposure (whether a
slope is windward or
leeward)
– High diurnal temperature
variations due to thin, dry
air
26
Figure 8-36
© 2011 Pearson Education, Inc.
Global Patterns Idealized
• Presumed arrangement of Köppen climate types on a
hypothetical continent (Figure 8-40)
27
Figure 8-40
© 2011 Pearson Education, Inc.
Global Climate Change
• Changes in climate on long time scales
• Weather is noise, climate is long-term signal
• Episodic events (i.e., El Niño and the PDO) versus
long-term global climate change
• Numerous time scales to consider (i.e., temperature)
– 70 million years, clear global cooling trend
– 150,000 years, temperature fluctuated
– 10,000 years, sharp warmup
– 150 years, warming trend relative to last 1000 years
28
© 2011 Pearson Education, Inc.
Global Climate Change
• Paleoclimatology
– Proxy measures of
climate (i.e., ice cores,
tree rings)
• Dendrochronology—
study of past climate
through tree ring analysis
• Oxygen isotope analysis
– Lighter versus heavier
isotopes
– High 18
O/16
O ratio,
glaciation
29
Figure 8-41
© 2011 Pearson Education, Inc.
Global Climate Change
• Coral reefs
– Ratio of 18
O/16
O in coral reefs
– Height of old reefs
• Ice cores
– Ratio of 18
O/16
O serves as a
thermometer
– Provide direct atmospheric
composition measurements
• Pollen data
– Radiocarbon dating
30
Figure 8-42
© 2011 Pearson Education, Inc.
Global Climate Change
• Causes of Long-Term
Climate Change
– Atmospheric aerosols
• Large quantities of aerosols
can block insolation and lower
temperature
• Result from volcanic
eruptions or asteroid impacts
• Anthropogenic impacts
31
Figure 8-43
© 2011 Pearson Education, Inc.
Global Climate Change
• Climate change causes (cont.)
– Solar output fluctuations
• Sunspot activity related to solar
output
– Variations in Earth-Sun
relations
• Shape of Earth’s orbit
• Inclination of Earth’s axis
• Precession of Earth’s axis
• Milankovitch cycles
32
Figure 8-44
© 2011 Pearson Education, Inc.
Global Climate Change
• Climate change causes (cont.)
– Greenhouse gas concentrations
• Greenhouse gas concentrations related to temperature
• Evidence of CO2 increase being anthropogenic
– Feedback mechanisms
• Positive feedback mechanisms
• Water vapor feedback challenges
33
© 2011 Pearson Education, Inc.
Global Climate Change
• Climate change causes (cont.)
– Roles of the oceans
• Absorb large amounts of carbon
• Methane hydrates
• Heat transfer from low latitudes
to high latitudes
• Climate models
– General circulation models
(GCMs)
– Numerous assumptions
– Accuracy of the models
34
Figure 8-45
© 2011 Pearson Education, Inc.
Global Climate Change
• Evidence of current global
warming
– 11 of 12 warmest years on
record occurred between 1995–
2006
– Global temperature increasing at
0.13 °C per decade
– Ocean temperatures increasing
to depths of 9800 feet
– Sea level rise
– Temperatures in Arctic increasing
at twice global rate
35
Figure 8-46a
© 2011 Pearson Education, Inc.
Global Climate Change
• Evidence of current global
warming (cont.)
– Sea ice in Arctic decreasing by
7.4 percent per decade
– Ice caps and glacier melt leading
to sea level rise
– Temperatures on top of a
permafrost layer have increased
by 5.4 °F
– Number of intense tropical
cyclones increased since 1970
– Amount of water vapor in
atmosphere increased
– Changes in precipitation amounts
36
Figure 8-46b
© 2011 Pearson Education, Inc.
Global Climate Change
• Evidence of current global warming (cont.)
– Concentrations of carbon dioxide correlated with temperature
– Carbon dioxide concentrations correlate with increased
anthropogenic greenhouse gases
– Carbon dioxide increasing at a rate faster than observed in last
800,000 years
37
© 2011 Pearson Education, Inc.
Global Climate Change
• Consequences of global
warming
– Projected climate in the
upcoming century
• Climate will warm at about 0.4 °F
per decade
• Changes will be greater than
those observed during 20th
century
• Estimated increase of
temperature from 3.3 °F to 7.2 °F
• Sea level rise
• Stronger tropical cyclones
• Increased precipitation
38
Figure 8-47a
© 2011 Pearson Education, Inc.
Global Climate Change
• Addressing global warming
– Kyoto protocol
– Standards for newly
industrialized countries
– Mitigating and adapting
39
Figure 8-47b
© 2011 Pearson Education, Inc.
Summary
• Climate is classified based on precipitation and
temperature
• There are six primary groups of world climates
• The tropical humid climates exist at tropical latitudes and
are characterized by warm, constant temperatures and
rainfall
• Dry climates exist near the subtropics and are
characterized by hot, dry conditions
• Mild midlatitude climates constitute a transition between
warmer tropical climates and cold severe midlatitude
climates
40
© 2011 Pearson Education, Inc.
Summary
• Mild midlatitude climates typically have long and hot
summers and mild winters, and have modest
precipitation
• Severe midlatitude climates only occur in the Northern
Hemisphere
• Severe midlatitude climates have long, cold winters and
short summers, and have large annual temperature
ranges
• Polar climates receive little insolation and are
permanently cold and dry
41
© 2011 Pearson Education, Inc.
Summary
• Highland climates depend on elevation of mountainous
terrain for their climate characteristics
• Many paleoclimatology methods are used to understand
the Earth’s past climate
• There are several factors that influence long-term
climate change
• Global warming is related to the increase in carbon
dioxide release by humans
42

Ch08

  • 1.
    © 2011 PearsonEducation, Inc. Chapter 8: Climate and Climate Change McKnight’s Physical Geography: A Landscape Appreciation, Tenth Edition, Hess
  • 2.
    © 2011 PearsonEducation, Inc. Climate and Climate Change 2 • Climate Classification • World Distribution of Major Climate Types • Global Patterns Idealized • Global Climate Change
  • 3.
    © 2011 PearsonEducation, Inc. Climate Classification • Need a consistent climate classification scheme to understand numerous climate regions • Earliest known scheme was by the ancient Greeks 2200 years ago • Classified three major climate regions 3 Figure 8-1
  • 4.
    © 2011 PearsonEducation, Inc. Climate Classification • Köppen climate classification system • Based on a database of annual and monthly average temperature and precipitation • Four of five major groups classified by temperature • Fifth group classified by precipitation • Subdivided the five groups further based on temperature and precipitation relationships • Köppen letter code system – Three letters; first describes group, second describes precipitation, third describes temperature • Climographs 4
  • 5.
    © 2011 PearsonEducation, Inc. Climate Classification 5 Figure 8-2 • The modified Köppen classification system
  • 6.
    © 2011 PearsonEducation, Inc. World Distribution of Major Climate Types 6 Figure 8-11 • Weather records. How do we explain their locations?
  • 7.
    © 2011 PearsonEducation, Inc. World Distribution of Major Climate Types • Tropical Humid Climates (Group A—Figure 8-5) – Molded by the tropical latitudinal regions – Winterless climates; little temperature change – Moisture is prevalent – Precipitation influenced by ITCZ – Three subtypes 7 Figure 8-5
  • 8.
    © 2011 PearsonEducation, Inc. World Distribution of Major Climate Types • Tropical wet climate (Af) – Equatorial – Monotonous climate – Daily temperature range exceeds annual range – High humidity – Rainfall multiple times a day – High solar angle year round; ITCZ influences rainfall 8 Figure 8-6b Figure 8-6a
  • 9.
    © 2011 PearsonEducation, Inc. World Distribution of Major Climate Types • Tropical savannah climate (Aw) – Lies north and south of Af climates – Seasonal alteration of wet and dry periods due to position changes of ITCZ – Smallest rainfall amounts of tropical regions 9 Figure 8-8b Figure 8-8a
  • 10.
    © 2011 PearsonEducation, Inc. World Distribution of Major Climate Types • Tropical monsoonal climate (Am) – Regions with prominent monsoonal wind pattern – Extensive rainfall during high-Sun season – Cherrapunji, India averages 425 inches – Cloud cover reduces temperatures slightly in summer versus spring 10 Figure 8-10b Figure 8-10a
  • 11.
    © 2011 PearsonEducation, Inc. World Distribution of Major Climate Types • Dry climates (Group B – Figure 8-12) – Cover about 30% of land area worldwide – Lack of uplift or lack of moisture – Typical in subtropics – Marine deserts – Two main types, two subtypes 11 Figure 8-12
  • 12.
    © 2011 PearsonEducation, Inc. World Distribution of Major Climate Types • Subtropical desert climate (BWh) – Lie near subtropical highs – Precipitation is scarce (rare) and unreliable (highly variable) – Precipitation that does form is short lived and intense – Hot temperatures – Large diurnal range of temperature 12 Figure 8-14b Figure 8-14a
  • 13.
    © 2011 PearsonEducation, Inc. World Distribution of Major Climate Types • Subtropical steppe climate (BSh) – Typically surrounds BWh climates – Separate desert climate from humid climate – Extremes are muted in steppe regions • Cooler temperatures • More rainfall – Seasonal concentration of rainfall 13 Figure 8-17
  • 14.
    © 2011 PearsonEducation, Inc. World Distribution of Major Climate Types • Midlatitude desert climate (BWk) – Far removed from oceanic influence – Meager and erratic precipitation – Most precipitation occurs in summer – Cold winters, overall cooler temperatures – Greater annual temperature range 14 Figure 8-18a Figure 8-18b
  • 15.
    © 2011 PearsonEducation, Inc. World Distribution of Major Climate Types • Midlatitude steppe climate (BSk) – Occupies transitions between desert and humid climates – Greater precipitation than midlatitude deserts – Less temperature extremes than midlatitude deserts 15 Figure 8-19
  • 16.
    © 2011 PearsonEducation, Inc. World Distribution of Major Climate Types • Mild Midlatitude Climates (Group C—Figure 8-20 – Transition between warmer tropical climates and colder severe midlatitude climates – Hot summers, mild winters – Highly variable precipitation amounts – Three primary groups 16 Figure 8-20
  • 17.
    © 2011 PearsonEducation, Inc. World Distribution of Major Climate Types • Mediterranean Climate (Csa, Csb) – Modest annual precipitation in winter, summer is virtually rainless – Mild winters and hot summers – Clear skies especially in summer – Most is Csa (hot summers); Csb climates have mild summers and are more coastal 17 Figure 8-21a Figure 8-21b
  • 18.
    © 2011 PearsonEducation, Inc. World Distribution of Major Climate Types • Humid Subtropical Climate (Cfa, Cwa) – Warm to hot summers; high humidity (Cfa days are hot and sultry) – Precipitation reaches summer maximum, some drop off for winter – Winter temperatures in Cfa regions are mild; typically cooler than mediterranean climates 18 Figure 8-24a Figure 8-24b
  • 19.
    © 2011 PearsonEducation, Inc. World Distribution of Major Climate Types • Marine West Coast Climate (Cfb, Cfc) – Influenced by onshore flow from midlatitude westerlies – Occurs when no topographic boundaries inhibit flow of maritime air inland – Frequently cloudy with precipitation – Temperate climate – Wettest of the midlatitudes 19 Figure 8-26a Figure 8-26b
  • 20.
    © 2011 PearsonEducation, Inc. World Distribution of Major Climate Types • Severe Midlatitude Climates (Group D) – Only in Northern Hemisphere – Continentality— remoteness from oceans – Four recognizable seasons; long, cold winter and short summer – Subdivided into two types based on temperature 20 Figure 8-27
  • 21.
    © 2011 PearsonEducation, Inc. World Distribution of Major Climate Types • Humid Continental Climate (Dfa, Dfb, Dwa, Dwb) – Dominated by westerlies and associated frequent weather changes – Warm summers, cold winters – Generally low precipitation; higher amounts near coasts – Winter precipitation associated with cyclones; summer with convection 21 Figure 8-28a Figure 8-28b
  • 22.
    © 2011 PearsonEducation, Inc. World Distribution of Major Climate Types • Subarctic Climate (Dfc, Dfd, Dwc, Dwd) – Winters are long, dark, and bitterly cold – Summers are short; spring and fall pass quickly – Coldest temperatures; little precipitation – Largest annual temperature ranges (i.e., -90 °F to 98 °F in Verhoyansk, Siberia) 22 Figure 8-31a Figure 8-31b
  • 23.
    © 2011 PearsonEducation, Inc. World Distribution of Major Climate Types • Polar Climates (Group E) – Receive little insolation – No average temperature above 50 °F – Extremely dry, but classified as nonarid – Two primary groups 23 Figure 8-27
  • 24.
    © 2011 PearsonEducation, Inc. World Distribution of Major Climate Types • Tundra Climate (ET) – Southern boundary the “treeline” – Northern boundary border of any plant cover – Long, dark winters – Brief, cool summers – Little precipitation – Winters not as severely cold as subarctic climate region 24 Figure 8-33a Figure 8-33b
  • 25.
    © 2011 PearsonEducation, Inc. World Distribution of Major Climate Types • Ice Cap Climate (EF) – Mainly Greenland and most of Antarctica – Permanent cover of ice and snow – Ice plateaus; high latitude with high altitude – Very limited precipitation, essentially polar deserts 25 Figure 8-34a Figure 8-34b
  • 26.
    © 2011 PearsonEducation, Inc. World Distribution of Major Climate Types • Highland Climate (Group H) – Nearly infinite variations from place to place – Altitude more significant than latitude in highlands – Exposure (whether a slope is windward or leeward) – High diurnal temperature variations due to thin, dry air 26 Figure 8-36
  • 27.
    © 2011 PearsonEducation, Inc. Global Patterns Idealized • Presumed arrangement of Köppen climate types on a hypothetical continent (Figure 8-40) 27 Figure 8-40
  • 28.
    © 2011 PearsonEducation, Inc. Global Climate Change • Changes in climate on long time scales • Weather is noise, climate is long-term signal • Episodic events (i.e., El Niño and the PDO) versus long-term global climate change • Numerous time scales to consider (i.e., temperature) – 70 million years, clear global cooling trend – 150,000 years, temperature fluctuated – 10,000 years, sharp warmup – 150 years, warming trend relative to last 1000 years 28
  • 29.
    © 2011 PearsonEducation, Inc. Global Climate Change • Paleoclimatology – Proxy measures of climate (i.e., ice cores, tree rings) • Dendrochronology— study of past climate through tree ring analysis • Oxygen isotope analysis – Lighter versus heavier isotopes – High 18 O/16 O ratio, glaciation 29 Figure 8-41
  • 30.
    © 2011 PearsonEducation, Inc. Global Climate Change • Coral reefs – Ratio of 18 O/16 O in coral reefs – Height of old reefs • Ice cores – Ratio of 18 O/16 O serves as a thermometer – Provide direct atmospheric composition measurements • Pollen data – Radiocarbon dating 30 Figure 8-42
  • 31.
    © 2011 PearsonEducation, Inc. Global Climate Change • Causes of Long-Term Climate Change – Atmospheric aerosols • Large quantities of aerosols can block insolation and lower temperature • Result from volcanic eruptions or asteroid impacts • Anthropogenic impacts 31 Figure 8-43
  • 32.
    © 2011 PearsonEducation, Inc. Global Climate Change • Climate change causes (cont.) – Solar output fluctuations • Sunspot activity related to solar output – Variations in Earth-Sun relations • Shape of Earth’s orbit • Inclination of Earth’s axis • Precession of Earth’s axis • Milankovitch cycles 32 Figure 8-44
  • 33.
    © 2011 PearsonEducation, Inc. Global Climate Change • Climate change causes (cont.) – Greenhouse gas concentrations • Greenhouse gas concentrations related to temperature • Evidence of CO2 increase being anthropogenic – Feedback mechanisms • Positive feedback mechanisms • Water vapor feedback challenges 33
  • 34.
    © 2011 PearsonEducation, Inc. Global Climate Change • Climate change causes (cont.) – Roles of the oceans • Absorb large amounts of carbon • Methane hydrates • Heat transfer from low latitudes to high latitudes • Climate models – General circulation models (GCMs) – Numerous assumptions – Accuracy of the models 34 Figure 8-45
  • 35.
    © 2011 PearsonEducation, Inc. Global Climate Change • Evidence of current global warming – 11 of 12 warmest years on record occurred between 1995– 2006 – Global temperature increasing at 0.13 °C per decade – Ocean temperatures increasing to depths of 9800 feet – Sea level rise – Temperatures in Arctic increasing at twice global rate 35 Figure 8-46a
  • 36.
    © 2011 PearsonEducation, Inc. Global Climate Change • Evidence of current global warming (cont.) – Sea ice in Arctic decreasing by 7.4 percent per decade – Ice caps and glacier melt leading to sea level rise – Temperatures on top of a permafrost layer have increased by 5.4 °F – Number of intense tropical cyclones increased since 1970 – Amount of water vapor in atmosphere increased – Changes in precipitation amounts 36 Figure 8-46b
  • 37.
    © 2011 PearsonEducation, Inc. Global Climate Change • Evidence of current global warming (cont.) – Concentrations of carbon dioxide correlated with temperature – Carbon dioxide concentrations correlate with increased anthropogenic greenhouse gases – Carbon dioxide increasing at a rate faster than observed in last 800,000 years 37
  • 38.
    © 2011 PearsonEducation, Inc. Global Climate Change • Consequences of global warming – Projected climate in the upcoming century • Climate will warm at about 0.4 °F per decade • Changes will be greater than those observed during 20th century • Estimated increase of temperature from 3.3 °F to 7.2 °F • Sea level rise • Stronger tropical cyclones • Increased precipitation 38 Figure 8-47a
  • 39.
    © 2011 PearsonEducation, Inc. Global Climate Change • Addressing global warming – Kyoto protocol – Standards for newly industrialized countries – Mitigating and adapting 39 Figure 8-47b
  • 40.
    © 2011 PearsonEducation, Inc. Summary • Climate is classified based on precipitation and temperature • There are six primary groups of world climates • The tropical humid climates exist at tropical latitudes and are characterized by warm, constant temperatures and rainfall • Dry climates exist near the subtropics and are characterized by hot, dry conditions • Mild midlatitude climates constitute a transition between warmer tropical climates and cold severe midlatitude climates 40
  • 41.
    © 2011 PearsonEducation, Inc. Summary • Mild midlatitude climates typically have long and hot summers and mild winters, and have modest precipitation • Severe midlatitude climates only occur in the Northern Hemisphere • Severe midlatitude climates have long, cold winters and short summers, and have large annual temperature ranges • Polar climates receive little insolation and are permanently cold and dry 41
  • 42.
    © 2011 PearsonEducation, Inc. Summary • Highland climates depend on elevation of mountainous terrain for their climate characteristics • Many paleoclimatology methods are used to understand the Earth’s past climate • There are several factors that influence long-term climate change • Global warming is related to the increase in carbon dioxide release by humans 42