Downloaded 175 times
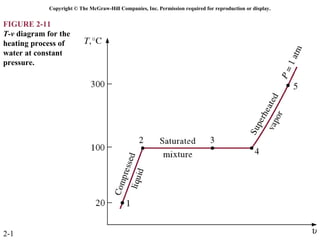
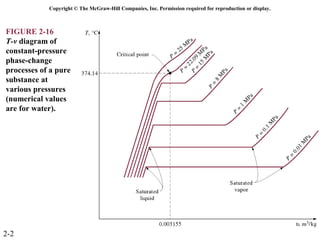
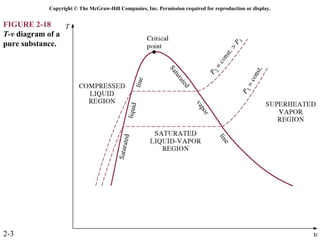
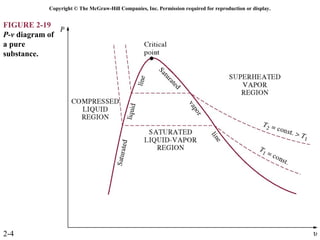
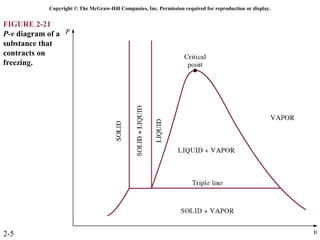
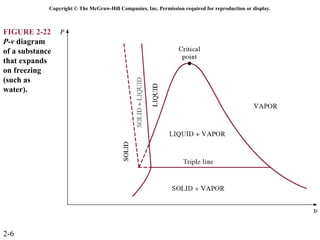
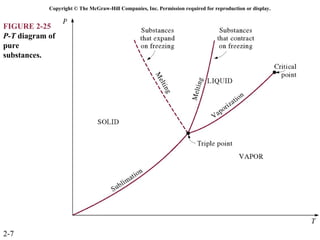
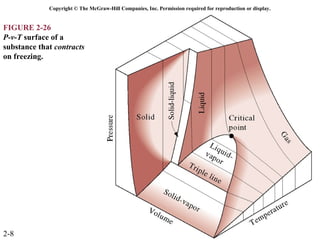
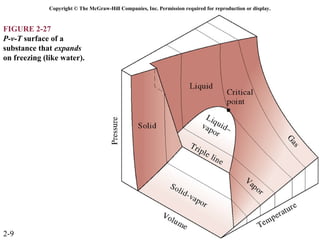
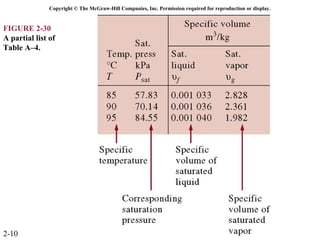
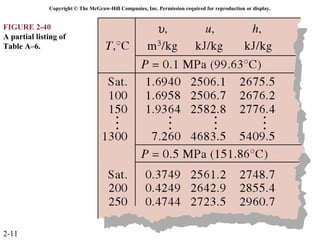
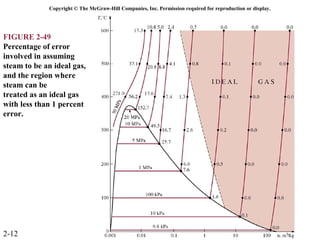
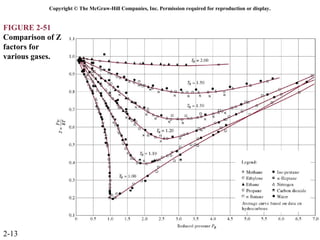
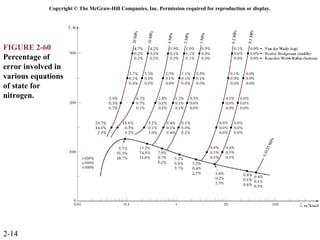
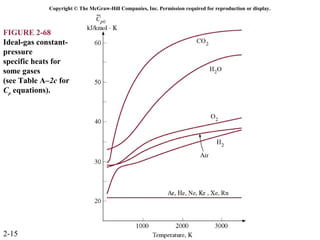

The document discusses properties of pure substances through figures and diagrams. It examines temperature-volume diagrams, pressure-volume diagrams, pressure-temperature diagrams, and pressure-volume-temperature surfaces for substances that contract or expand when freezing. Tables of properties for various substances are also referenced. The figures explore ideal gas behavior, equations of state, and constant-pressure specific heats for gases.