Chapter 3
Properties of a Pure Substance
 Three familiar properties of a
substance in the previous
chapter —
– specific volume,
– pressure, and
– temperature.
3.1 THE PURE SUBSTANCE
 has a homogeneous and invariable
chemical composition,
 exist in more than one phase, and
 exist with no change of phase.
 Examples :
– liquid water,
– a mixture of ice and liquid water,
– a mixture of gases, such as air
 A mixture of liquid air and gaseous air – ( X )
– Because the chemical composition of the liquid
phase is different from that of the vapor phase. )
 Those whose surface effects, magnetic
effects, and electrical effects are
insignificant when dealing with the
substances.
 But changes in volume, such as those
associated with the expansion of a gas
in a cylinder, are very important.
Simple Compressible Substances
(system)
3.2 VAPOR–LIQUID–SOLID-PHASE
EQUILIBRIUM IN A PURE SUBSTANCE
Fig.3.1
0.1MPa
20 0
C,1kg
Heat, ν
99.6 0
C
Heat ,ν
 Saturation Temperature
– The temperature at which vaporization
takes place at a given pressure.
 And this given pressure is called the
Saturation Pressure for the given
temperature.
Fig. 3.2 A vapor-pressure curve
for a pure substance
Sub-cooled liquid
Compressed liquid
 Saturated liquid (state)
– A substance exists as liquid (state) at the
saturation temperature and pressure.
 Subcooled liquid (Compressed liquid)
– If the temperature of the liquid is lower than the
saturation temperature for the existing pressure, it
is called either a subcooled liquid (implying that
the temperature is lower than the saturation
temperature for the given pressure) or a
compressed liquid (implying that the pressure is
greater than the saturation pressure for the given
temperature).
 Quality of substance
– When a substance exists as part liquid and
part vapor at the saturation temperature,its
quality is defined as the ratio of the mass
of vapor to the total mass.
 Quality has meaning only when the
substance is in a saturated state.
 Saturated vapor
– A substance exists as vapor at the
saturation temperature.
 The quality of dry saturated vapor is
100%.
 Superheated vapor
is the vapor at a temperature greater
than the saturation temperature.
 Actually, the substances we call gases
are highly superheated vapors.
Fig. 3.3 Temperature–volume diagram for water showing liquid and
vapor phases.
20
o
C
Supercritical
fluid
Table 3.1
FIGURE 3.4 T –v diagram for the two-phase liquid–vapor
region to show the quality specific volume relation.
To Derivative the Quality, x
 V =Vliq +Vvap = mliq v f+mvap v g
then divide the above equation by total
mass m,
Table 3.2
FIGURE 3.5 Pressure temperature diagram
for a substance such as water.
FIGURE 3.6 Carbon dioxide phase diagram.
Fig. 3.7 Water phase
diagram.
3.3 INDEPENDENT PROPERTIES
OF A PURE SUBSTANCE
•The state of a simple compressible pure
substance is defined by two independent
properties.
• For example, if the specific volume and
temperature of superheated steam are
specified, the state of the steam is
determined.
 Consider the saturated-liquid and saturated-
vapor states of a pure substance. These two
states have the same pressure and the same
temperature, but they are definitely not the same
state. Therefore, in a saturation state, pressure
and temperature are not independent properties.
 Two independent properties such as pressure
and specific volume or pressure and quality are
required to specify a saturation state of a pure
substance.
A exception, in a saturation state, should
be noted.
 A mixture of gases, such as air, has the
same characteristics as a pure substance
as long as only one phase is present,
concerns precisely this point.
 The state of air, which is a mixture of gases
of definite composition, is determined by
specifying two properties as long as it
remains in the gaseous phase.
3.4 TABLES OF THERMODYNAMIC
PROPERTIES
FIGURE 3.8 Listing of the steam tables.
200
Pg=1.554
Pg=1.0
o
C
Pg=5.0
• Example
Let us calculate the specific volume of saturated
steam at 200o
C having a quality of 70%.
•
<Solution>
Using Eq. 3.1, and looking up Table B.1.3 gives
v = 0.3 (0.001 156) +0.7 (0.127 36) = 0.0895 m 3 /kg
Example. 3.1
Example 3.2
continued
Example 3.3
Example 3.4
(p.412)
3.5 THERMODYNAMIC SURFACES
3.6 THE P–V–T BEHAVIOR OF LOW- AND
MODERATE-DENSITY GASES
•At very low densities the average distances
between molecules is so large that the
intermolecular ( IM ) potential energy may
effectively be neglected.
• In such a case, the particles would be
independent
of one another, and the situation is referred
to as an
ideal gas.
•Therefore, a very low density gas behaves
according to the
ideal gas equation of state.
+
 R is a different constant for each
particular gas. The value of R for a
number of substances is given in
Table A.5 of Appendix A.
Example 3.5
Example 3.6
 Over what range of density will the
ideal
gas equation of state hold with
accuracy?
 How much does an actual gas at a
given pressure and temperature
deviate from
ideal gas behavior?
 As would be expected, at very low pressure
or high temperature the error is small and
the gas behavior becomes closer to the
ideal gas model.
 But this error becomes severe as the
density increases (specific volume
decreases).
FIGURE 3.14 Temperature-specific volume diagram for water
that indicates the error in assuming ideal gas for saturated
vapor and for superheated vapor.
 A more quantitative study of the question of
the ideal-gas approximation
 Z =1, for an ideal gas
 The deviation of Z from unity is a measure of
the deviation of the actual relation from the
ideal-gas equation of state.
Compressibility factor, Z
Fig.3.15 Compressibility of nitrogen
Is there a way in which we can put all of the substances on a common
basis? To do so, we “reduce” the properties with respect to the
values at the critical point.
Example 3.7
Example 3.8

5968243.ppt pure substances chapter three

  • 1.
    Chapter 3 Properties ofa Pure Substance  Three familiar properties of a substance in the previous chapter — – specific volume, – pressure, and – temperature.
  • 2.
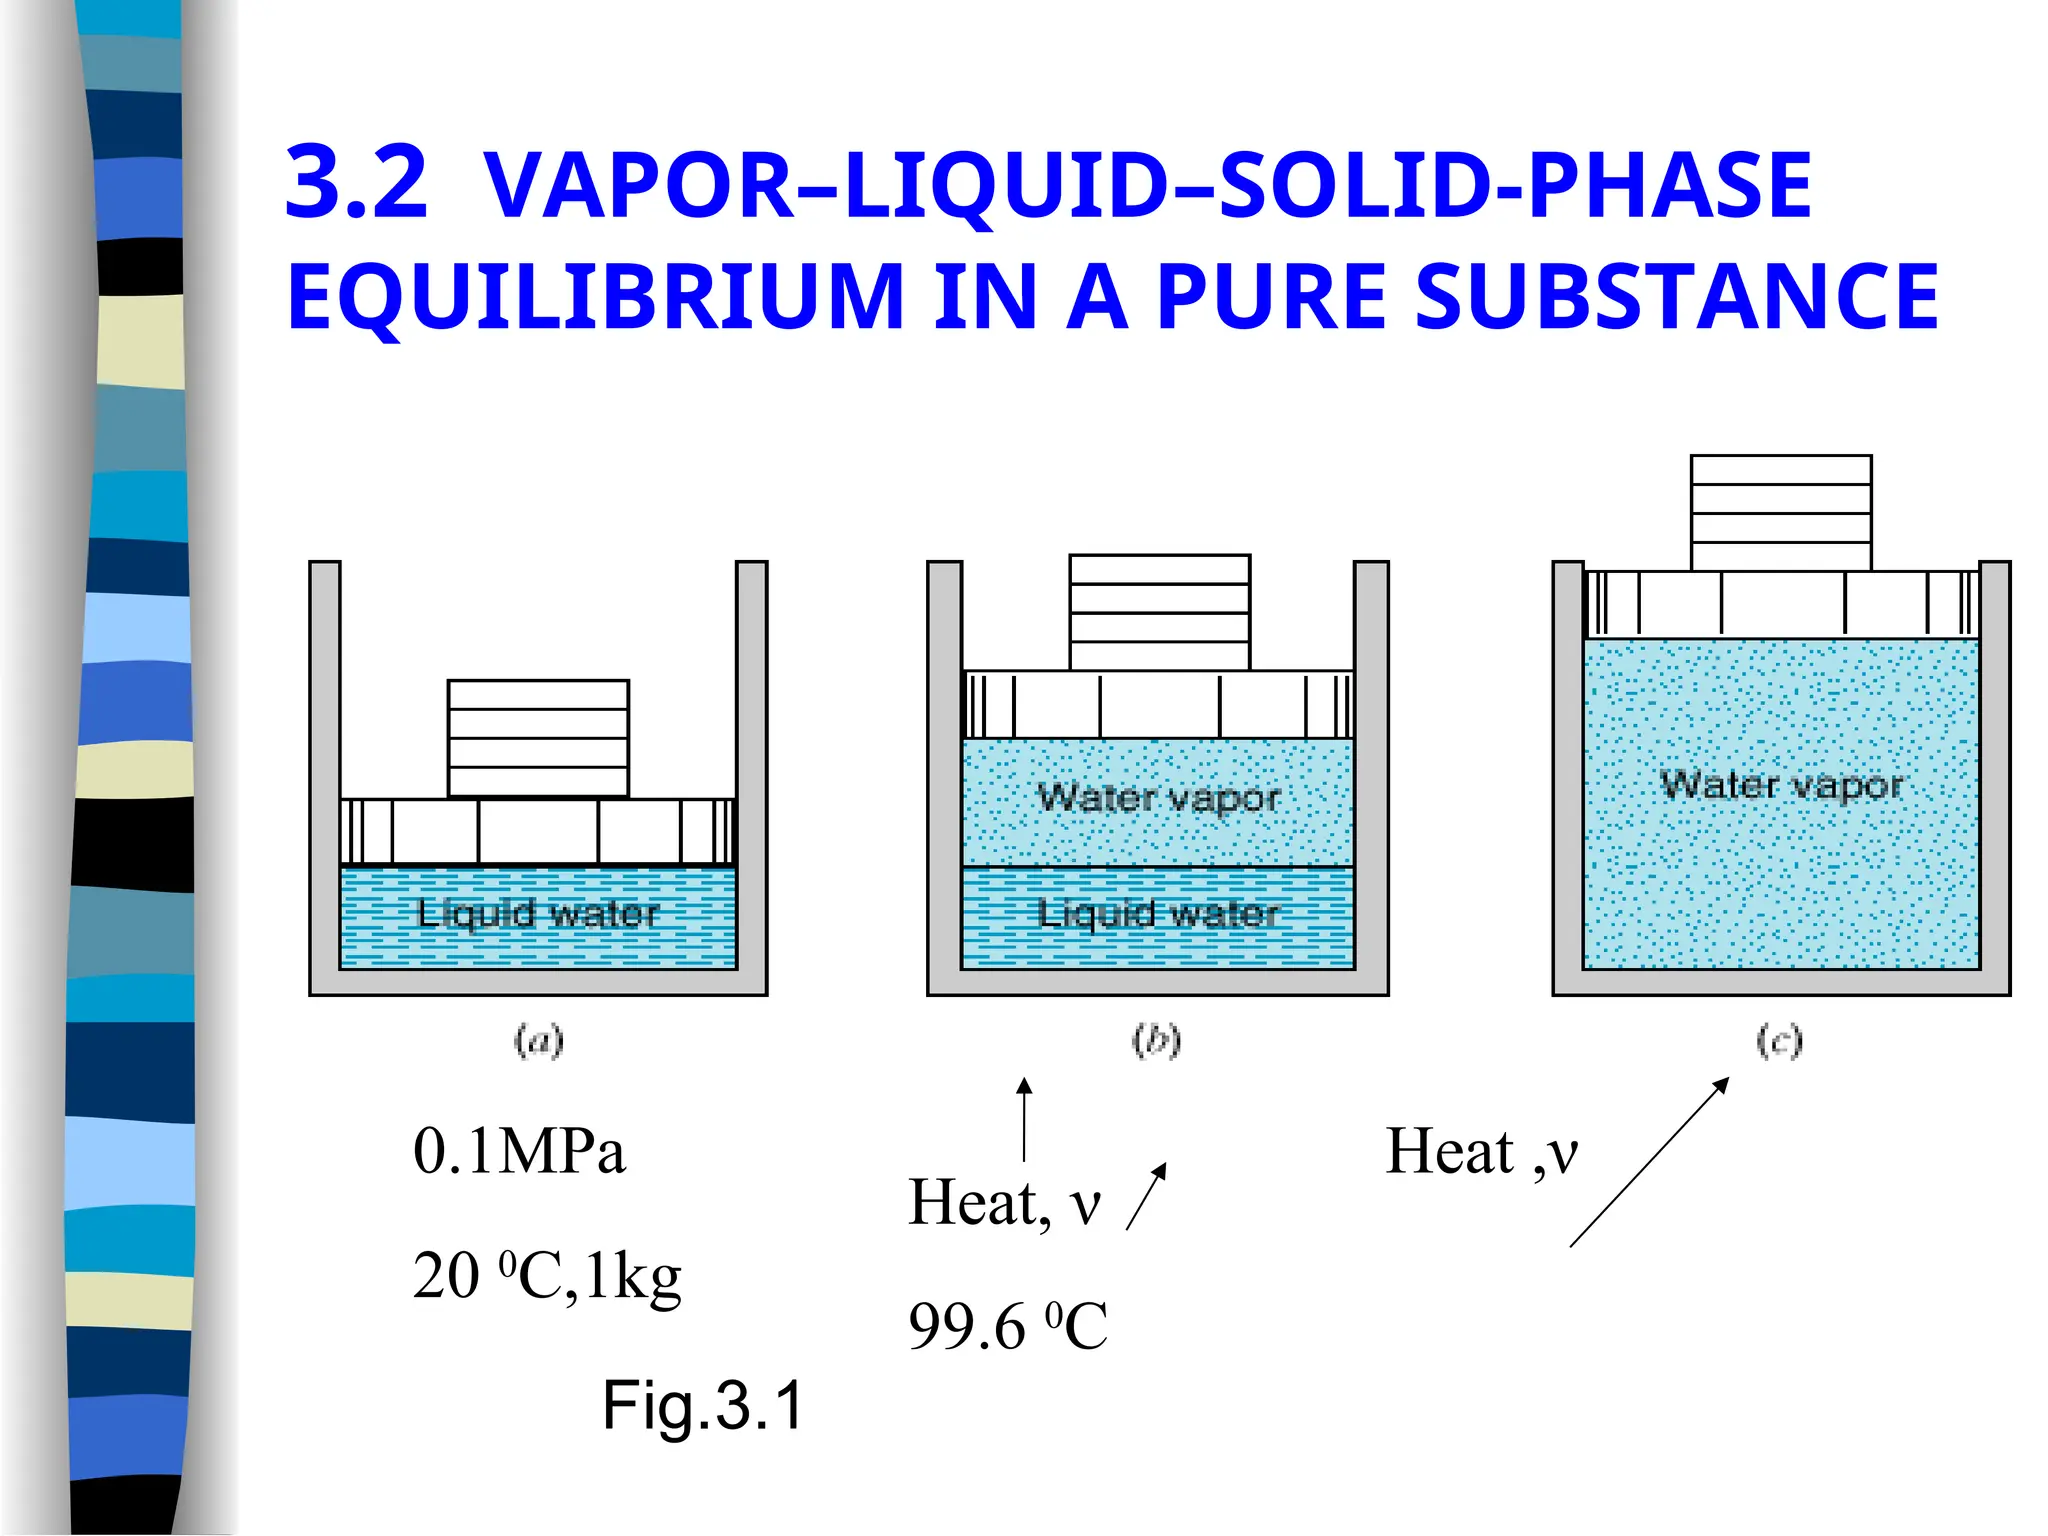
    3.1 THE PURESUBSTANCE  has a homogeneous and invariable chemical composition,  exist in more than one phase, and  exist with no change of phase.  Examples : – liquid water, – a mixture of ice and liquid water, – a mixture of gases, such as air  A mixture of liquid air and gaseous air – ( X ) – Because the chemical composition of the liquid phase is different from that of the vapor phase. )
  • 3.
     Those whosesurface effects, magnetic effects, and electrical effects are insignificant when dealing with the substances.  But changes in volume, such as those associated with the expansion of a gas in a cylinder, are very important. Simple Compressible Substances (system)
  • 4.
    3.2 VAPOR–LIQUID–SOLID-PHASE EQUILIBRIUM INA PURE SUBSTANCE Fig.3.1 0.1MPa 20 0 C,1kg Heat, ν 99.6 0 C Heat ,ν
  • 5.
     Saturation Temperature –The temperature at which vaporization takes place at a given pressure.  And this given pressure is called the Saturation Pressure for the given temperature.
  • 6.
    Fig. 3.2 Avapor-pressure curve for a pure substance Sub-cooled liquid Compressed liquid
  • 7.
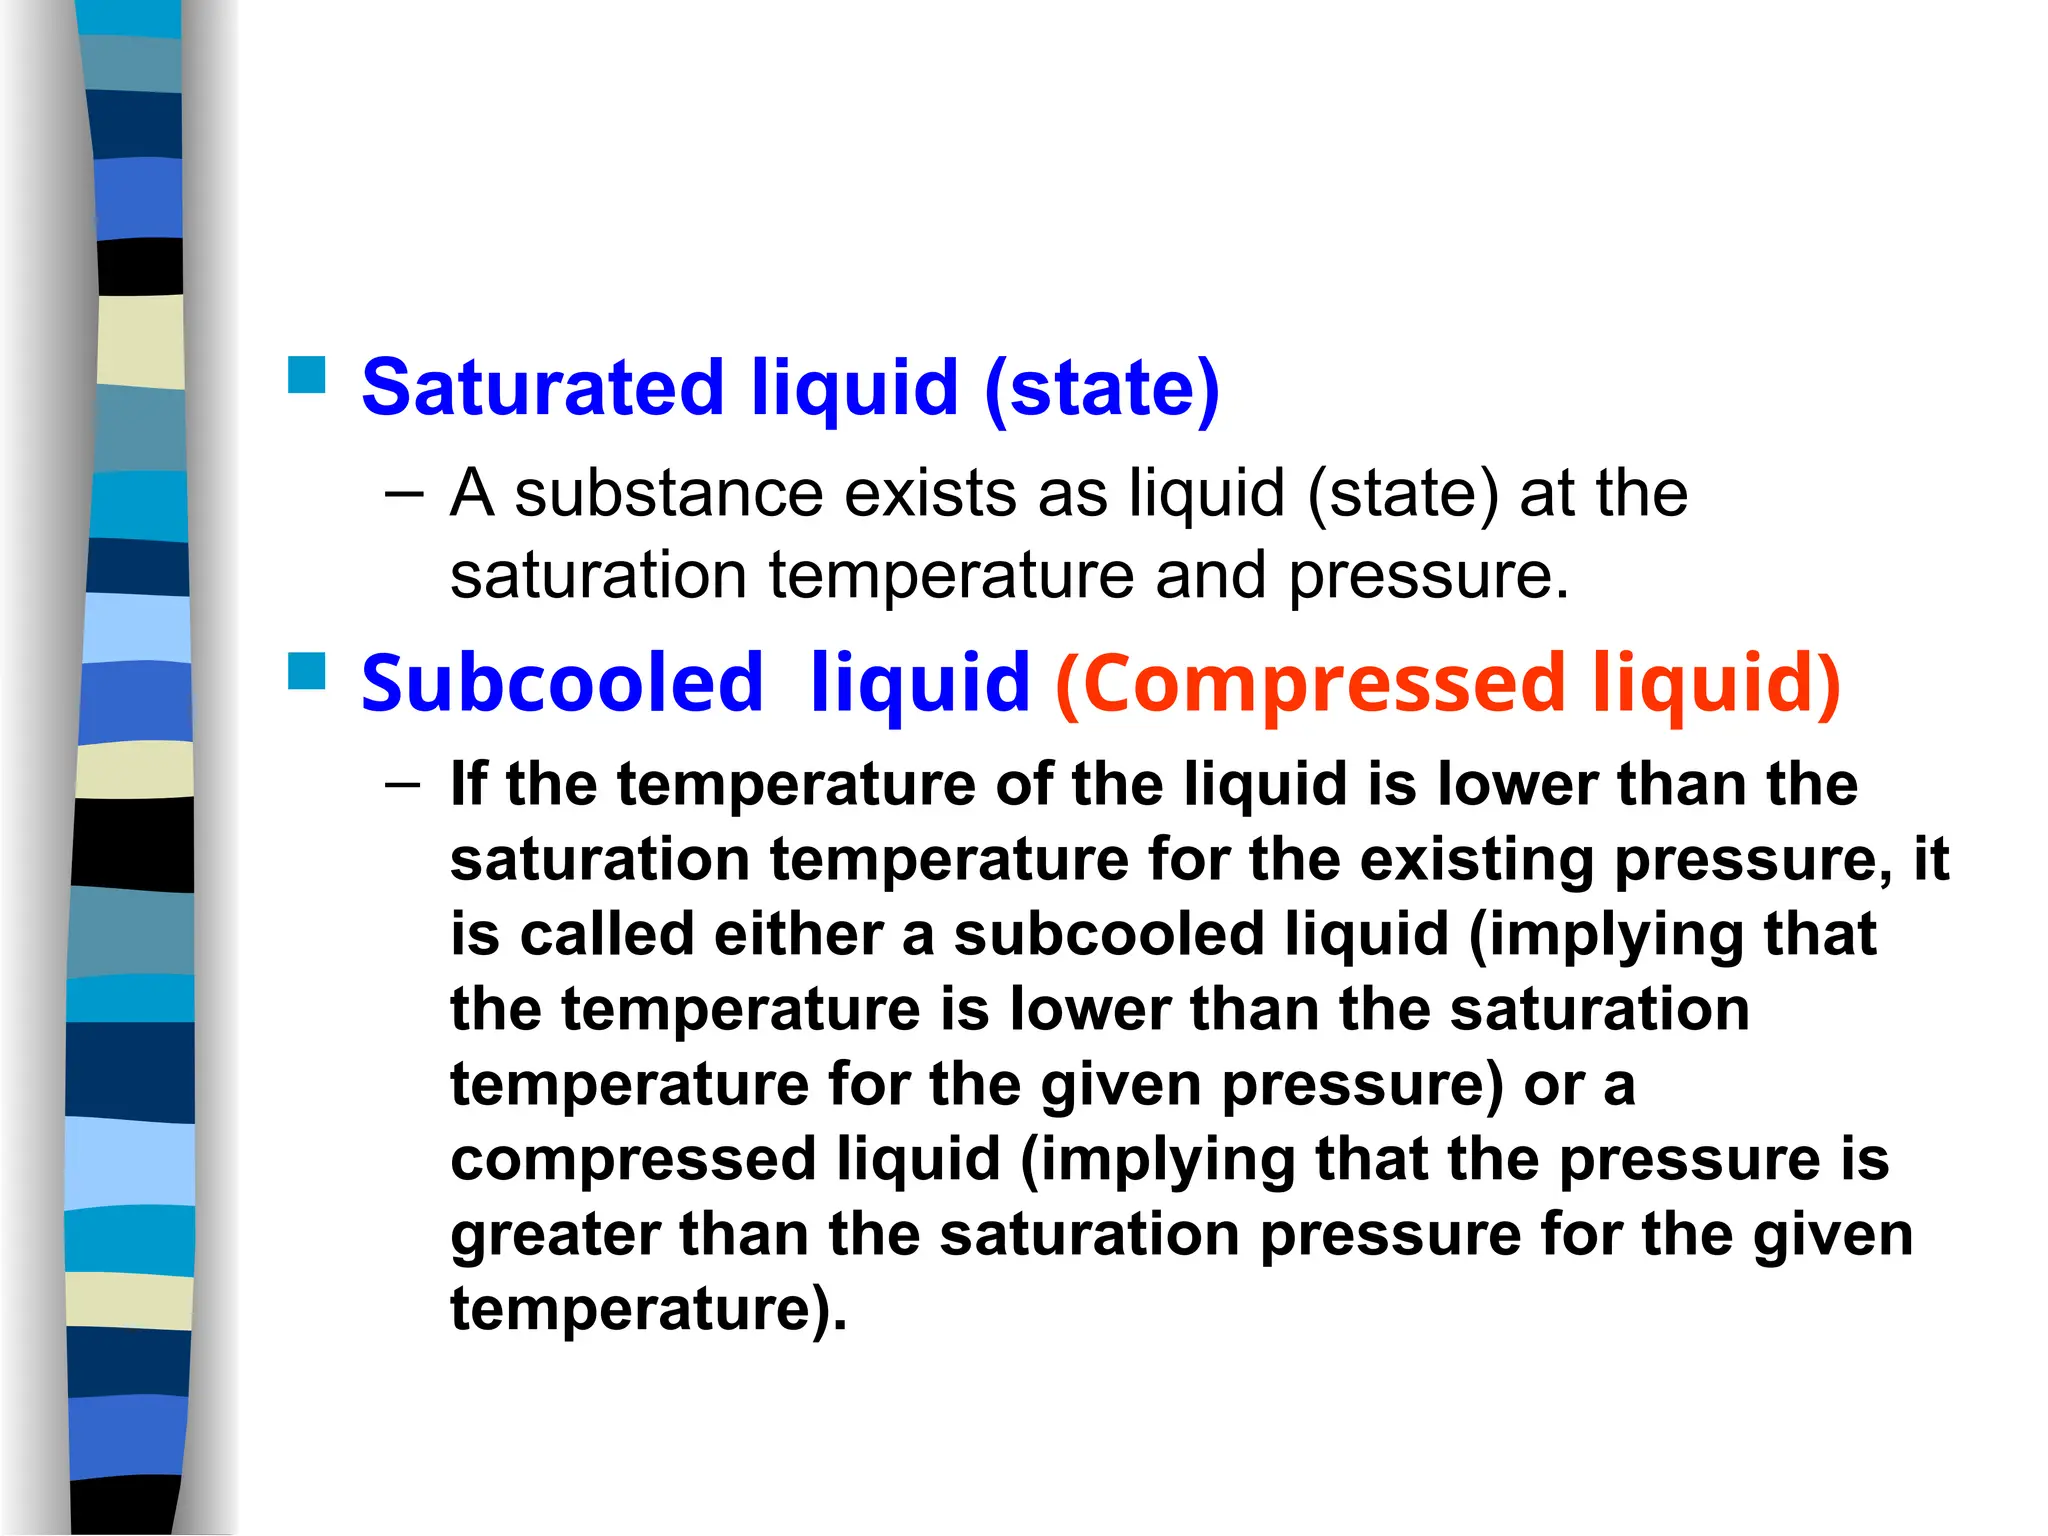
     Saturated liquid(state) – A substance exists as liquid (state) at the saturation temperature and pressure.  Subcooled liquid (Compressed liquid) – If the temperature of the liquid is lower than the saturation temperature for the existing pressure, it is called either a subcooled liquid (implying that the temperature is lower than the saturation temperature for the given pressure) or a compressed liquid (implying that the pressure is greater than the saturation pressure for the given temperature).
  • 8.
     Quality ofsubstance – When a substance exists as part liquid and part vapor at the saturation temperature,its quality is defined as the ratio of the mass of vapor to the total mass.  Quality has meaning only when the substance is in a saturated state.
  • 9.
     Saturated vapor –A substance exists as vapor at the saturation temperature.  The quality of dry saturated vapor is 100%.
  • 10.
     Superheated vapor isthe vapor at a temperature greater than the saturation temperature.  Actually, the substances we call gases are highly superheated vapors.
  • 11.
    Fig. 3.3 Temperature–volumediagram for water showing liquid and vapor phases. 20 o C Supercritical fluid
  • 12.
  • 13.
    FIGURE 3.4 T–v diagram for the two-phase liquid–vapor region to show the quality specific volume relation.
  • 14.
    To Derivative theQuality, x  V =Vliq +Vvap = mliq v f+mvap v g then divide the above equation by total mass m,
  • 16.
  • 17.
    FIGURE 3.5 Pressuretemperature diagram for a substance such as water.
  • 18.
    FIGURE 3.6 Carbondioxide phase diagram.
  • 19.
    Fig. 3.7 Waterphase diagram.
  • 20.
    3.3 INDEPENDENT PROPERTIES OFA PURE SUBSTANCE •The state of a simple compressible pure substance is defined by two independent properties. • For example, if the specific volume and temperature of superheated steam are specified, the state of the steam is determined.
  • 21.
     Consider thesaturated-liquid and saturated- vapor states of a pure substance. These two states have the same pressure and the same temperature, but they are definitely not the same state. Therefore, in a saturation state, pressure and temperature are not independent properties.  Two independent properties such as pressure and specific volume or pressure and quality are required to specify a saturation state of a pure substance. A exception, in a saturation state, should be noted.
  • 22.
     A mixtureof gases, such as air, has the same characteristics as a pure substance as long as only one phase is present, concerns precisely this point.  The state of air, which is a mixture of gases of definite composition, is determined by specifying two properties as long as it remains in the gaseous phase.
  • 23.
    3.4 TABLES OFTHERMODYNAMIC PROPERTIES FIGURE 3.8 Listing of the steam tables. 200 Pg=1.554 Pg=1.0 o C Pg=5.0
  • 24.
    • Example Let uscalculate the specific volume of saturated steam at 200o C having a quality of 70%. • <Solution> Using Eq. 3.1, and looking up Table B.1.3 gives v = 0.3 (0.001 156) +0.7 (0.127 36) = 0.0895 m 3 /kg
  • 25.
  • 26.
  • 27.
  • 28.
  • 29.
  • 30.
  • 31.
    3.6 THE P–V–TBEHAVIOR OF LOW- AND MODERATE-DENSITY GASES •At very low densities the average distances between molecules is so large that the intermolecular ( IM ) potential energy may effectively be neglected. • In such a case, the particles would be independent of one another, and the situation is referred to as an ideal gas. •Therefore, a very low density gas behaves according to the ideal gas equation of state.
  • 32.
  • 33.
     R isa different constant for each particular gas. The value of R for a number of substances is given in Table A.5 of Appendix A.
  • 34.
  • 35.
  • 36.
     Over whatrange of density will the ideal gas equation of state hold with accuracy?  How much does an actual gas at a given pressure and temperature deviate from ideal gas behavior?
  • 37.
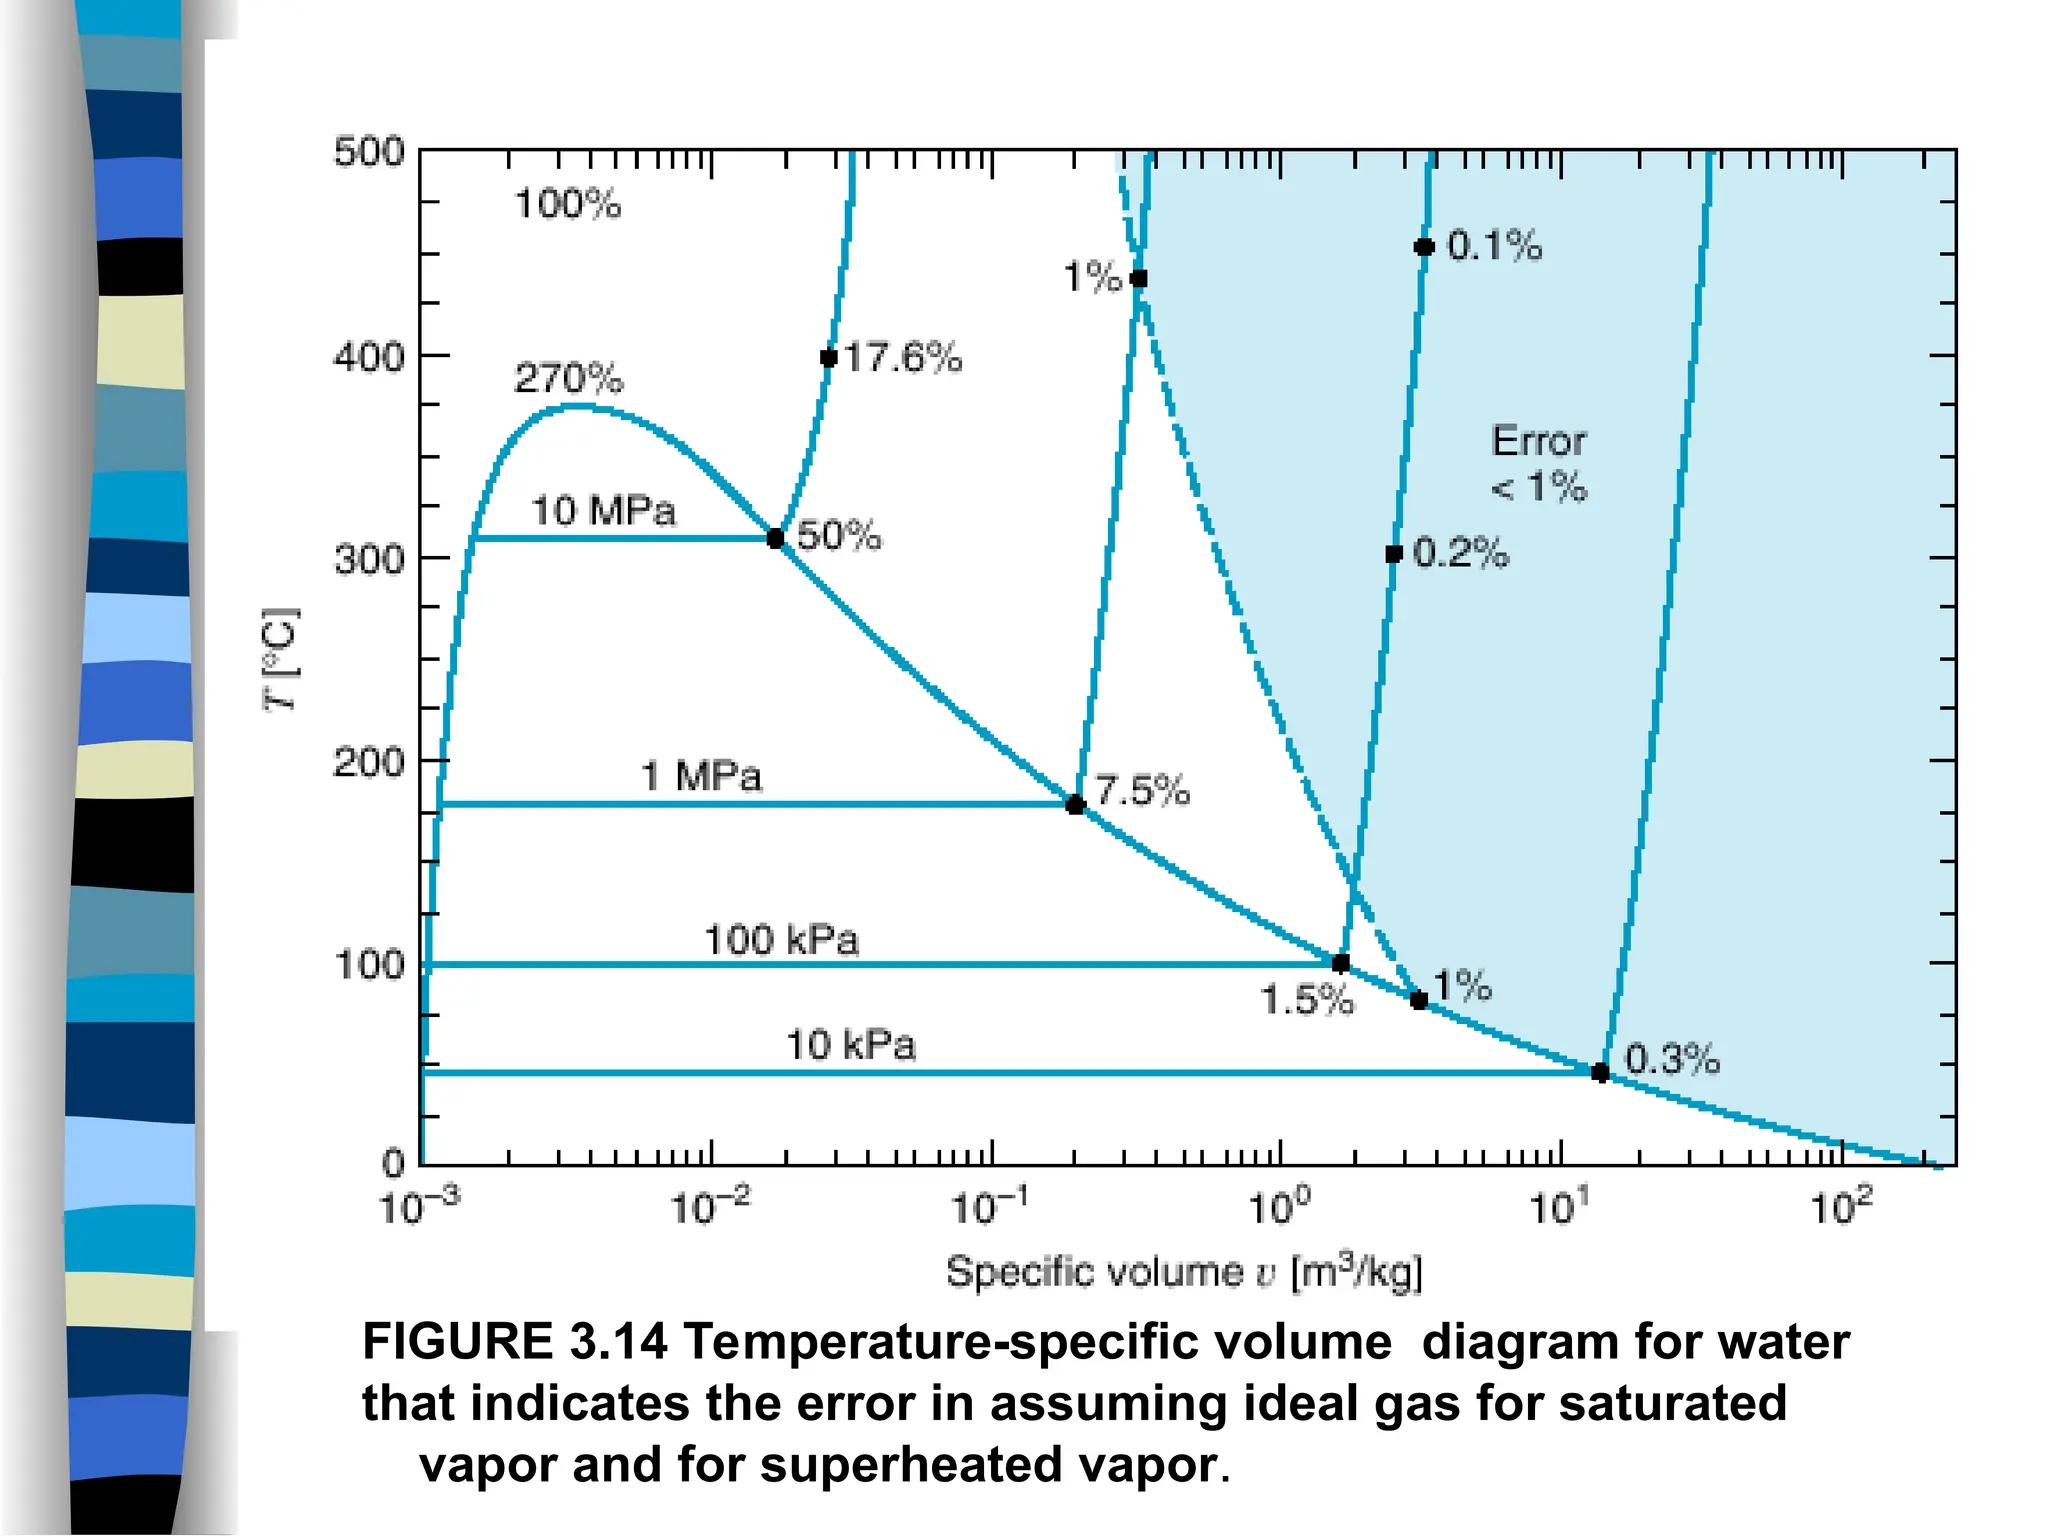
     As wouldbe expected, at very low pressure or high temperature the error is small and the gas behavior becomes closer to the ideal gas model.  But this error becomes severe as the density increases (specific volume decreases).
  • 38.
    FIGURE 3.14 Temperature-specificvolume diagram for water that indicates the error in assuming ideal gas for saturated vapor and for superheated vapor.
  • 39.
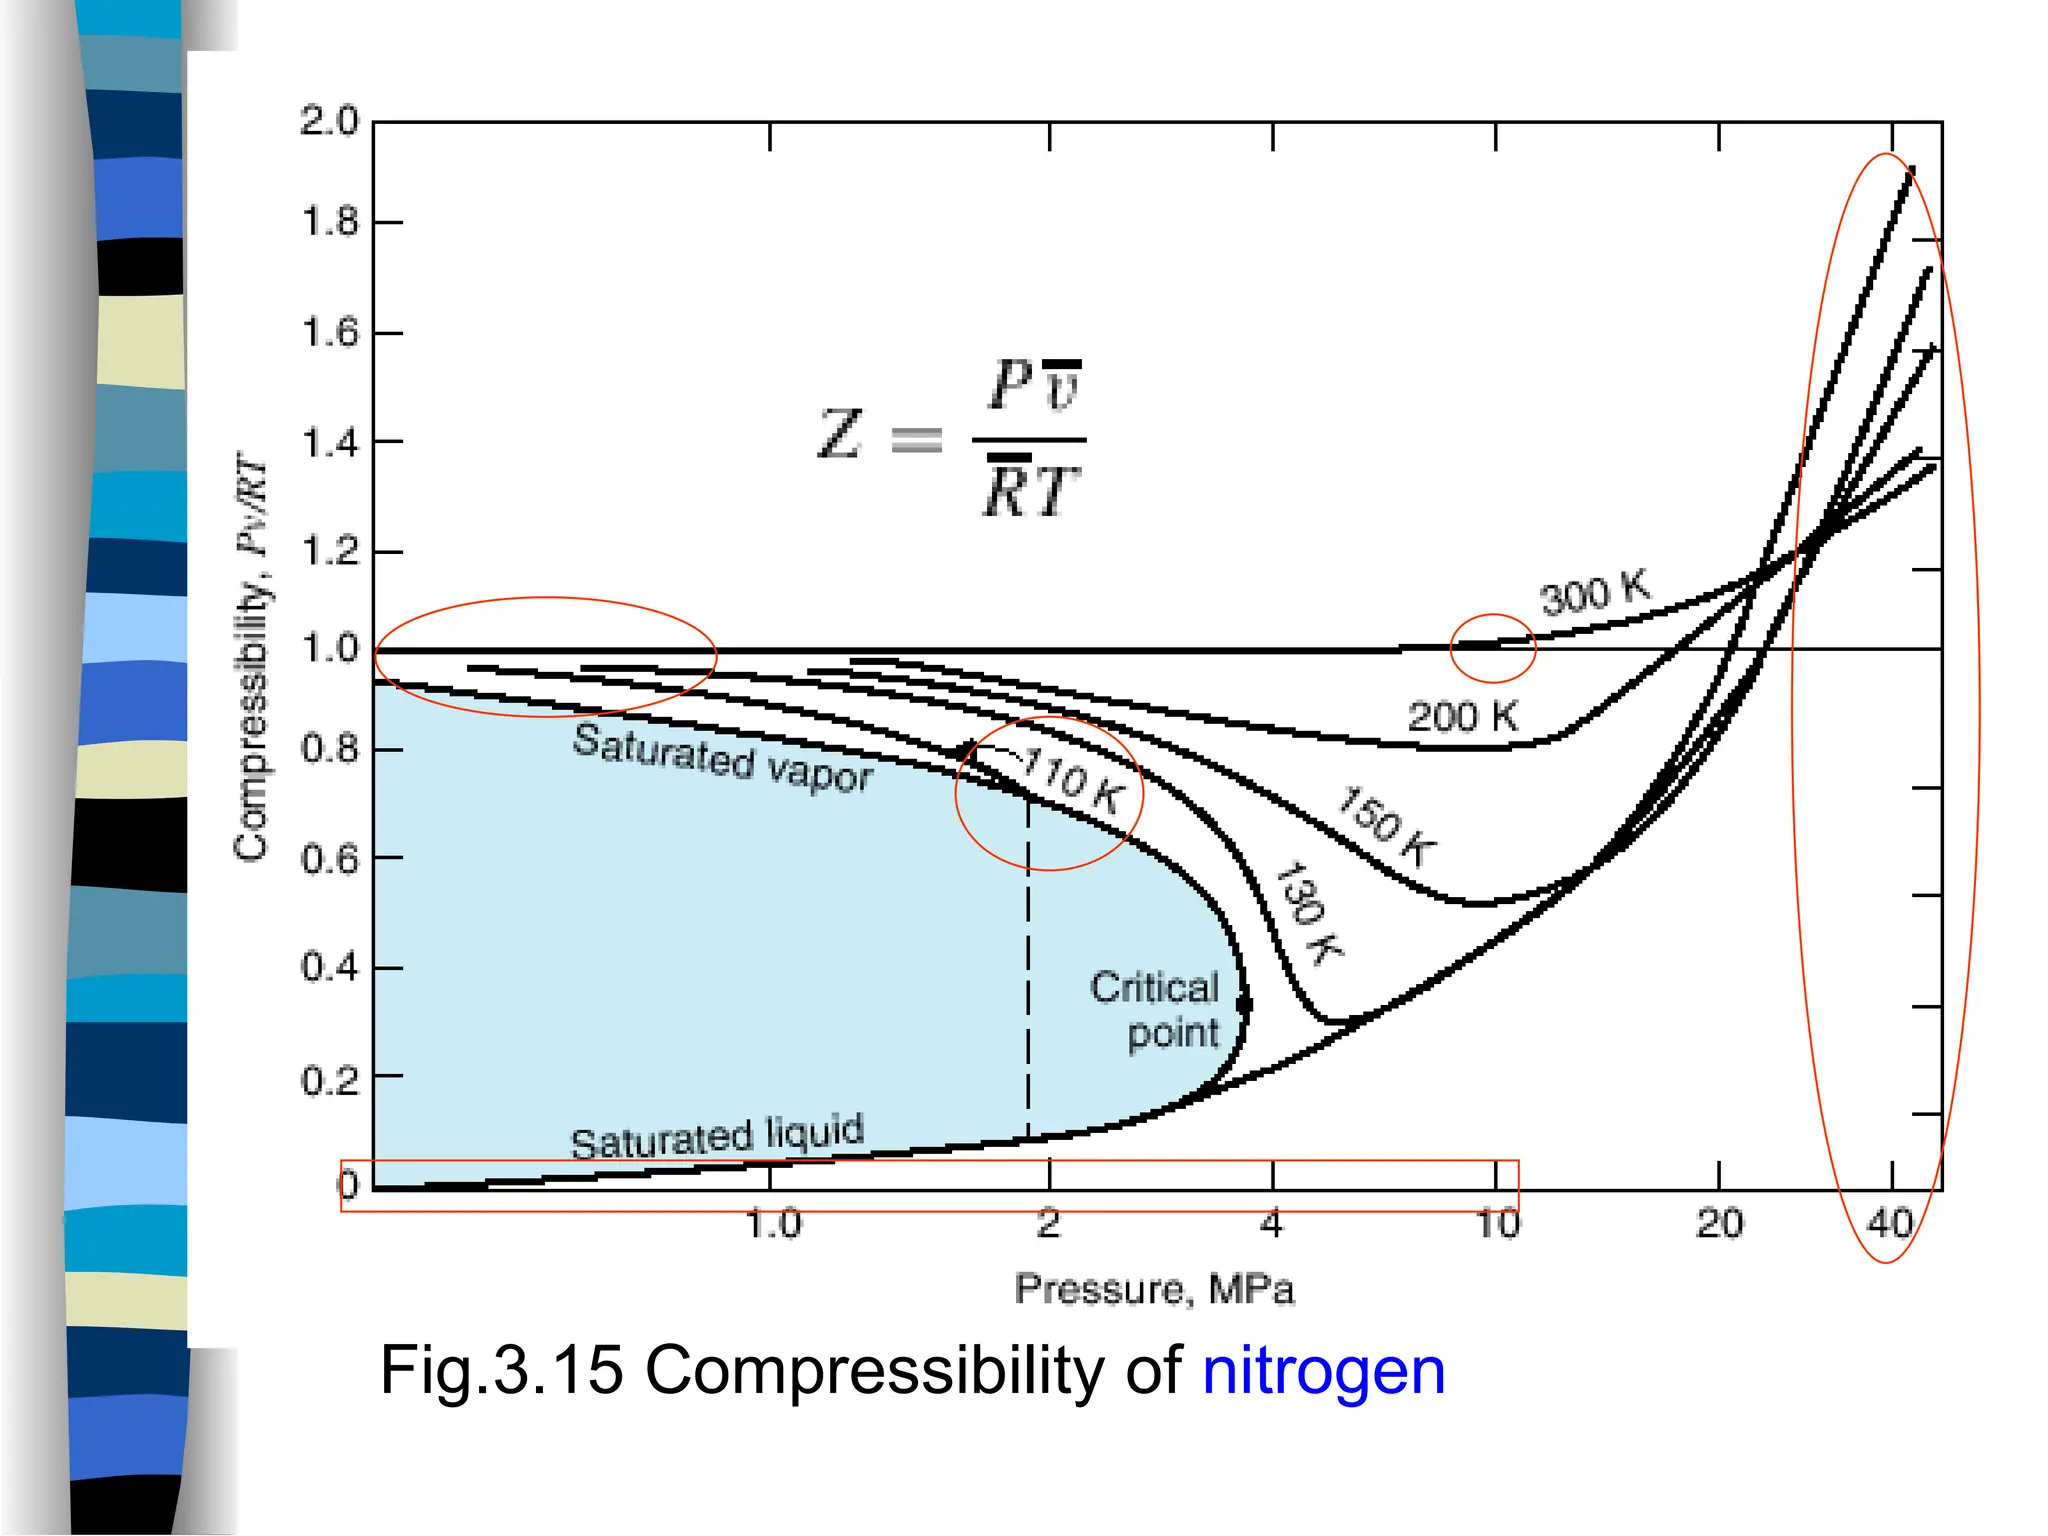
     A morequantitative study of the question of the ideal-gas approximation  Z =1, for an ideal gas  The deviation of Z from unity is a measure of the deviation of the actual relation from the ideal-gas equation of state. Compressibility factor, Z
  • 40.
  • 41.
    Is there away in which we can put all of the substances on a common basis? To do so, we “reduce” the properties with respect to the values at the critical point.
  • 43.
  • 44.