Downloaded 196 times


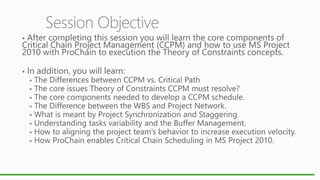

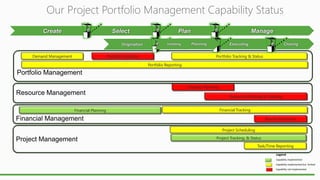
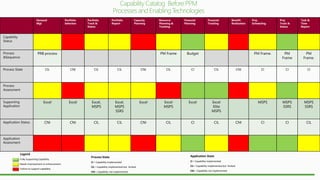


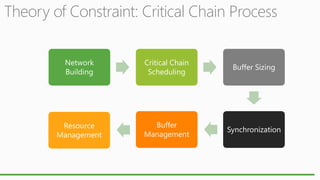
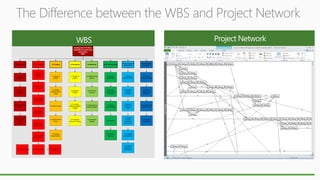
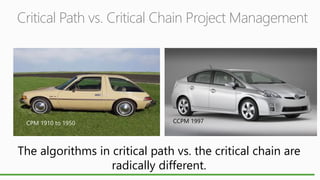
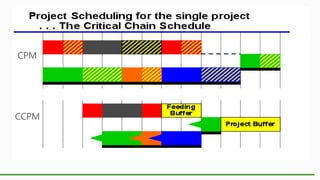
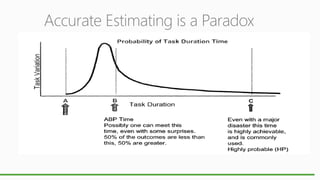


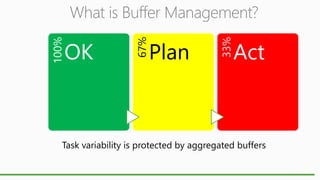

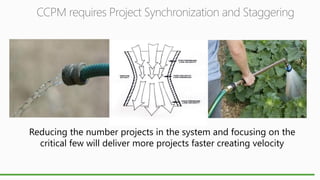


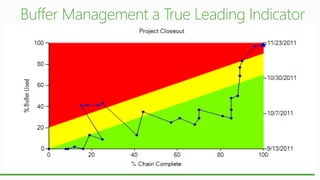
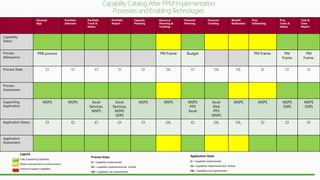


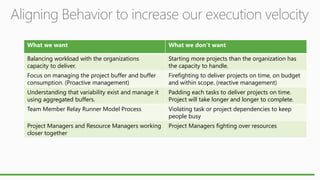
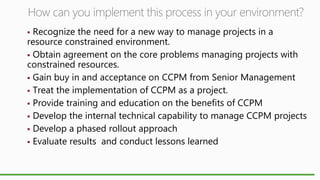
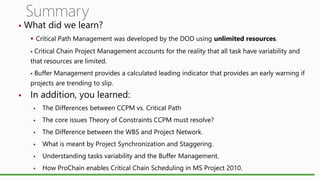


The document outlines the objectives and status of a project portfolio management framework, focusing on areas such as demand management, capacity planning, and benefits realization. It discusses critical chain project management (CCPM) and its differences from traditional critical path methods, emphasizing the importance of buffer management and resource constraints. The document also highlights the need for a new approach to manage projects effectively in resource-constrained environments, including training and phased implementation of CCPM.