
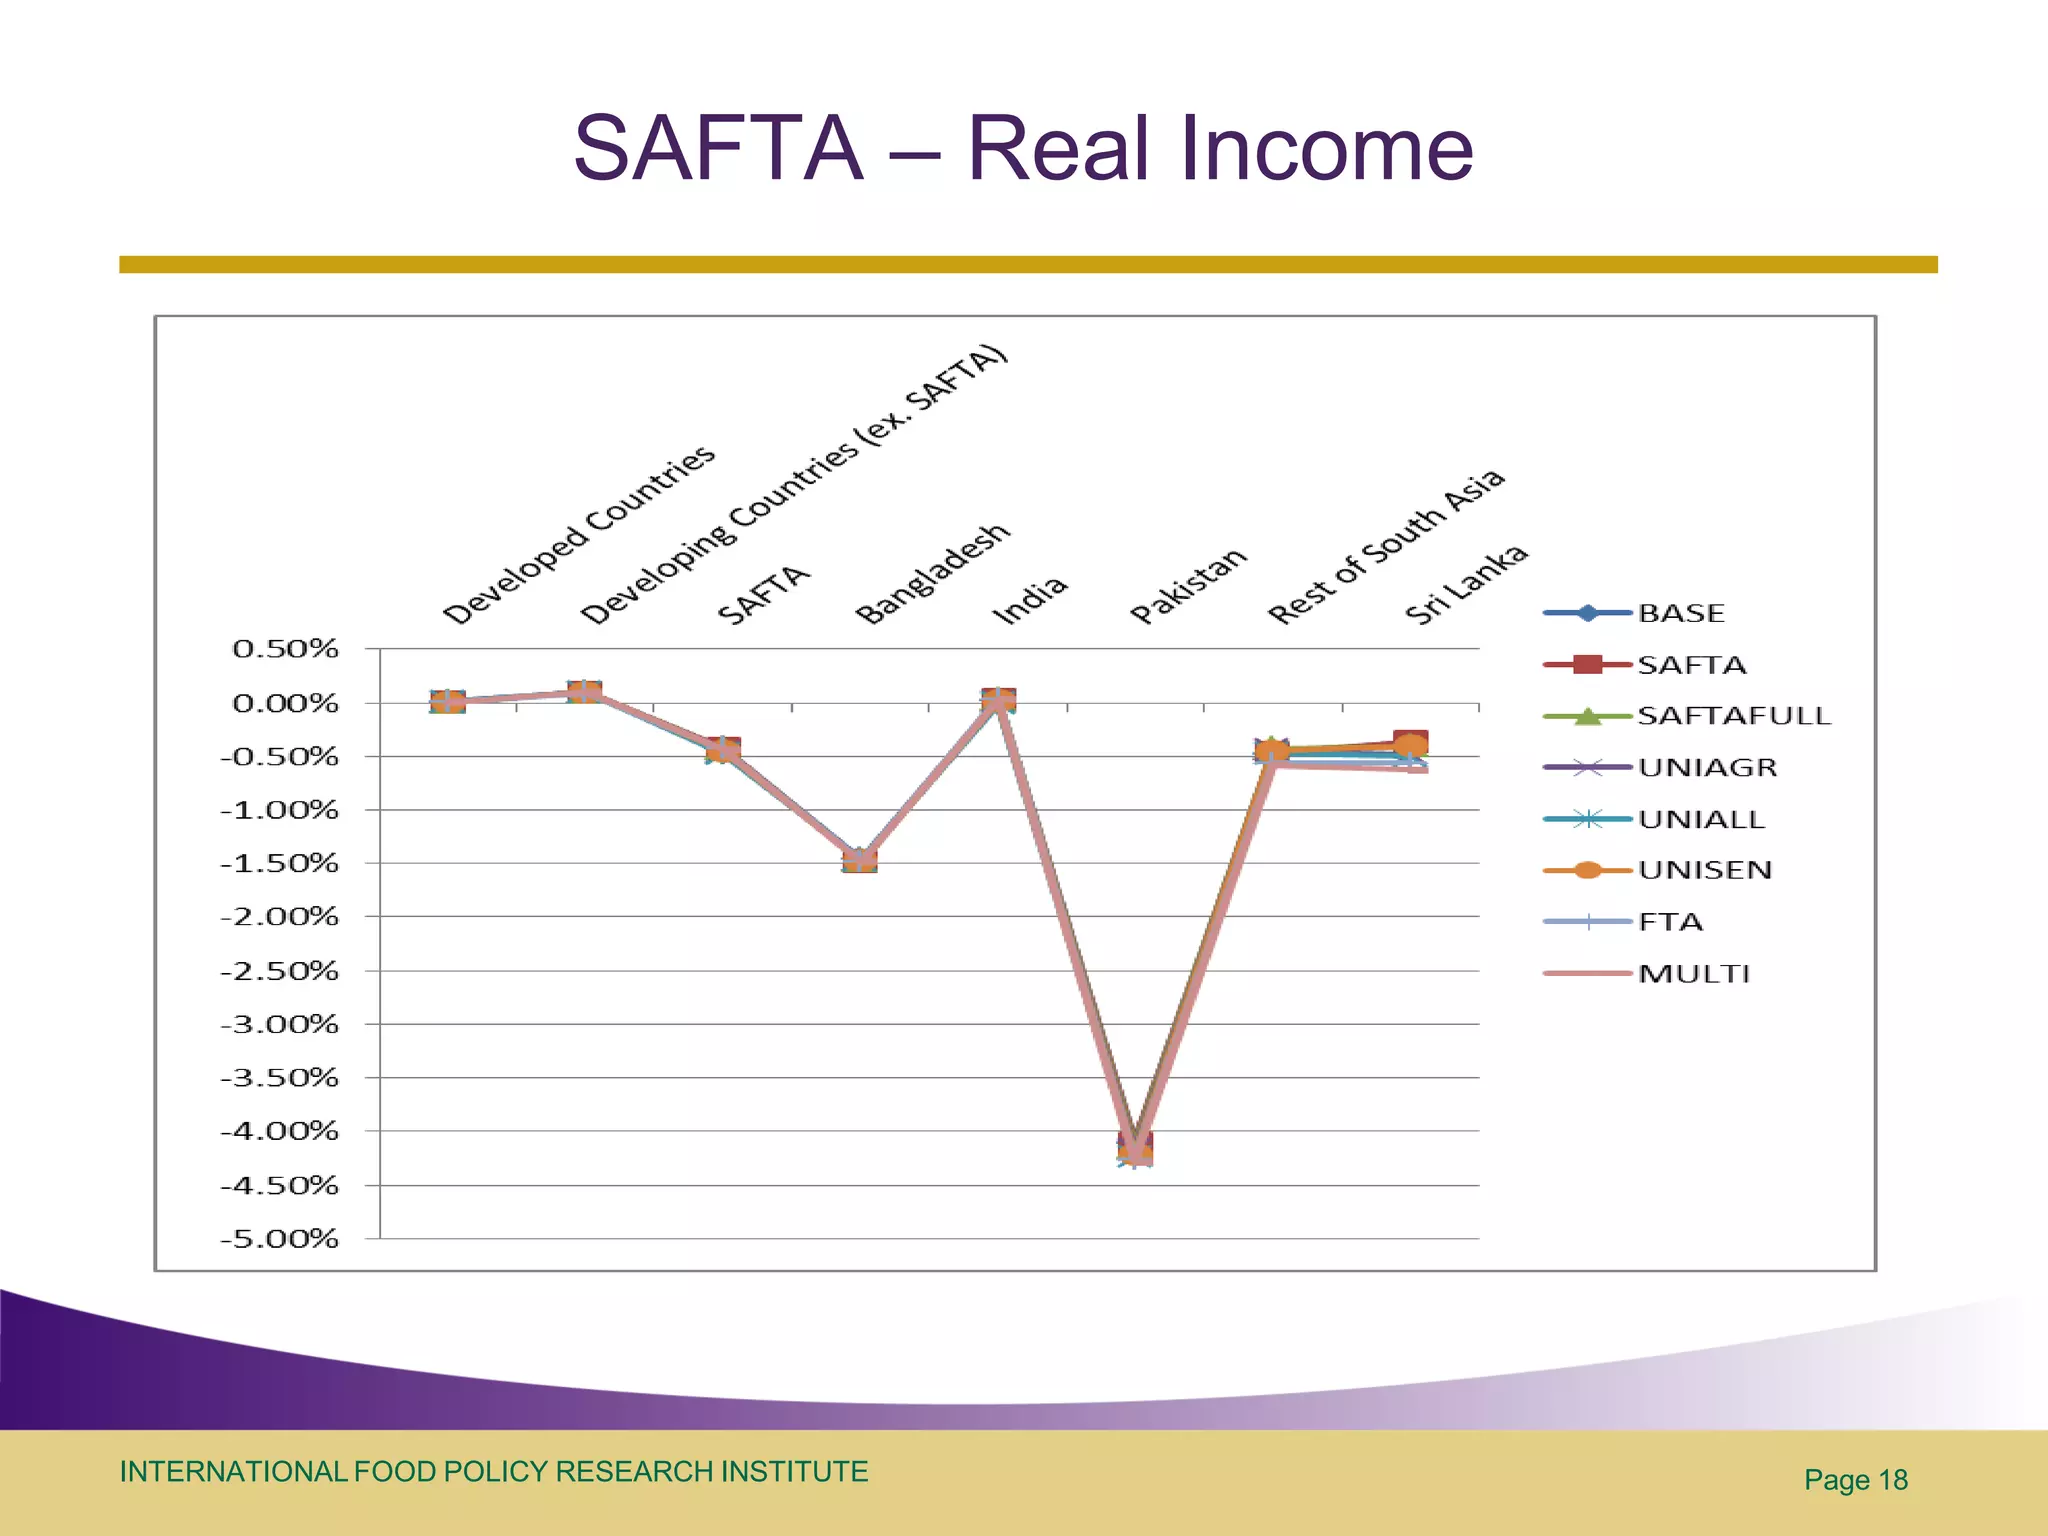
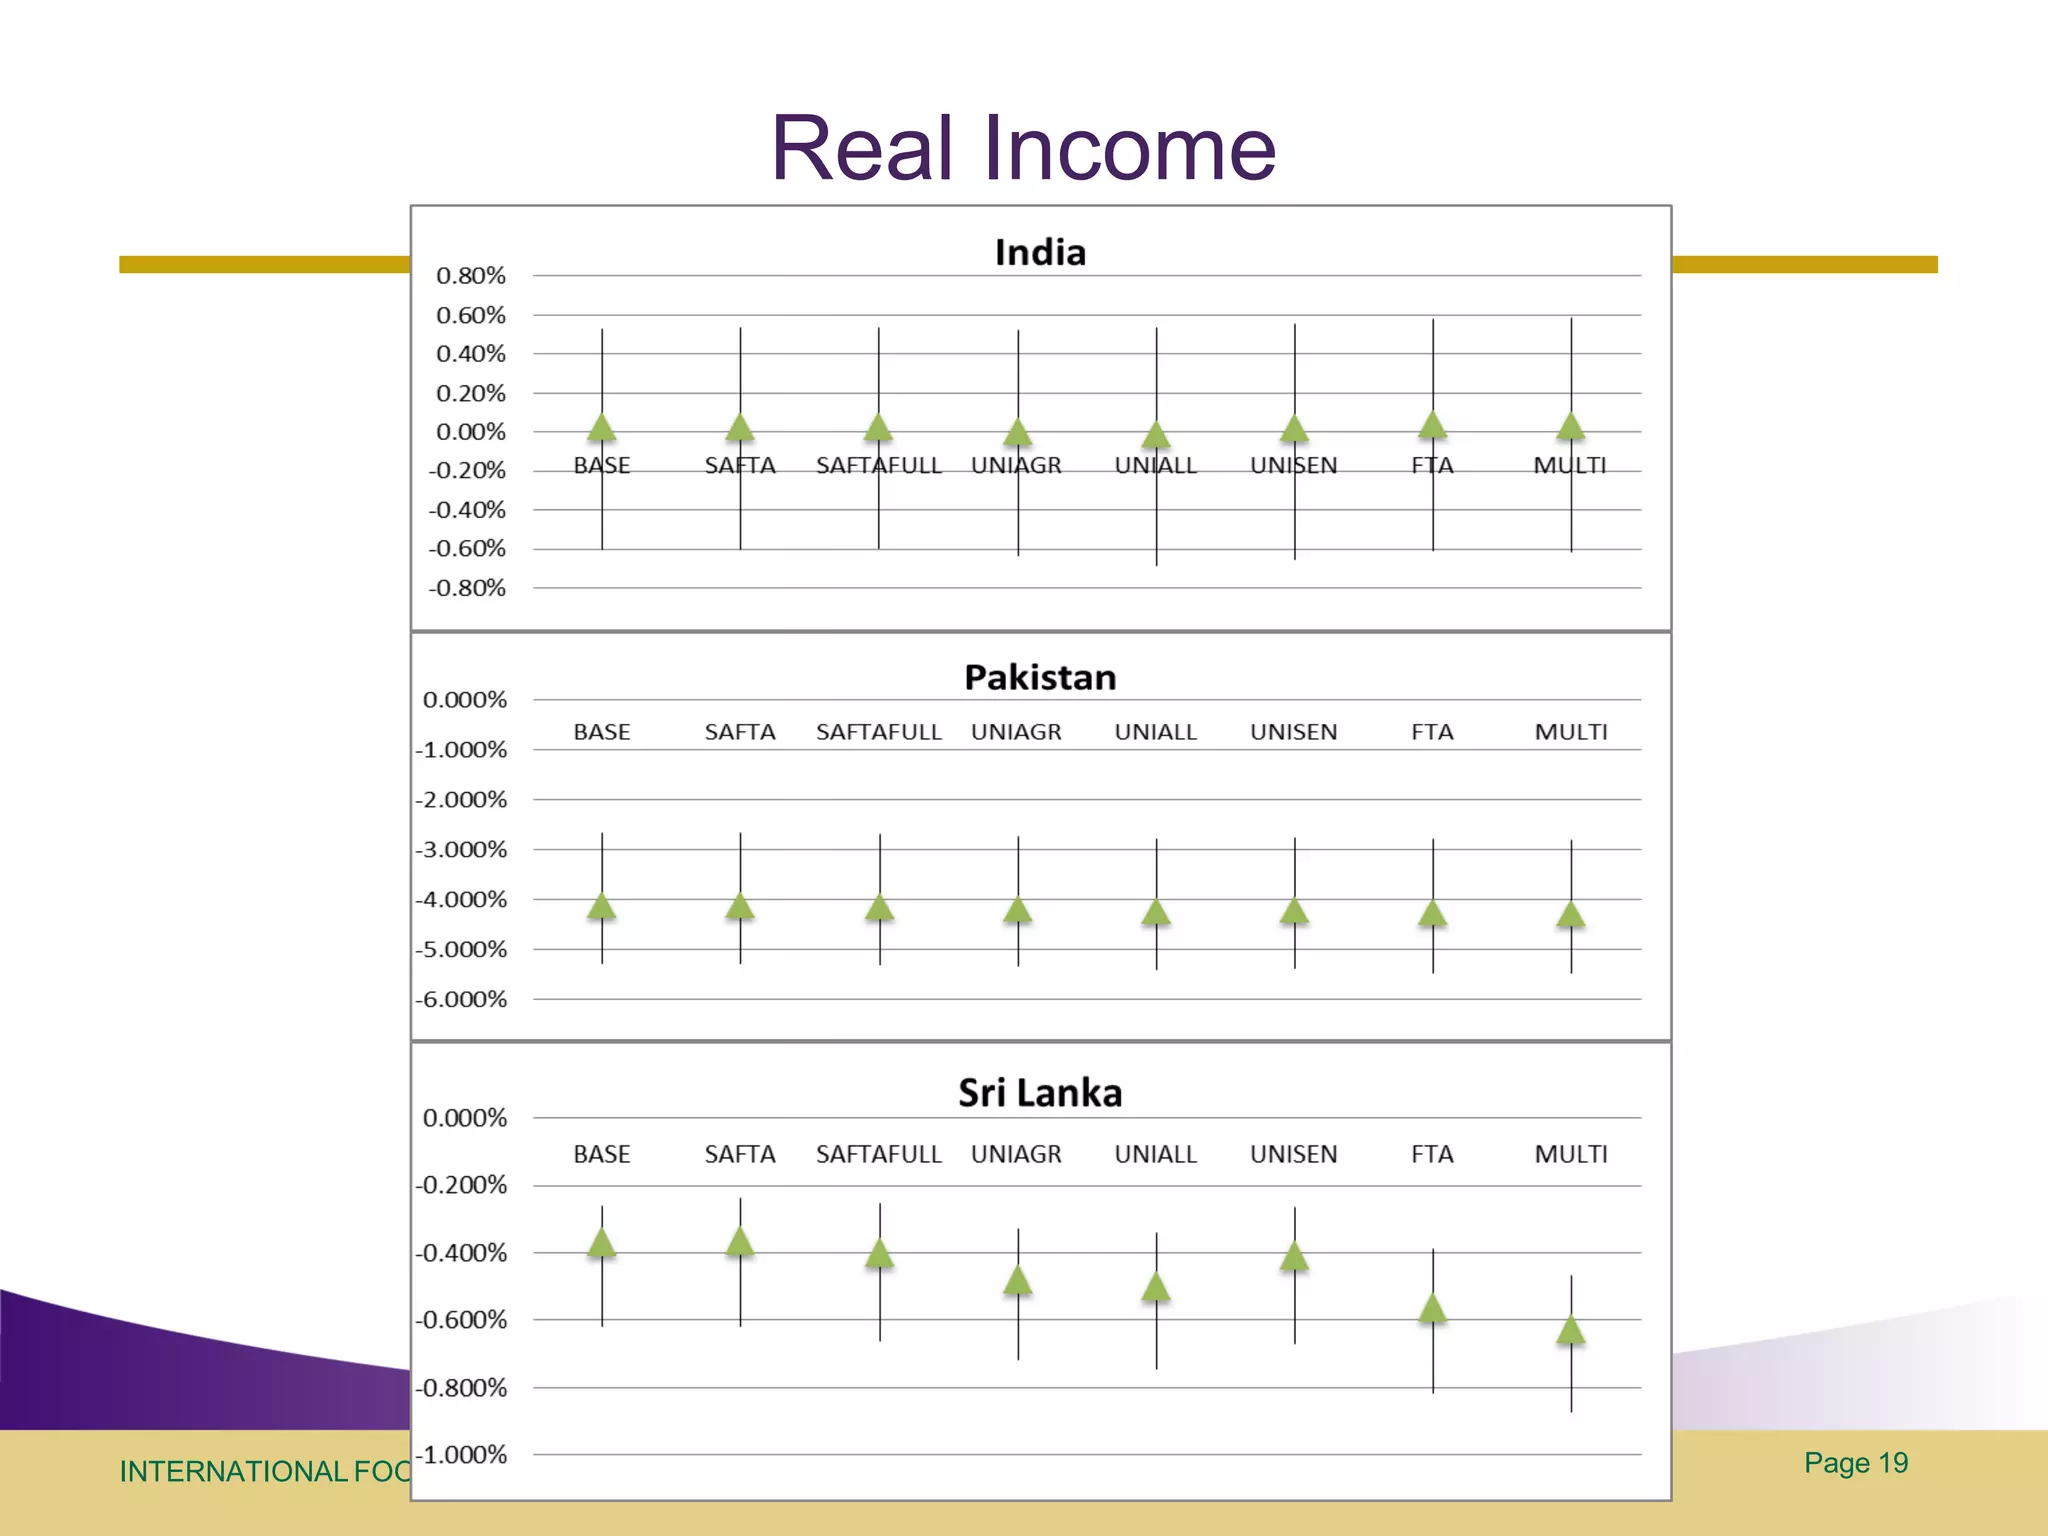
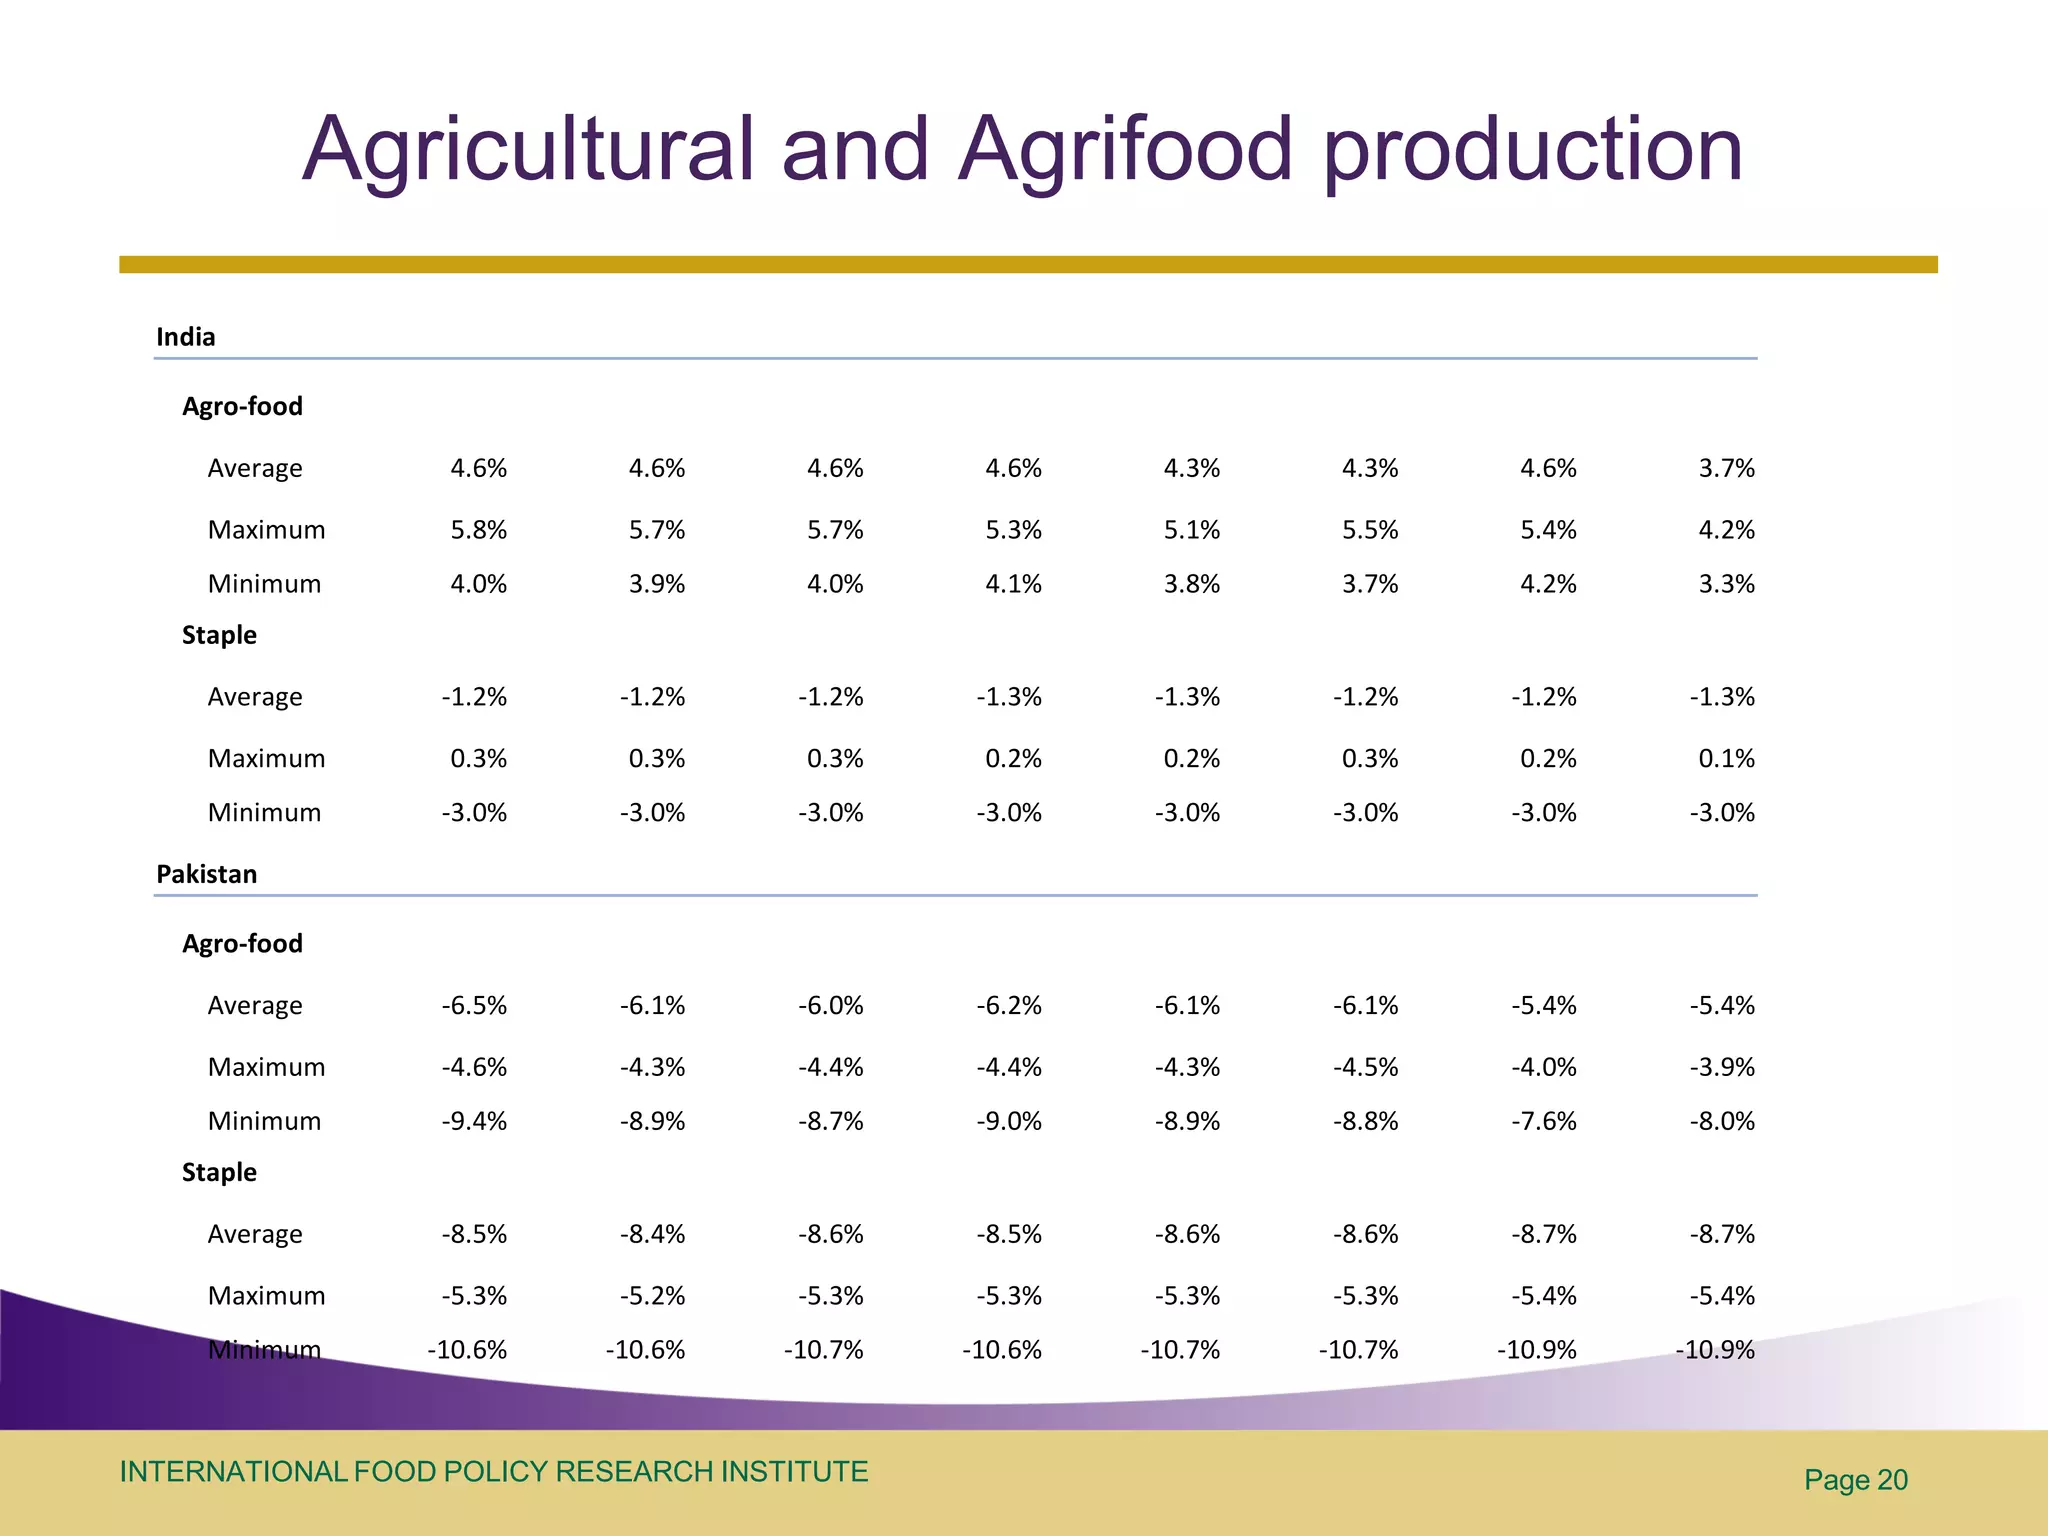
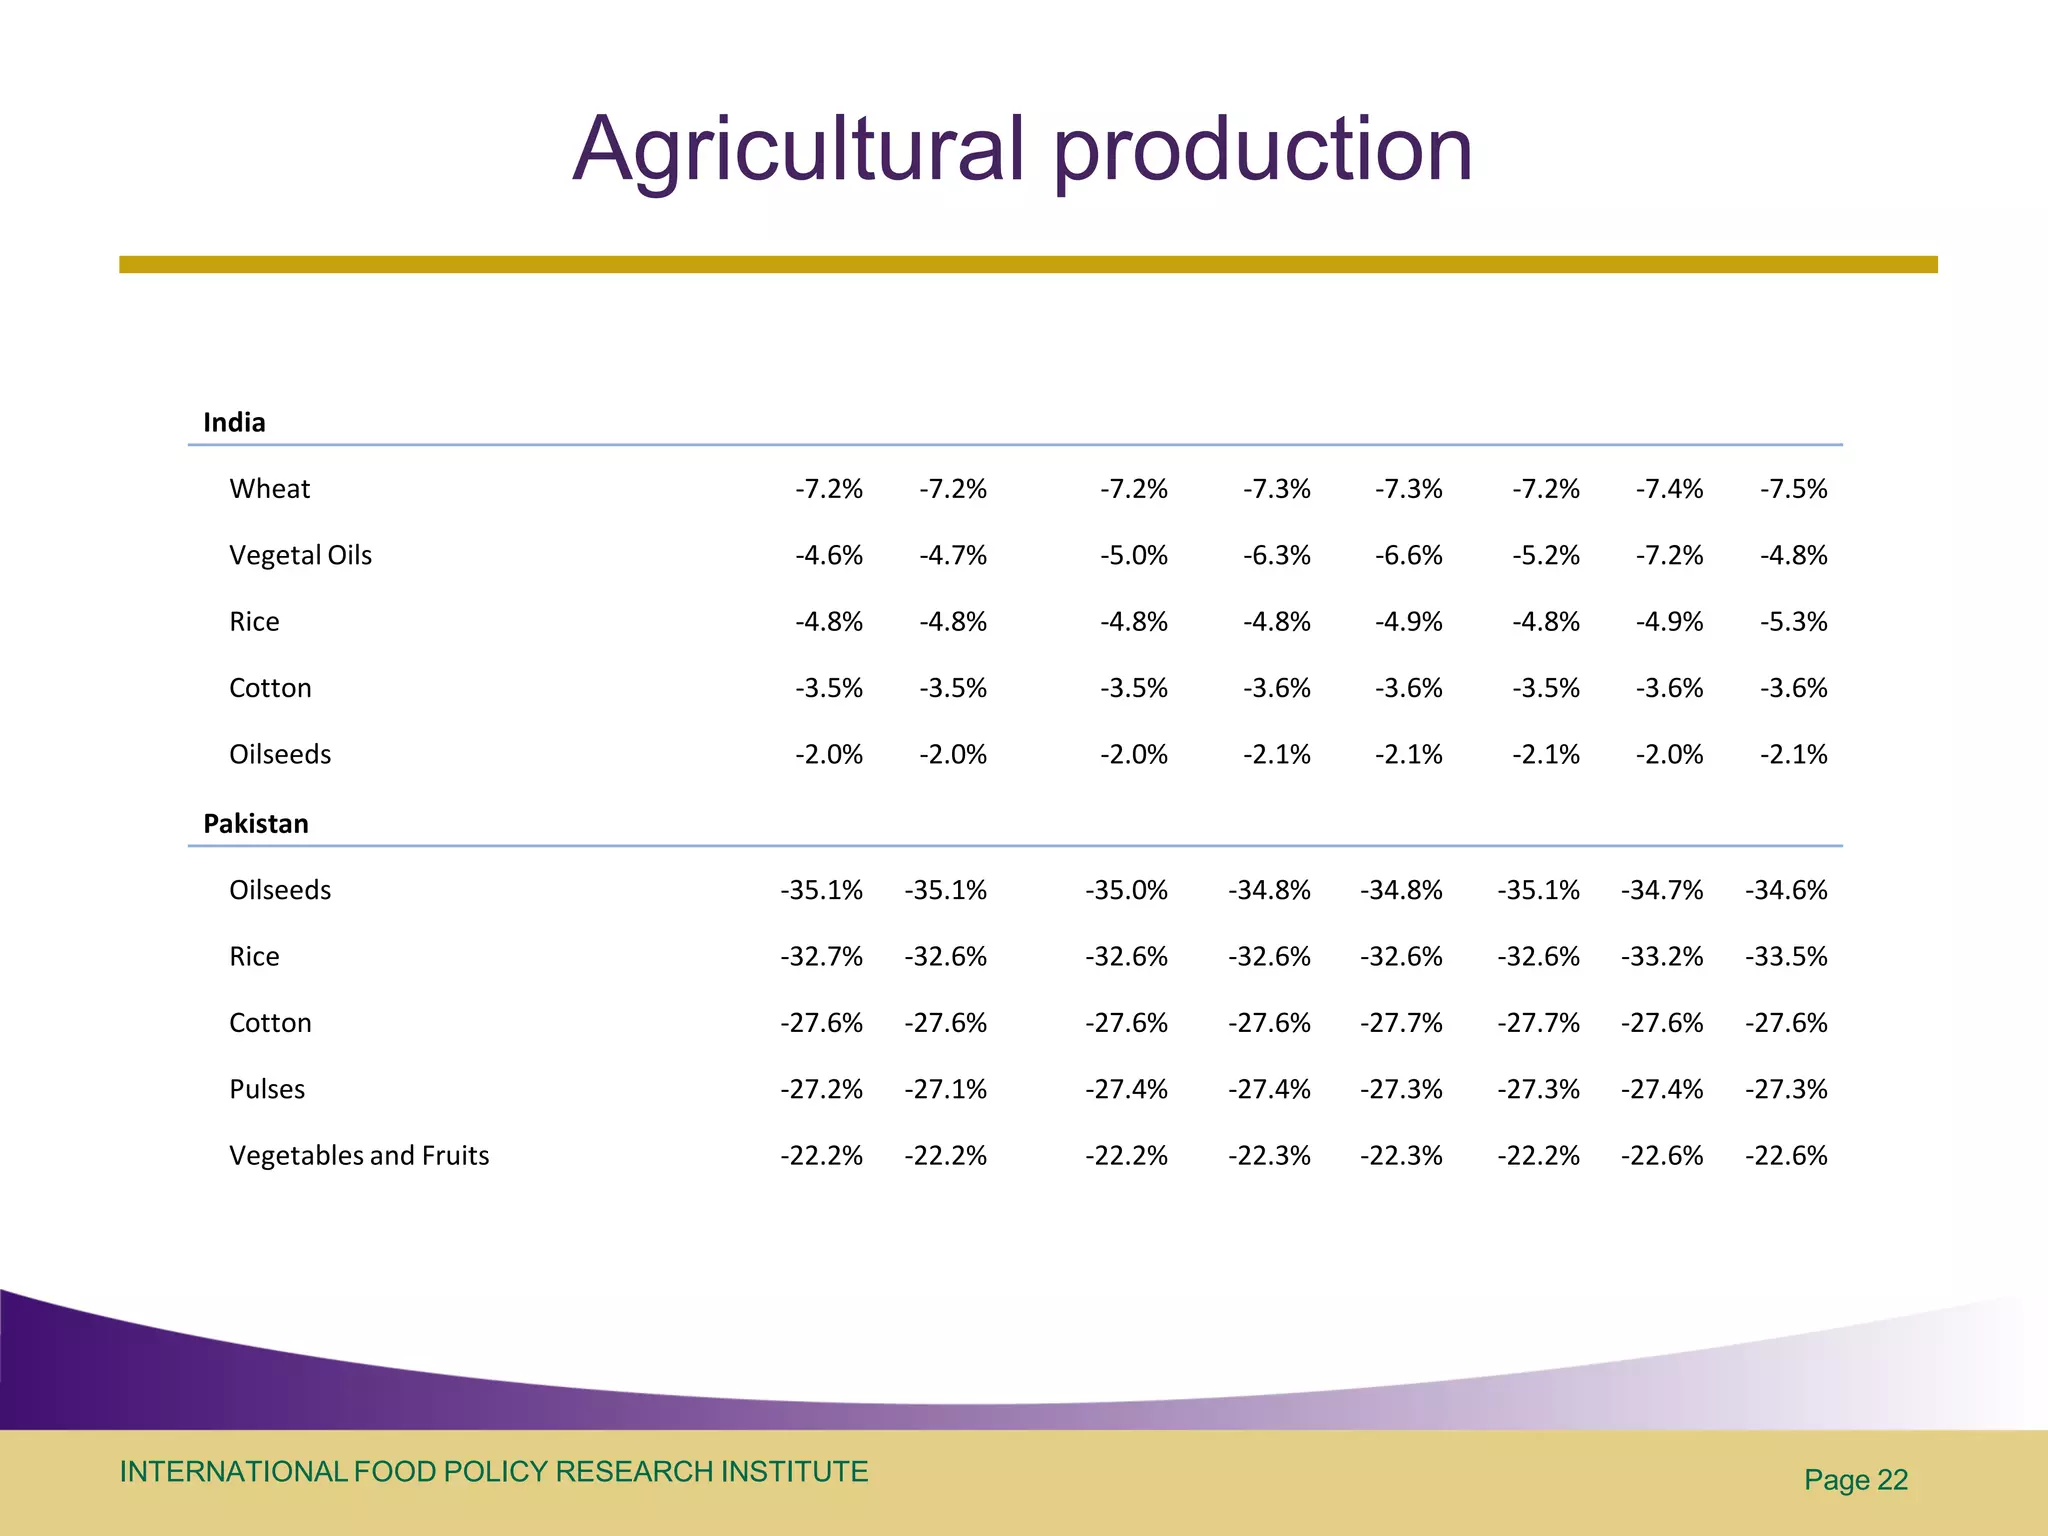
Download as PDF, PPTX
![Methodology
• GCM results [4 models x 3 baselines=12 scenarios]
• IMPACT Hydrology model
Climate Change • Changes in temperature and rainfall by Food Production Units
• IMPACT DSSAT modelling (5 representative crops)
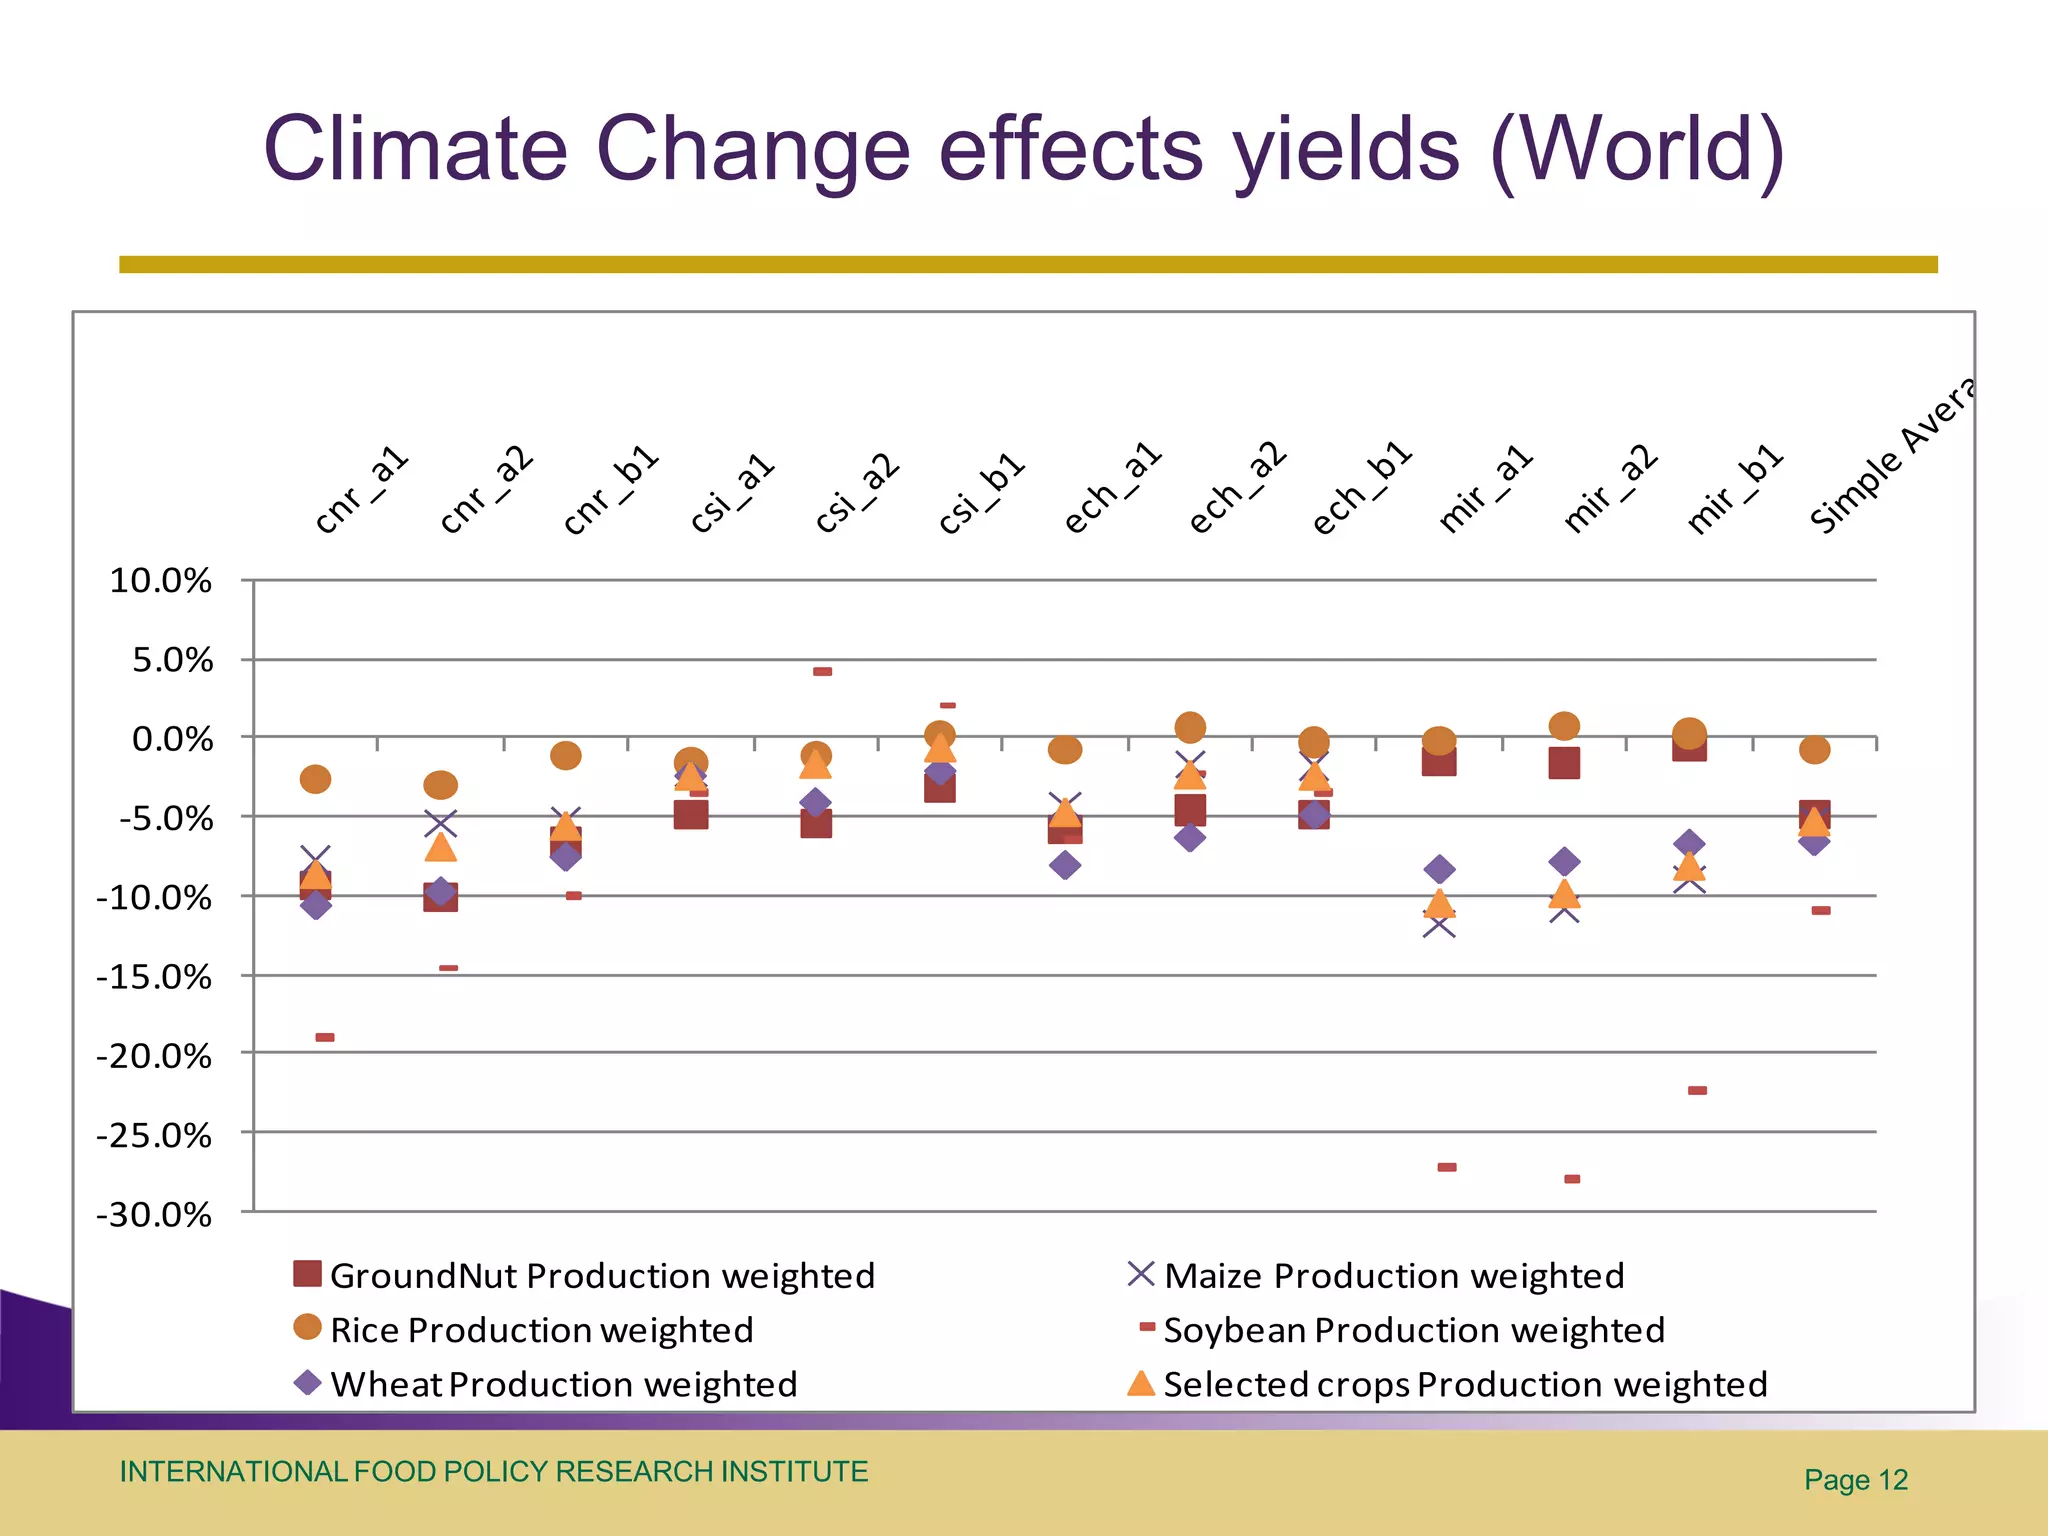
• Changes in Yield due to Climate Change evolution (temperature and rainfall for rainfed
Exogenous agriculture, temperature for irrigated agriculture)
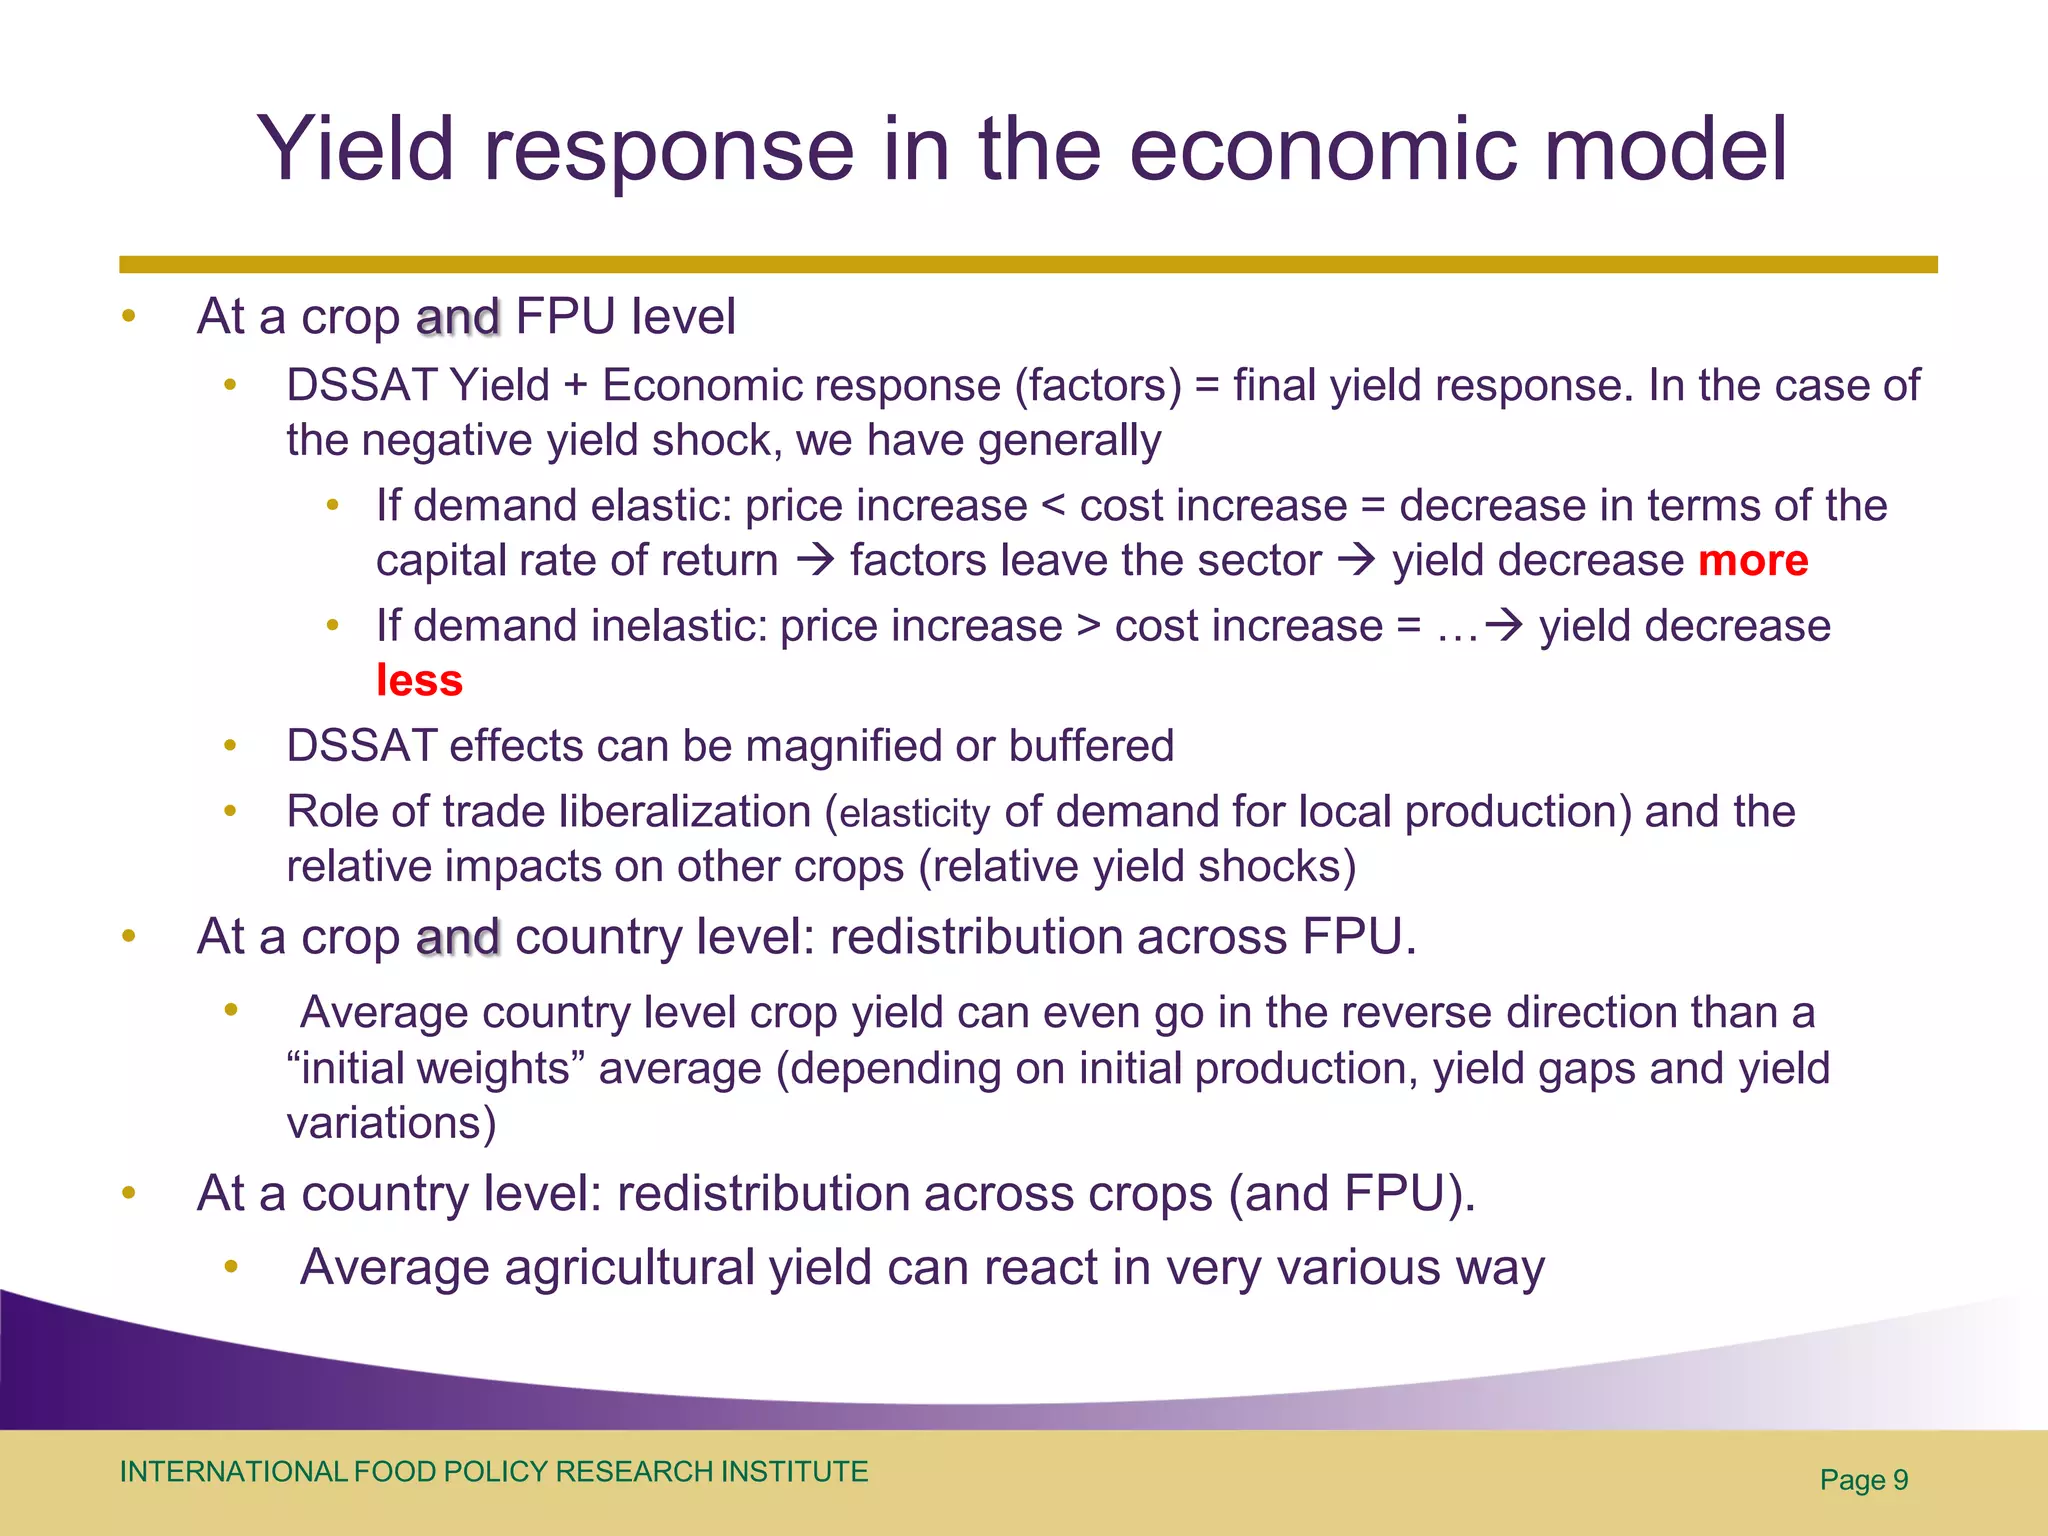
Yield Response
due to Climage
Change
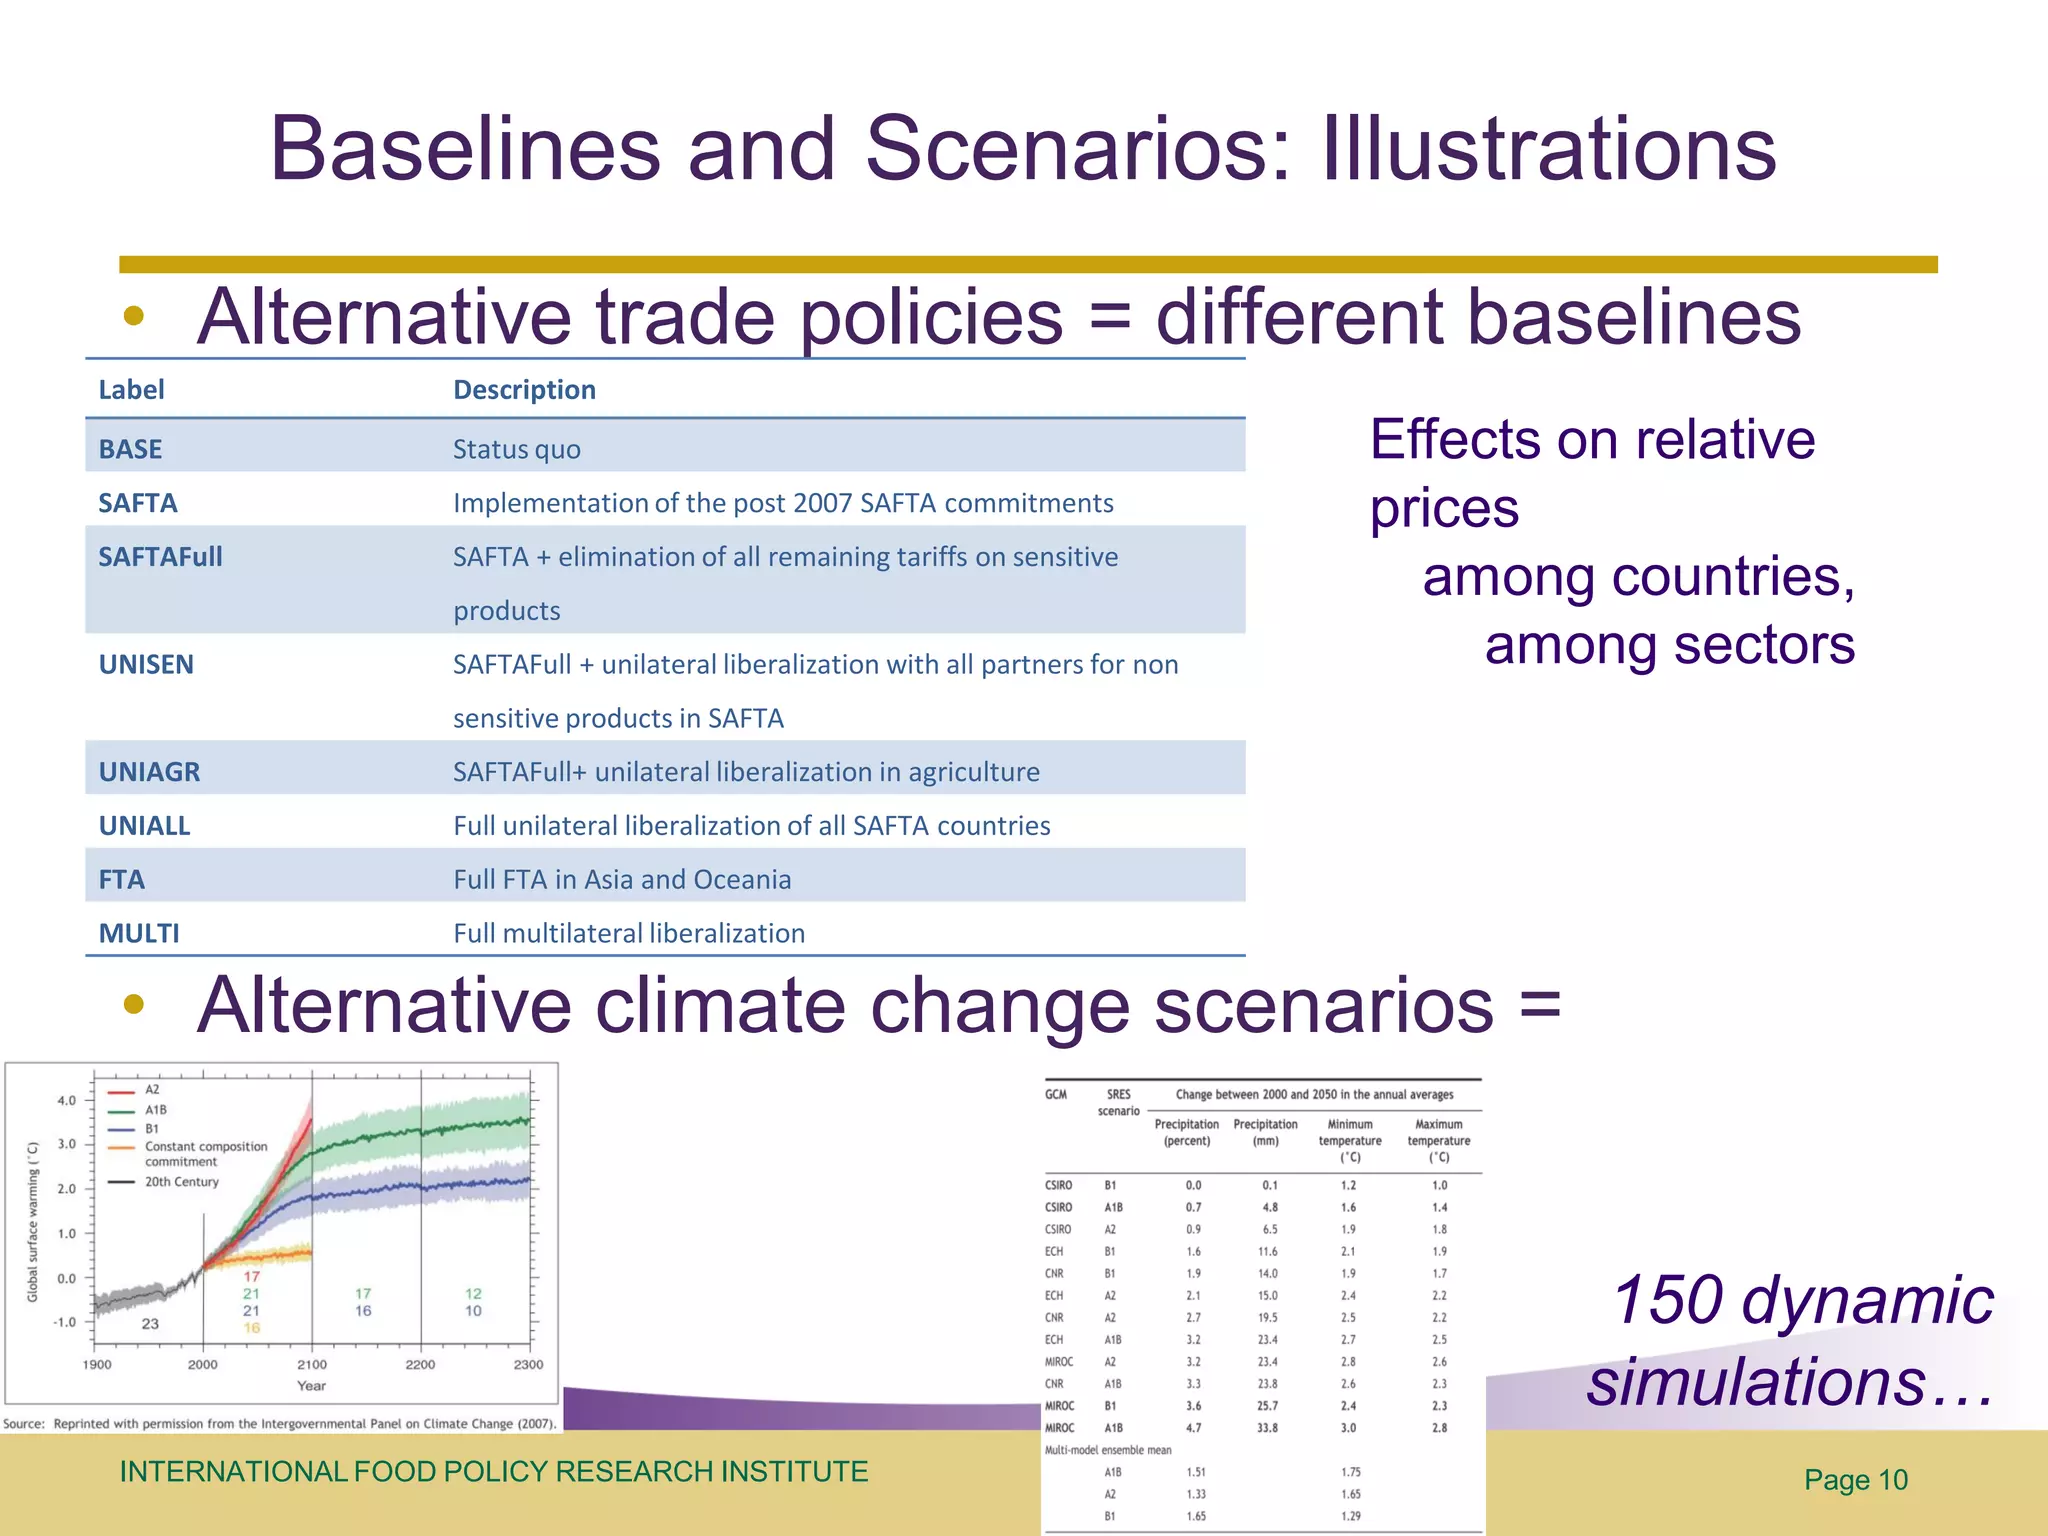
• MIRAGE simulations: economic and demographic baselines with alternative trade policy
options
Economic • Endogenous economic response of yields
results • Results in terms of different economic indicators
INTERNATIONAL FOOD POLICY RESEARCH INSTITUTE Page 3](https://image.slidesharecdn.com/ccday2s2laborde-110621143822-phpapp01/75/Climate-Change-and-Agriculture-Change-in-Yields-in-a-global-CGE-MIRAGE-CC-4-2048.jpg)


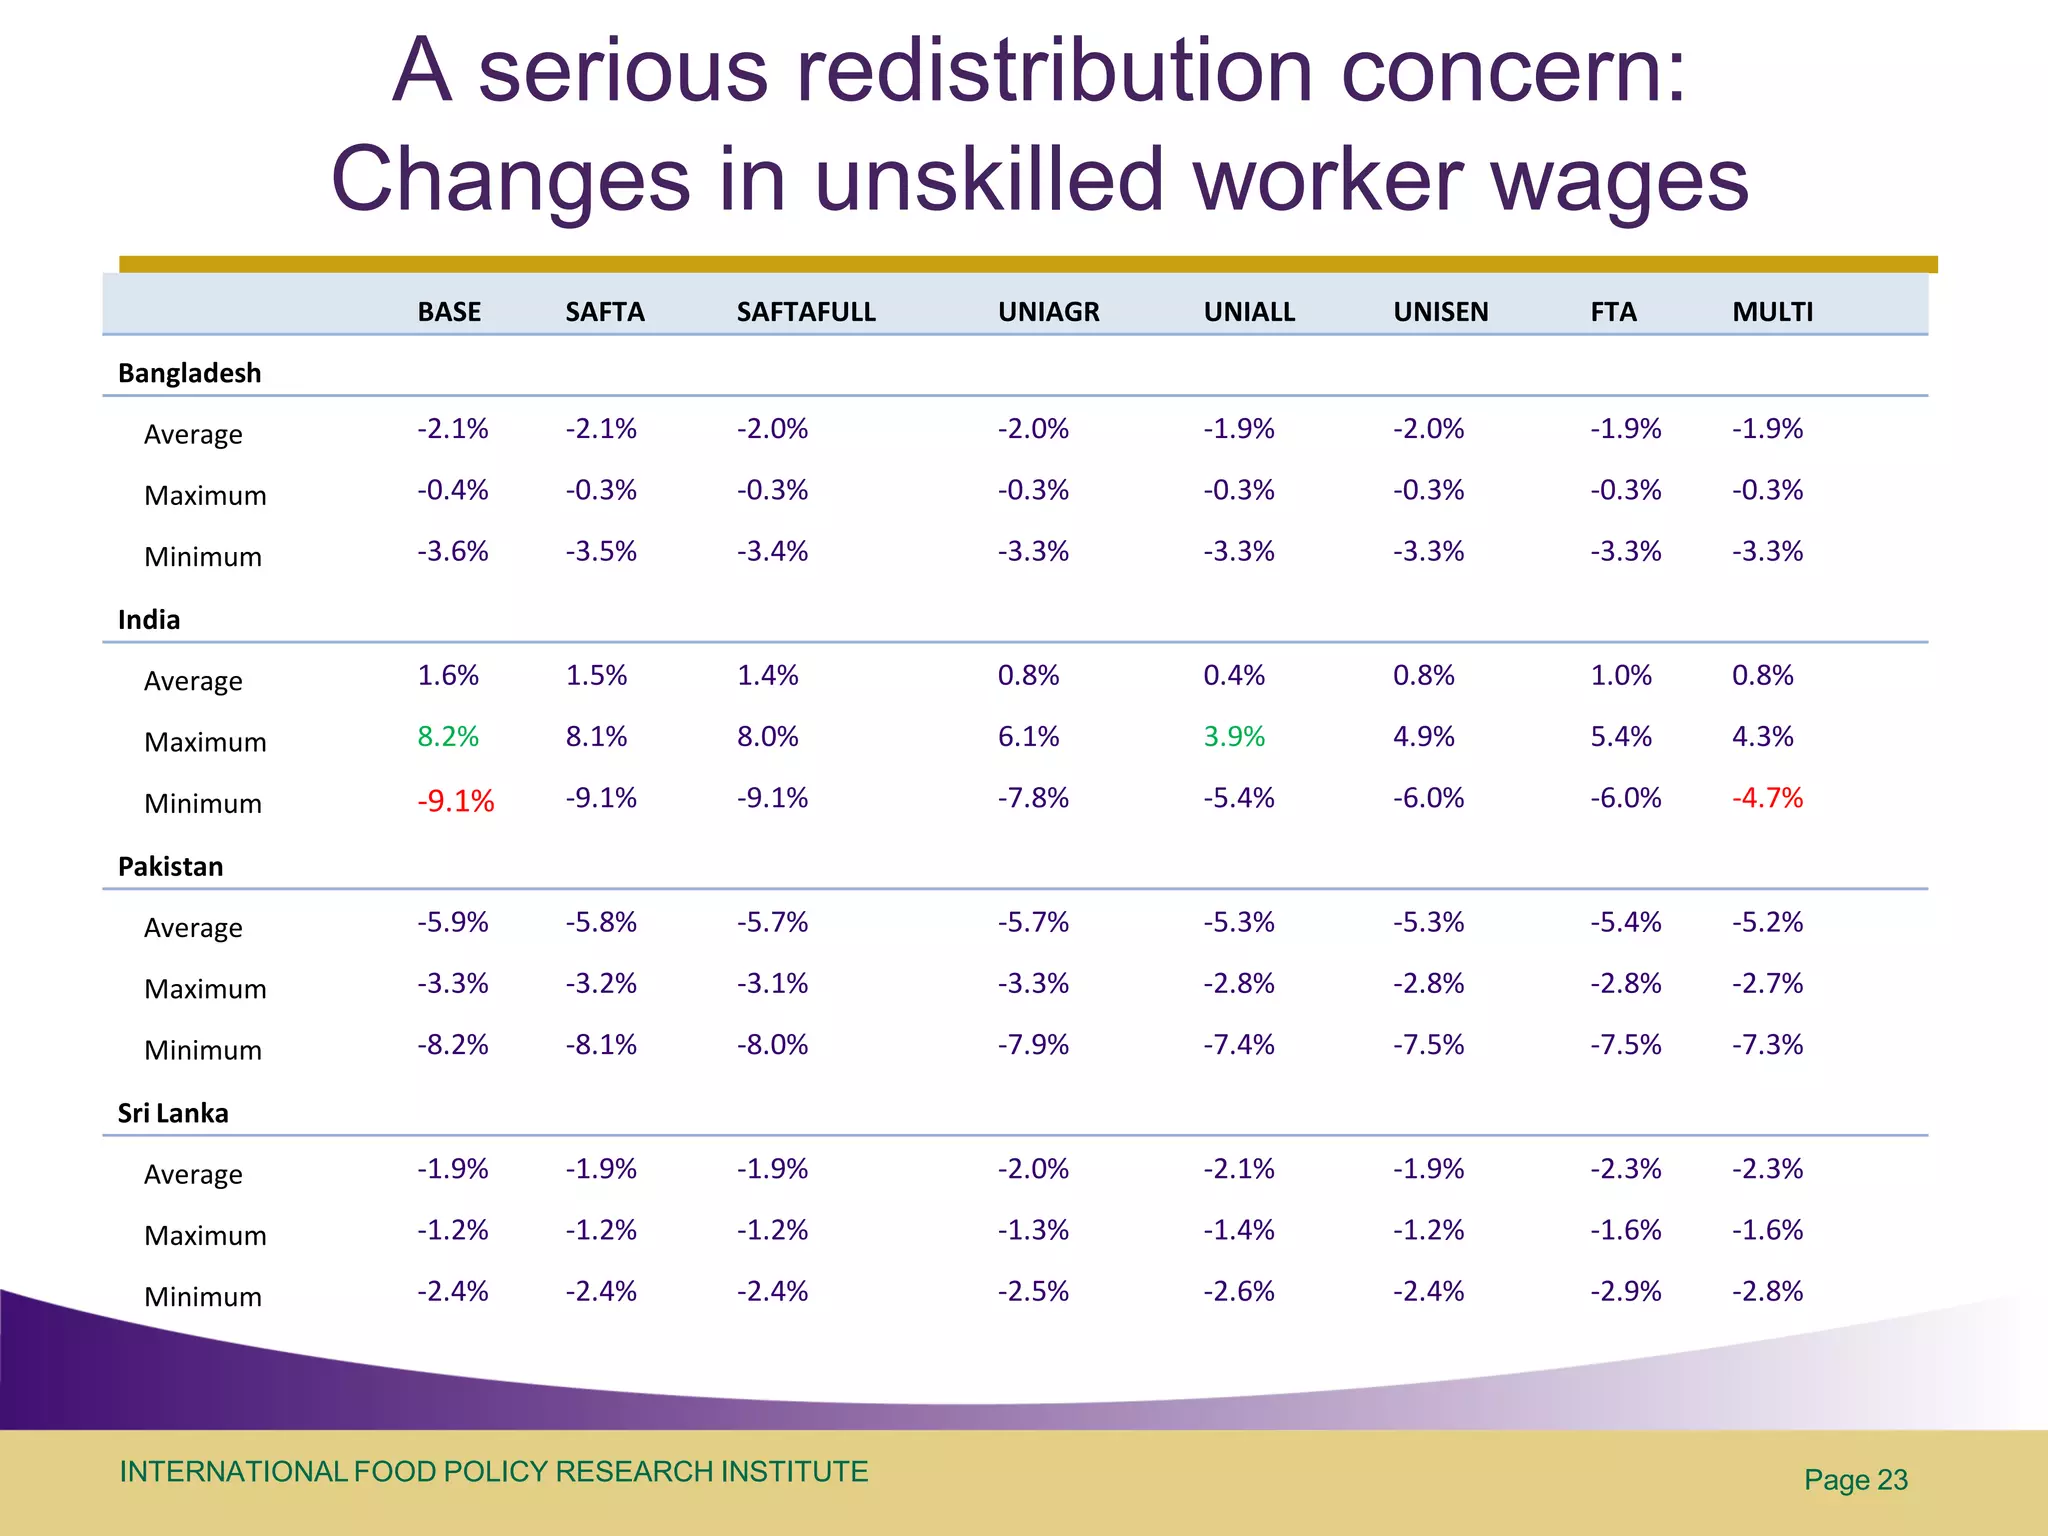
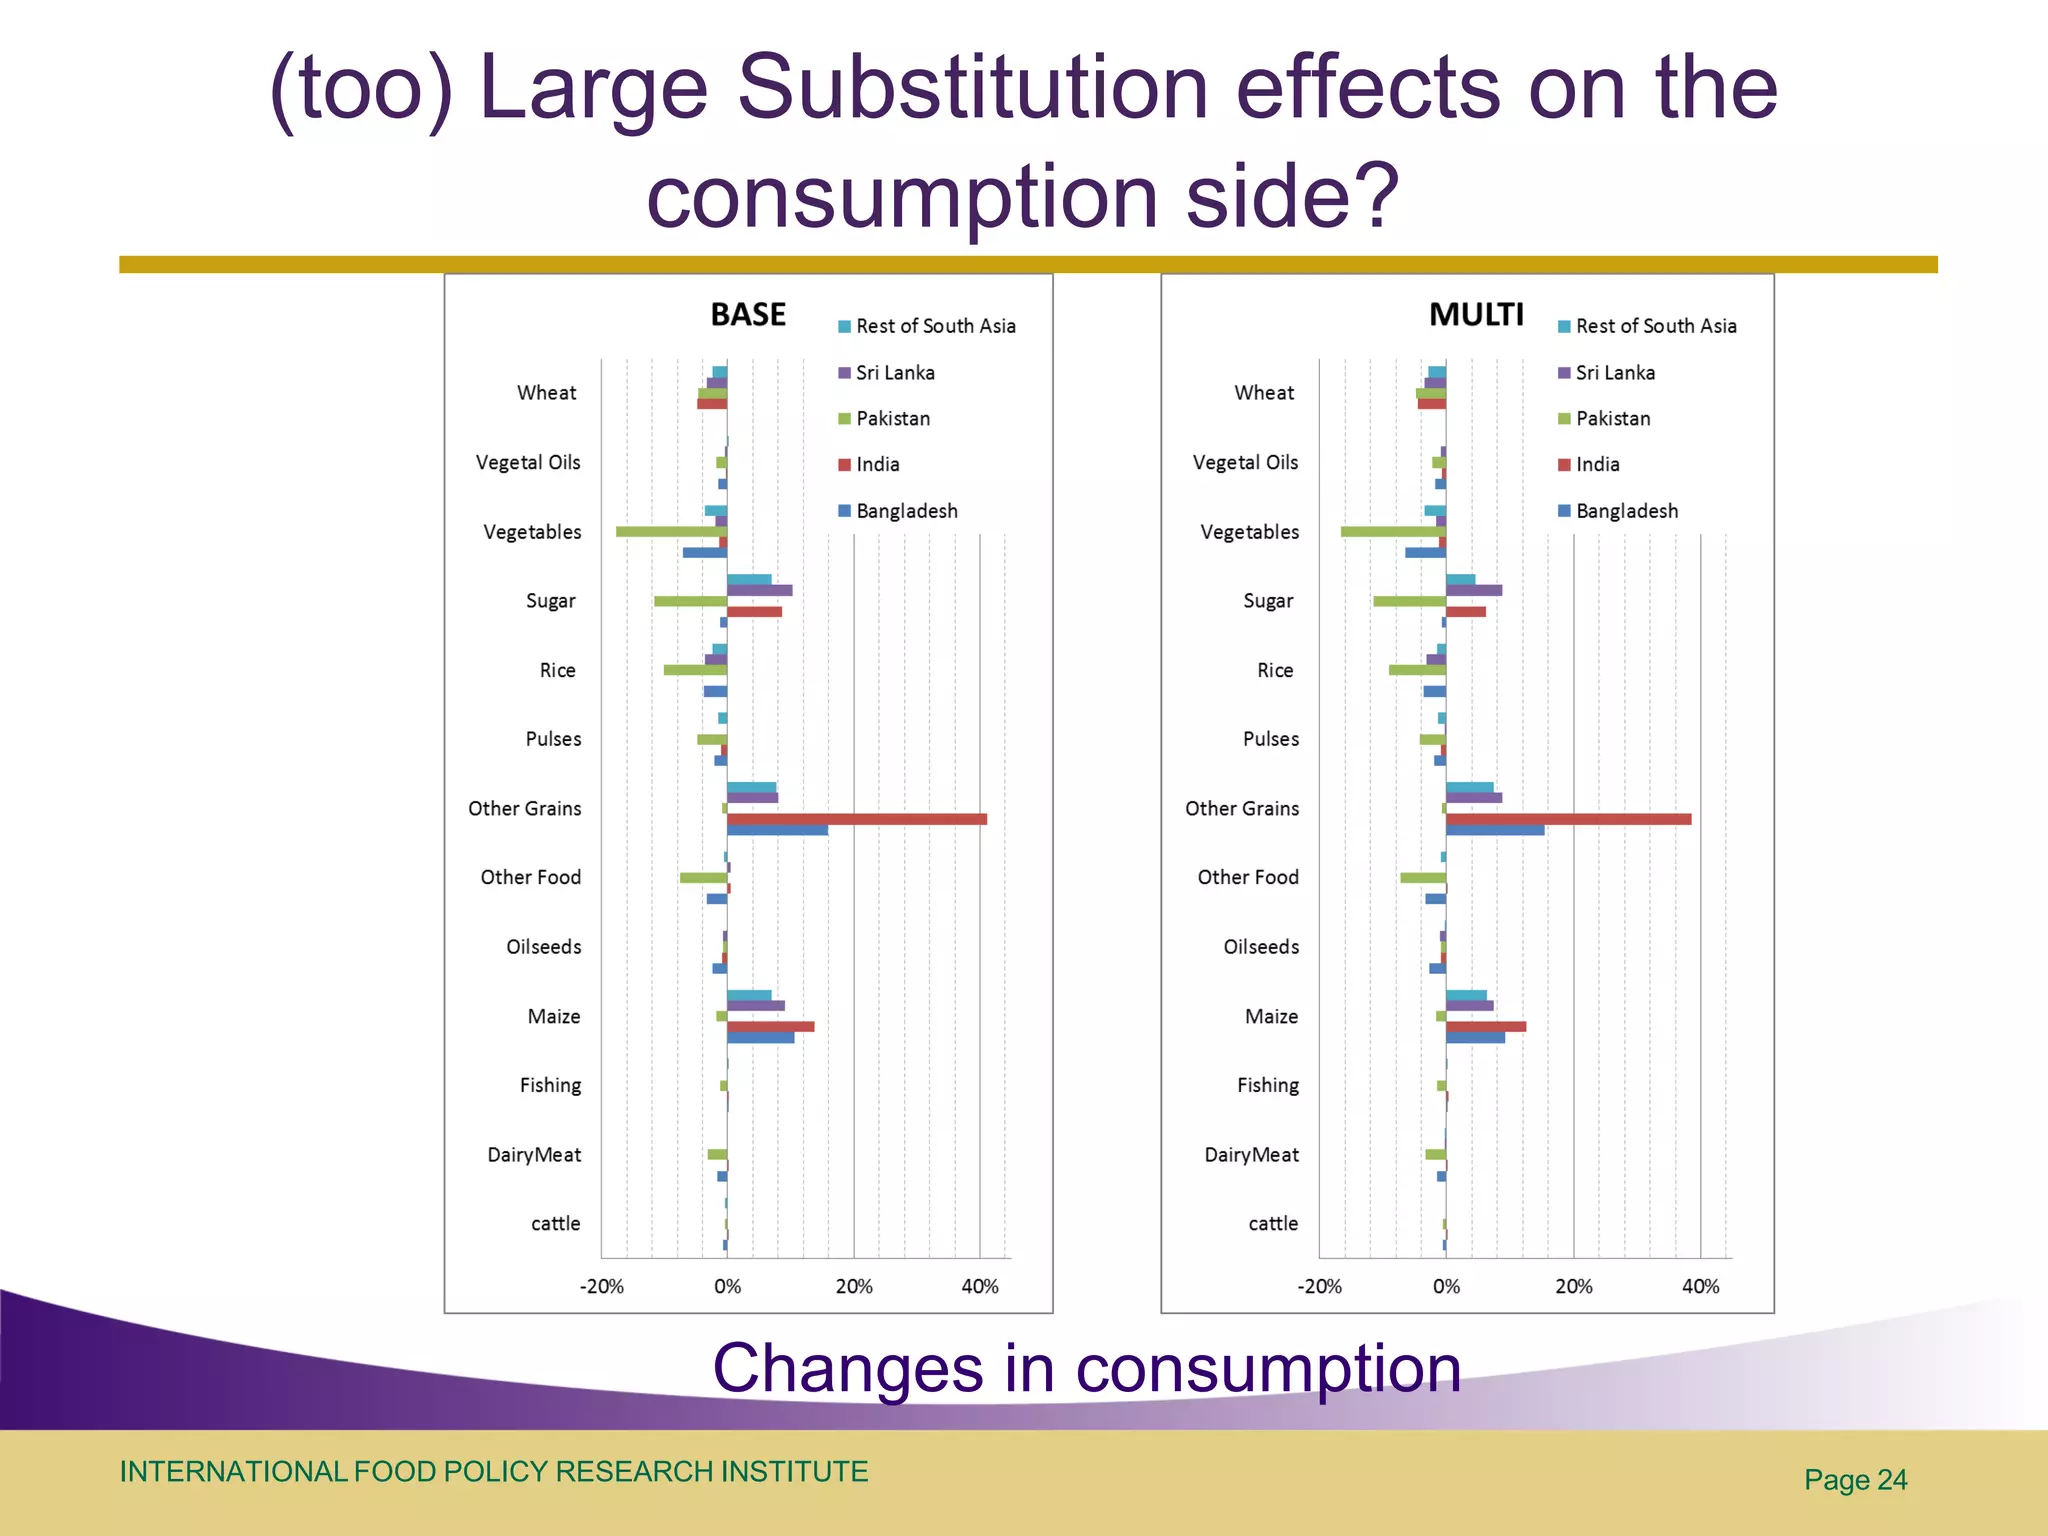
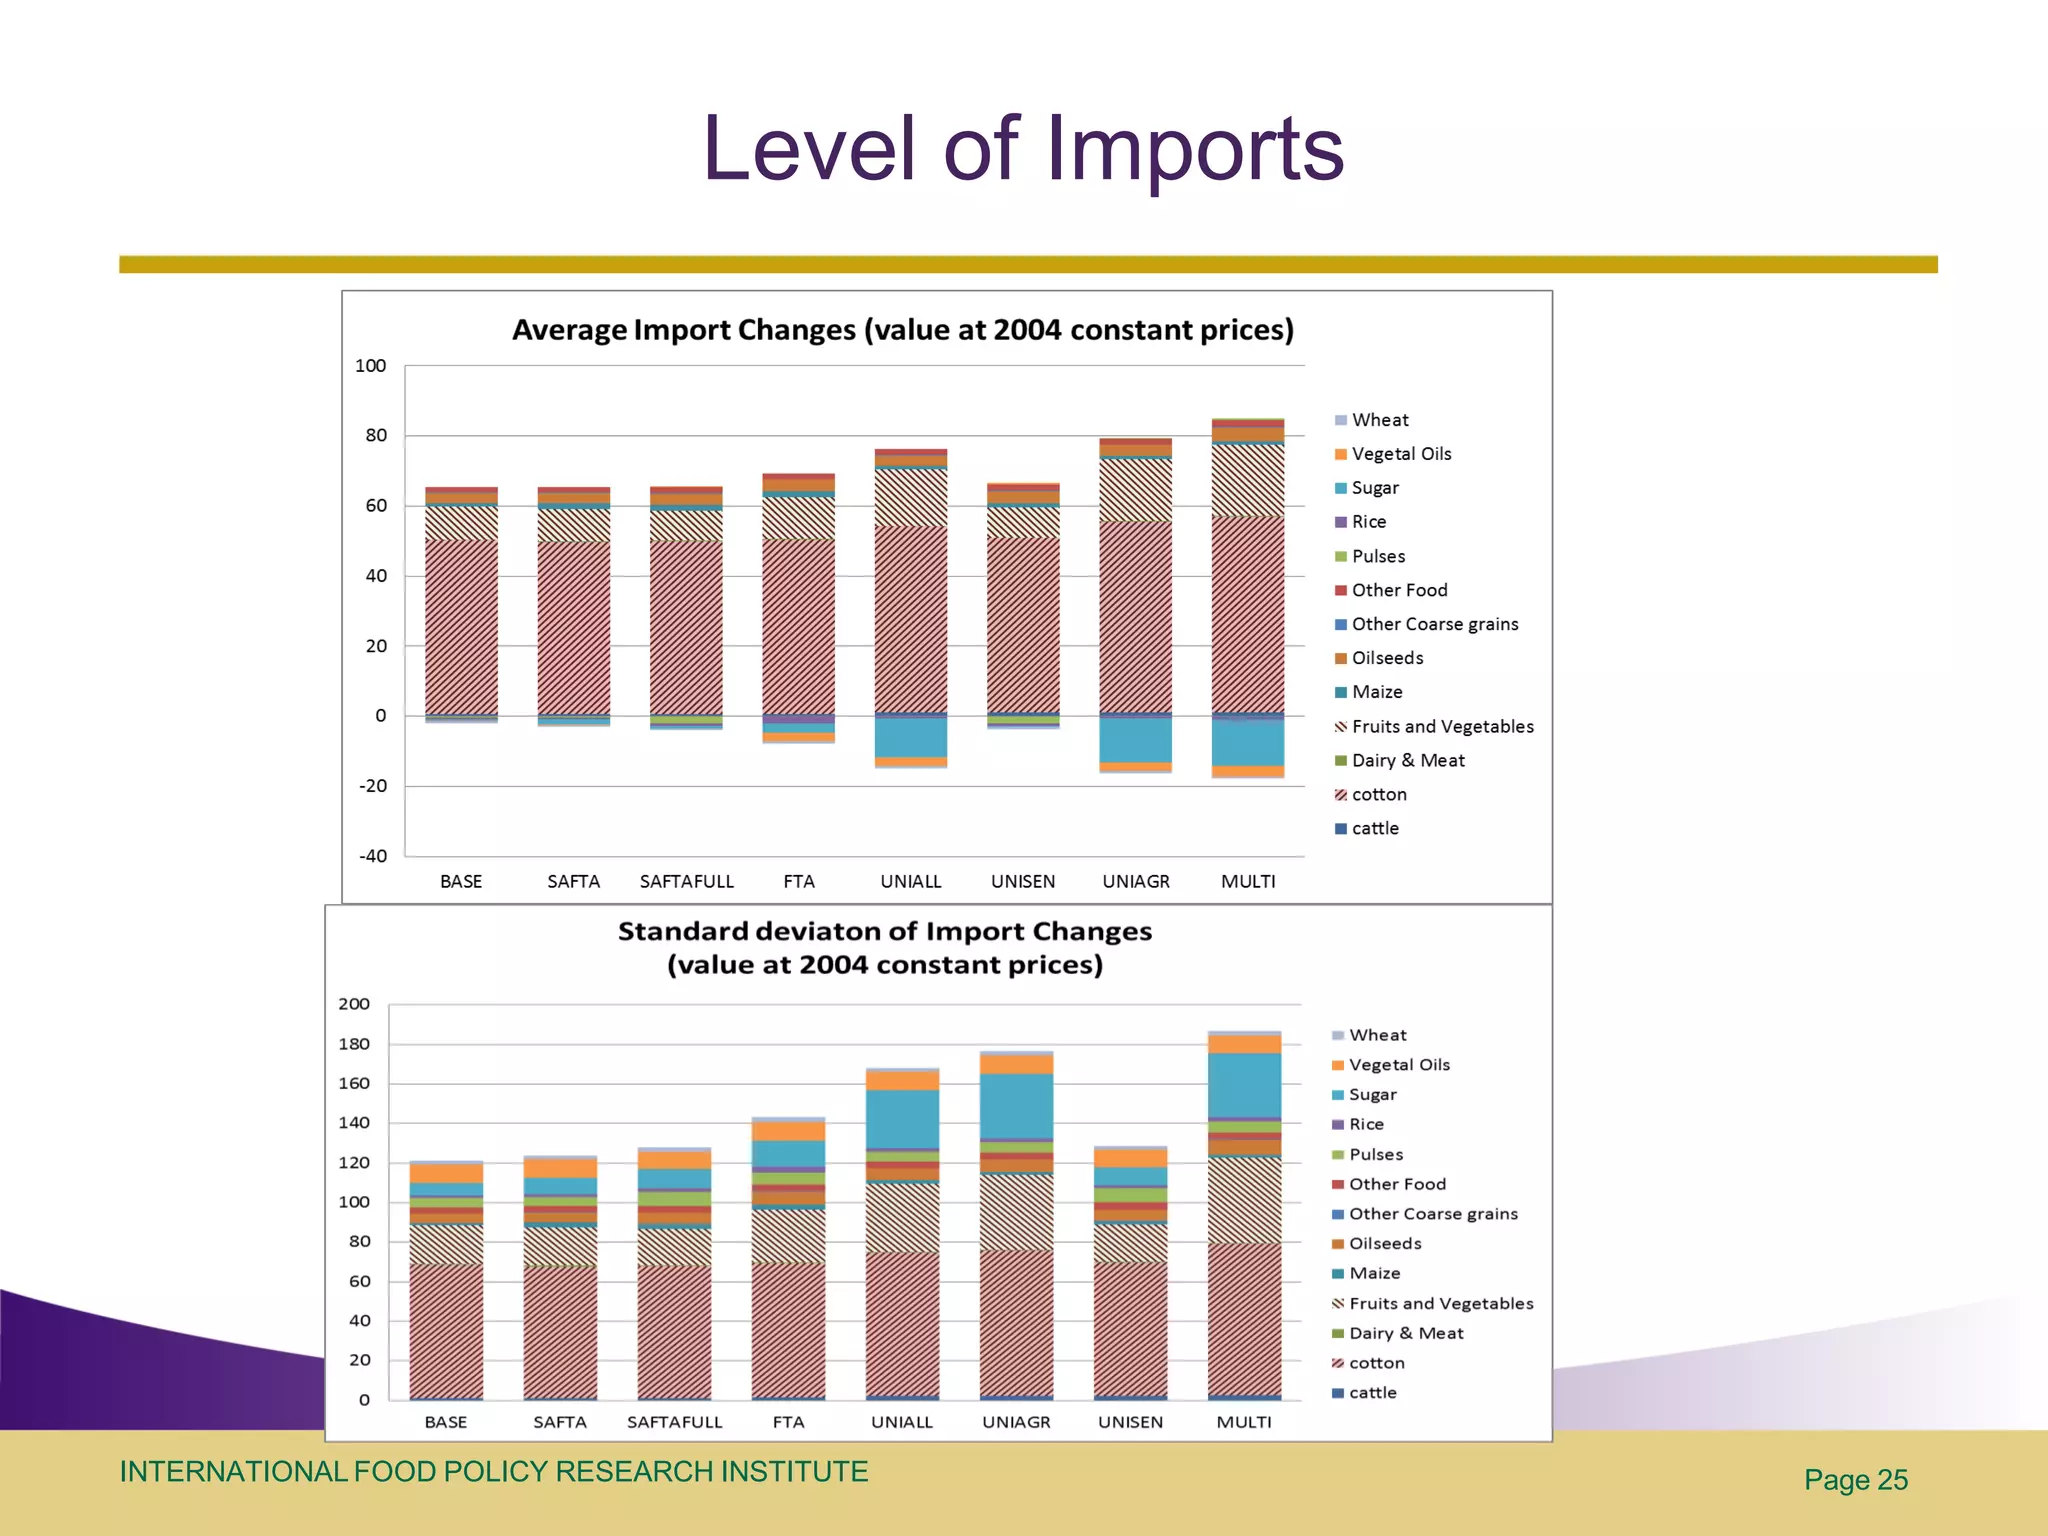
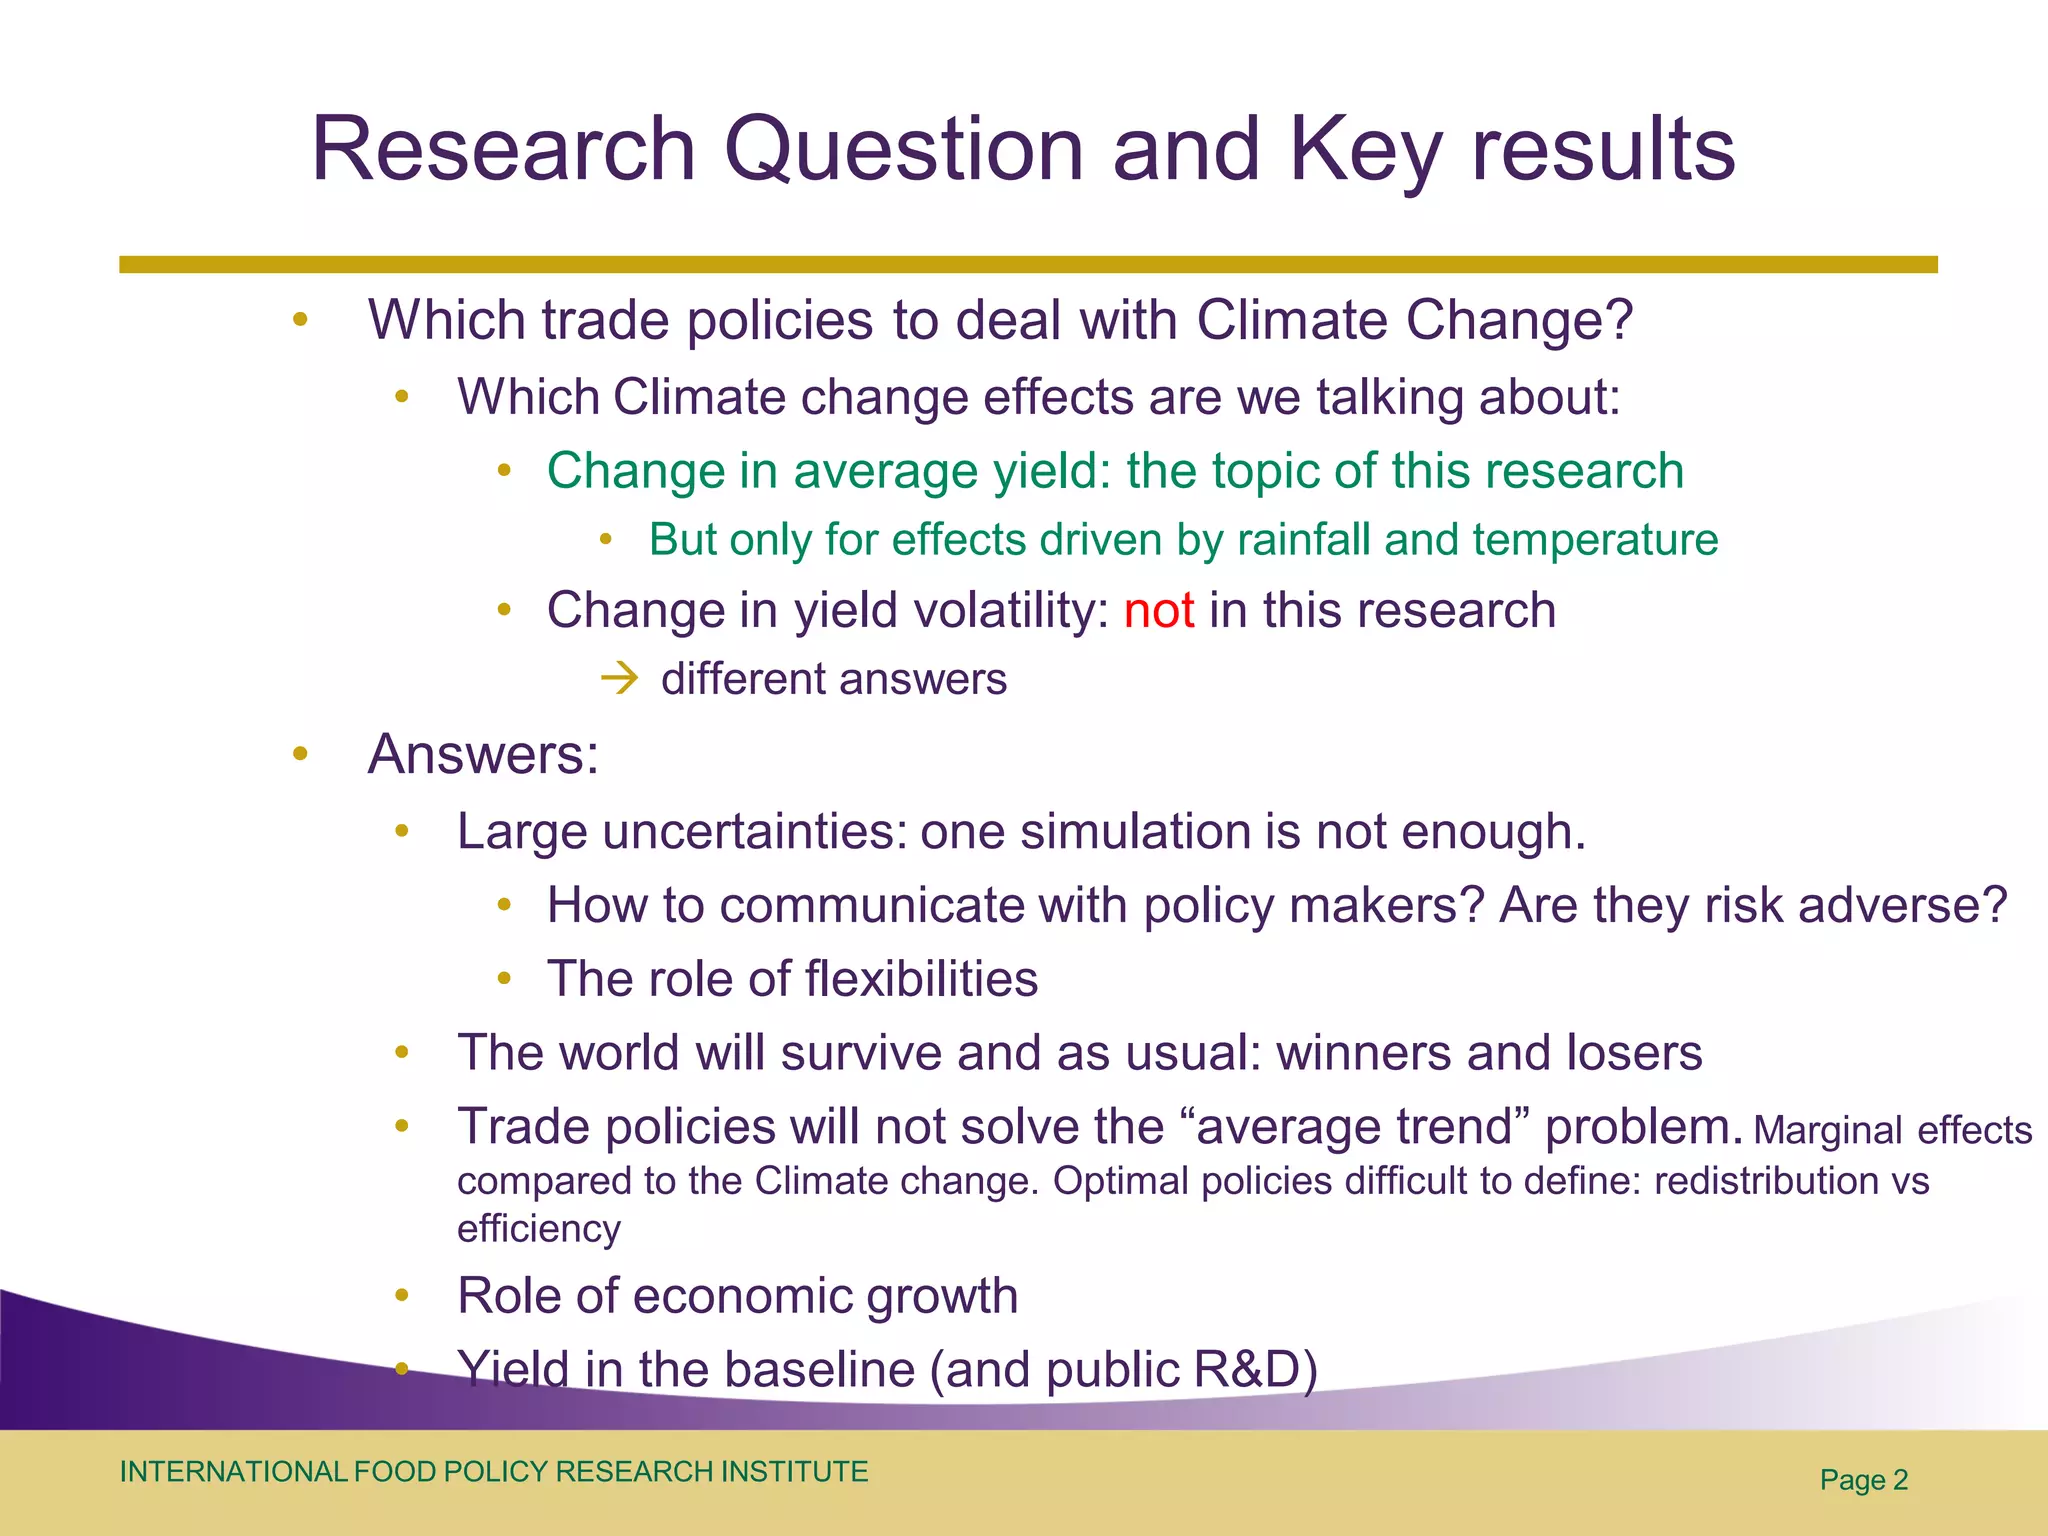
The document presents research on the impact of climate change on agricultural yields using the MIRAGE-CC model, focusing on the effects of temperature and rainfall. It discusses trade policy implications, economic responses, and the variability of yield changes across different crops and regions, highlighting uncertainties and the need for effective communication with policymakers. Conclusively, it emphasizes the limited macroeconomic effects of climate change on average yields, while stressing the importance of addressing distributional impacts on poorer populations.


![[Day 2] Center Presentation: IFPRI](https://cdn.slidesharecdn.com/ss_thumbnails/cgiar-csi-day2-1apr2009-center-ifpri-090405003244-phpapp02-thumbnail.jpg?width=640&height=640&fit=bounds)


