
Download as PDF, PPTX
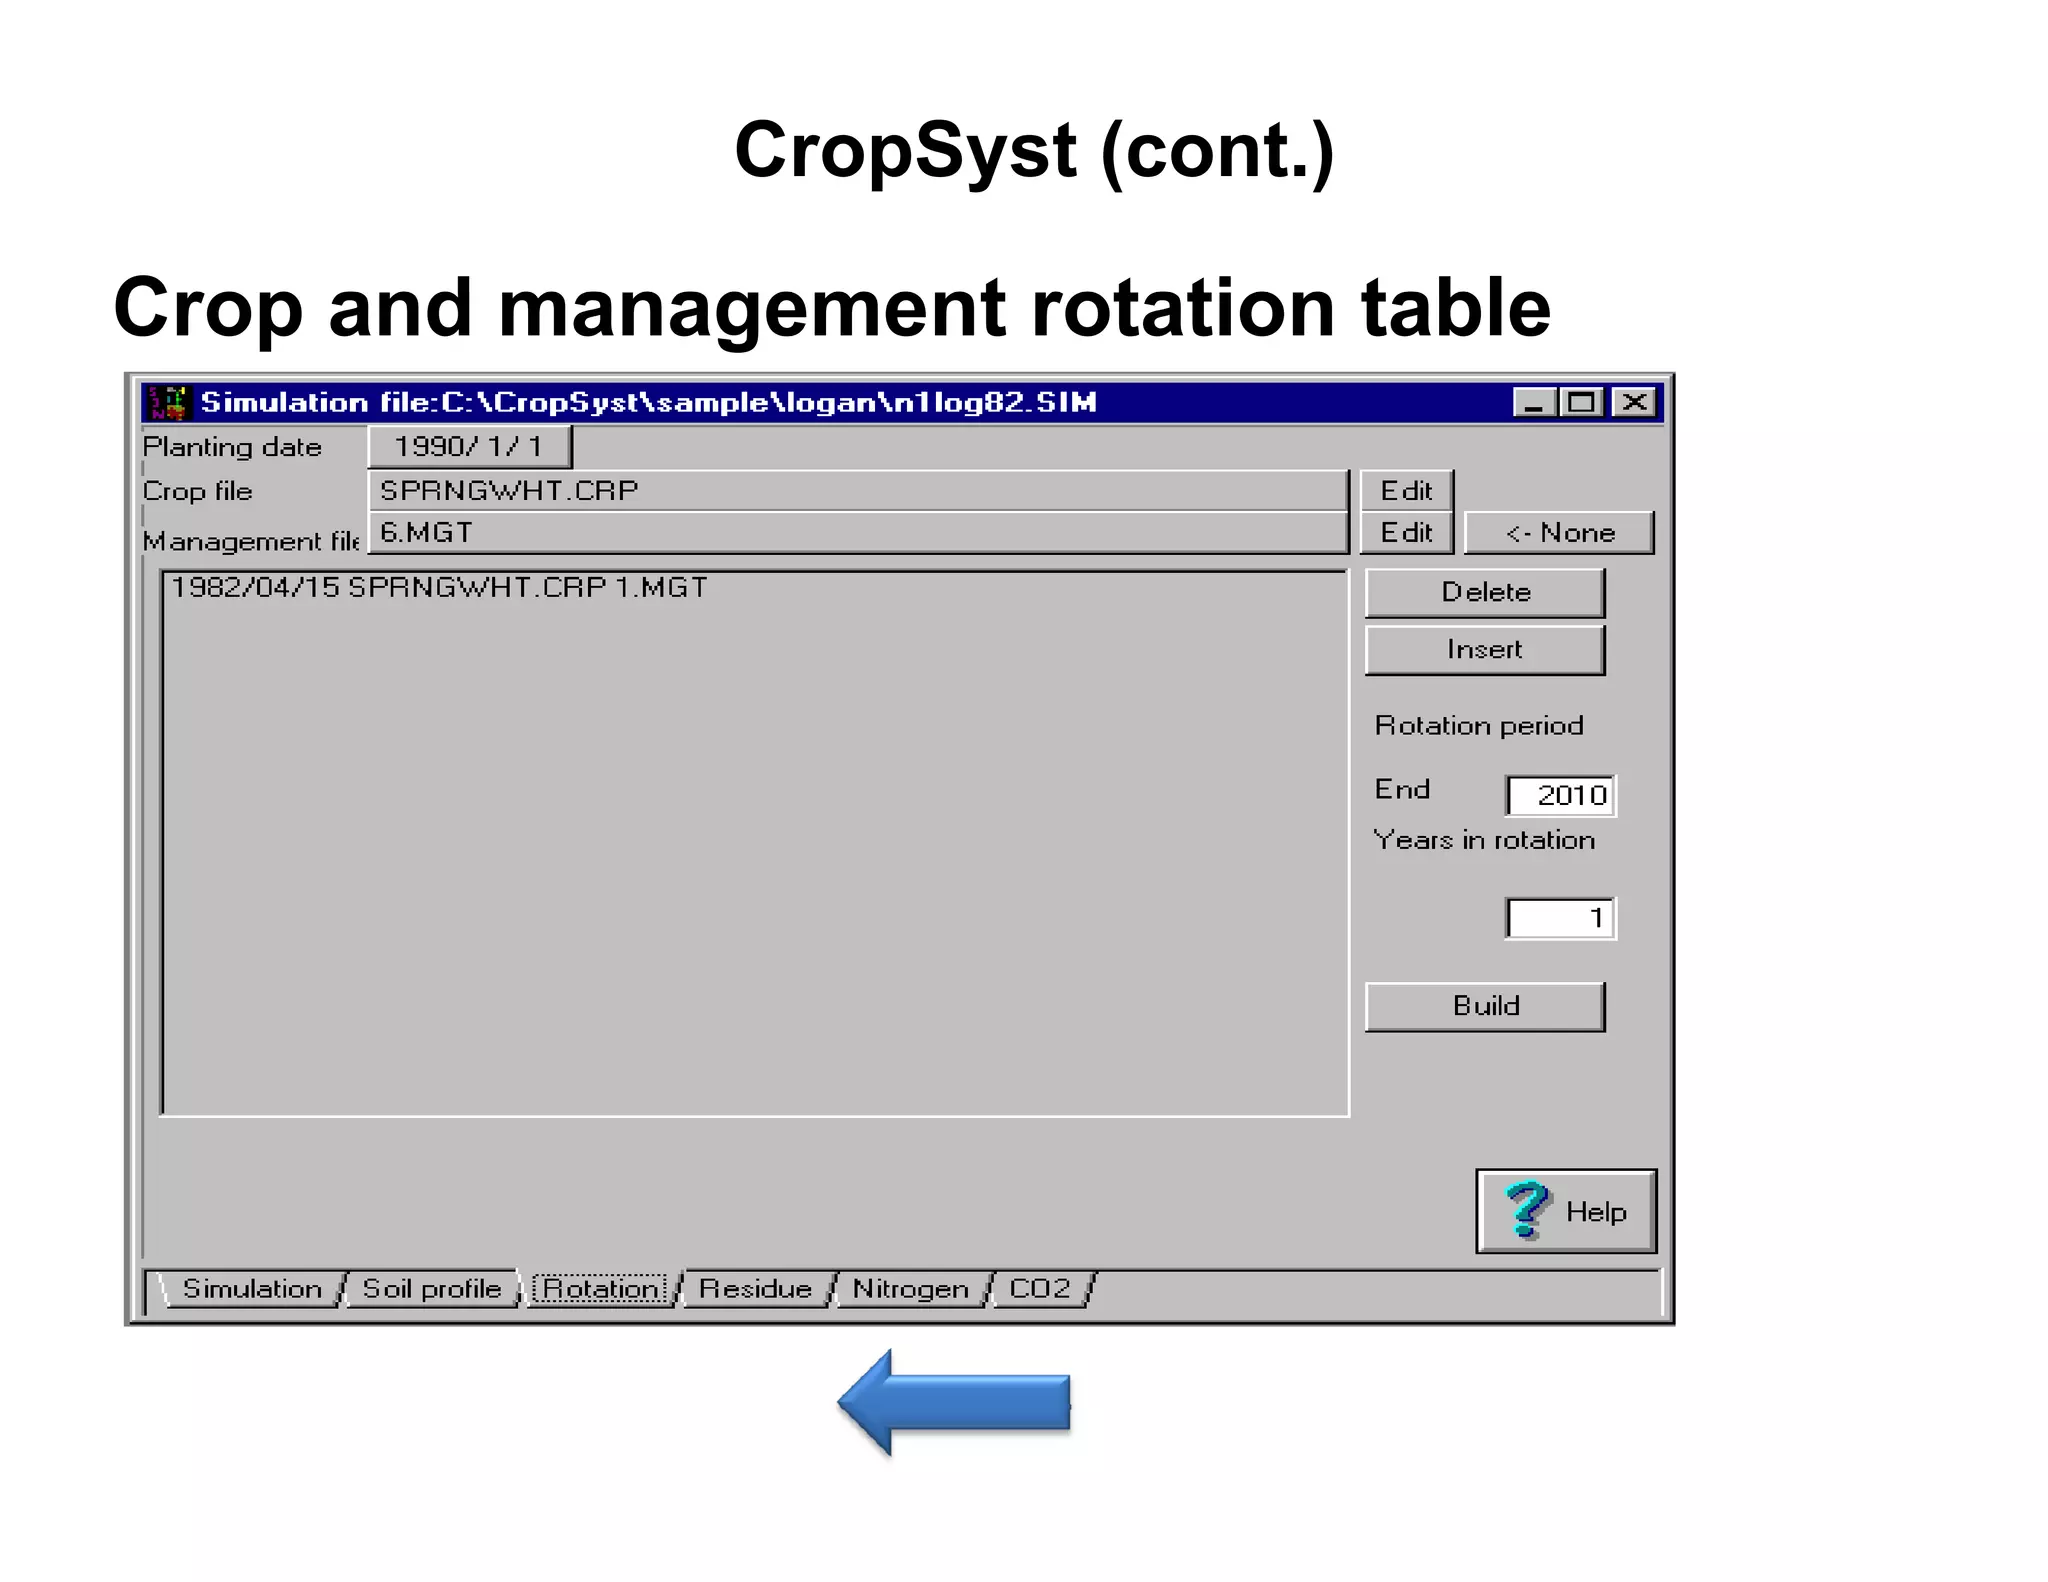
![CropSyst (cont.)
Hard wheat
(RL 39% + IL 16%)
[Crop+Location+Soil+Manage]
Fodder
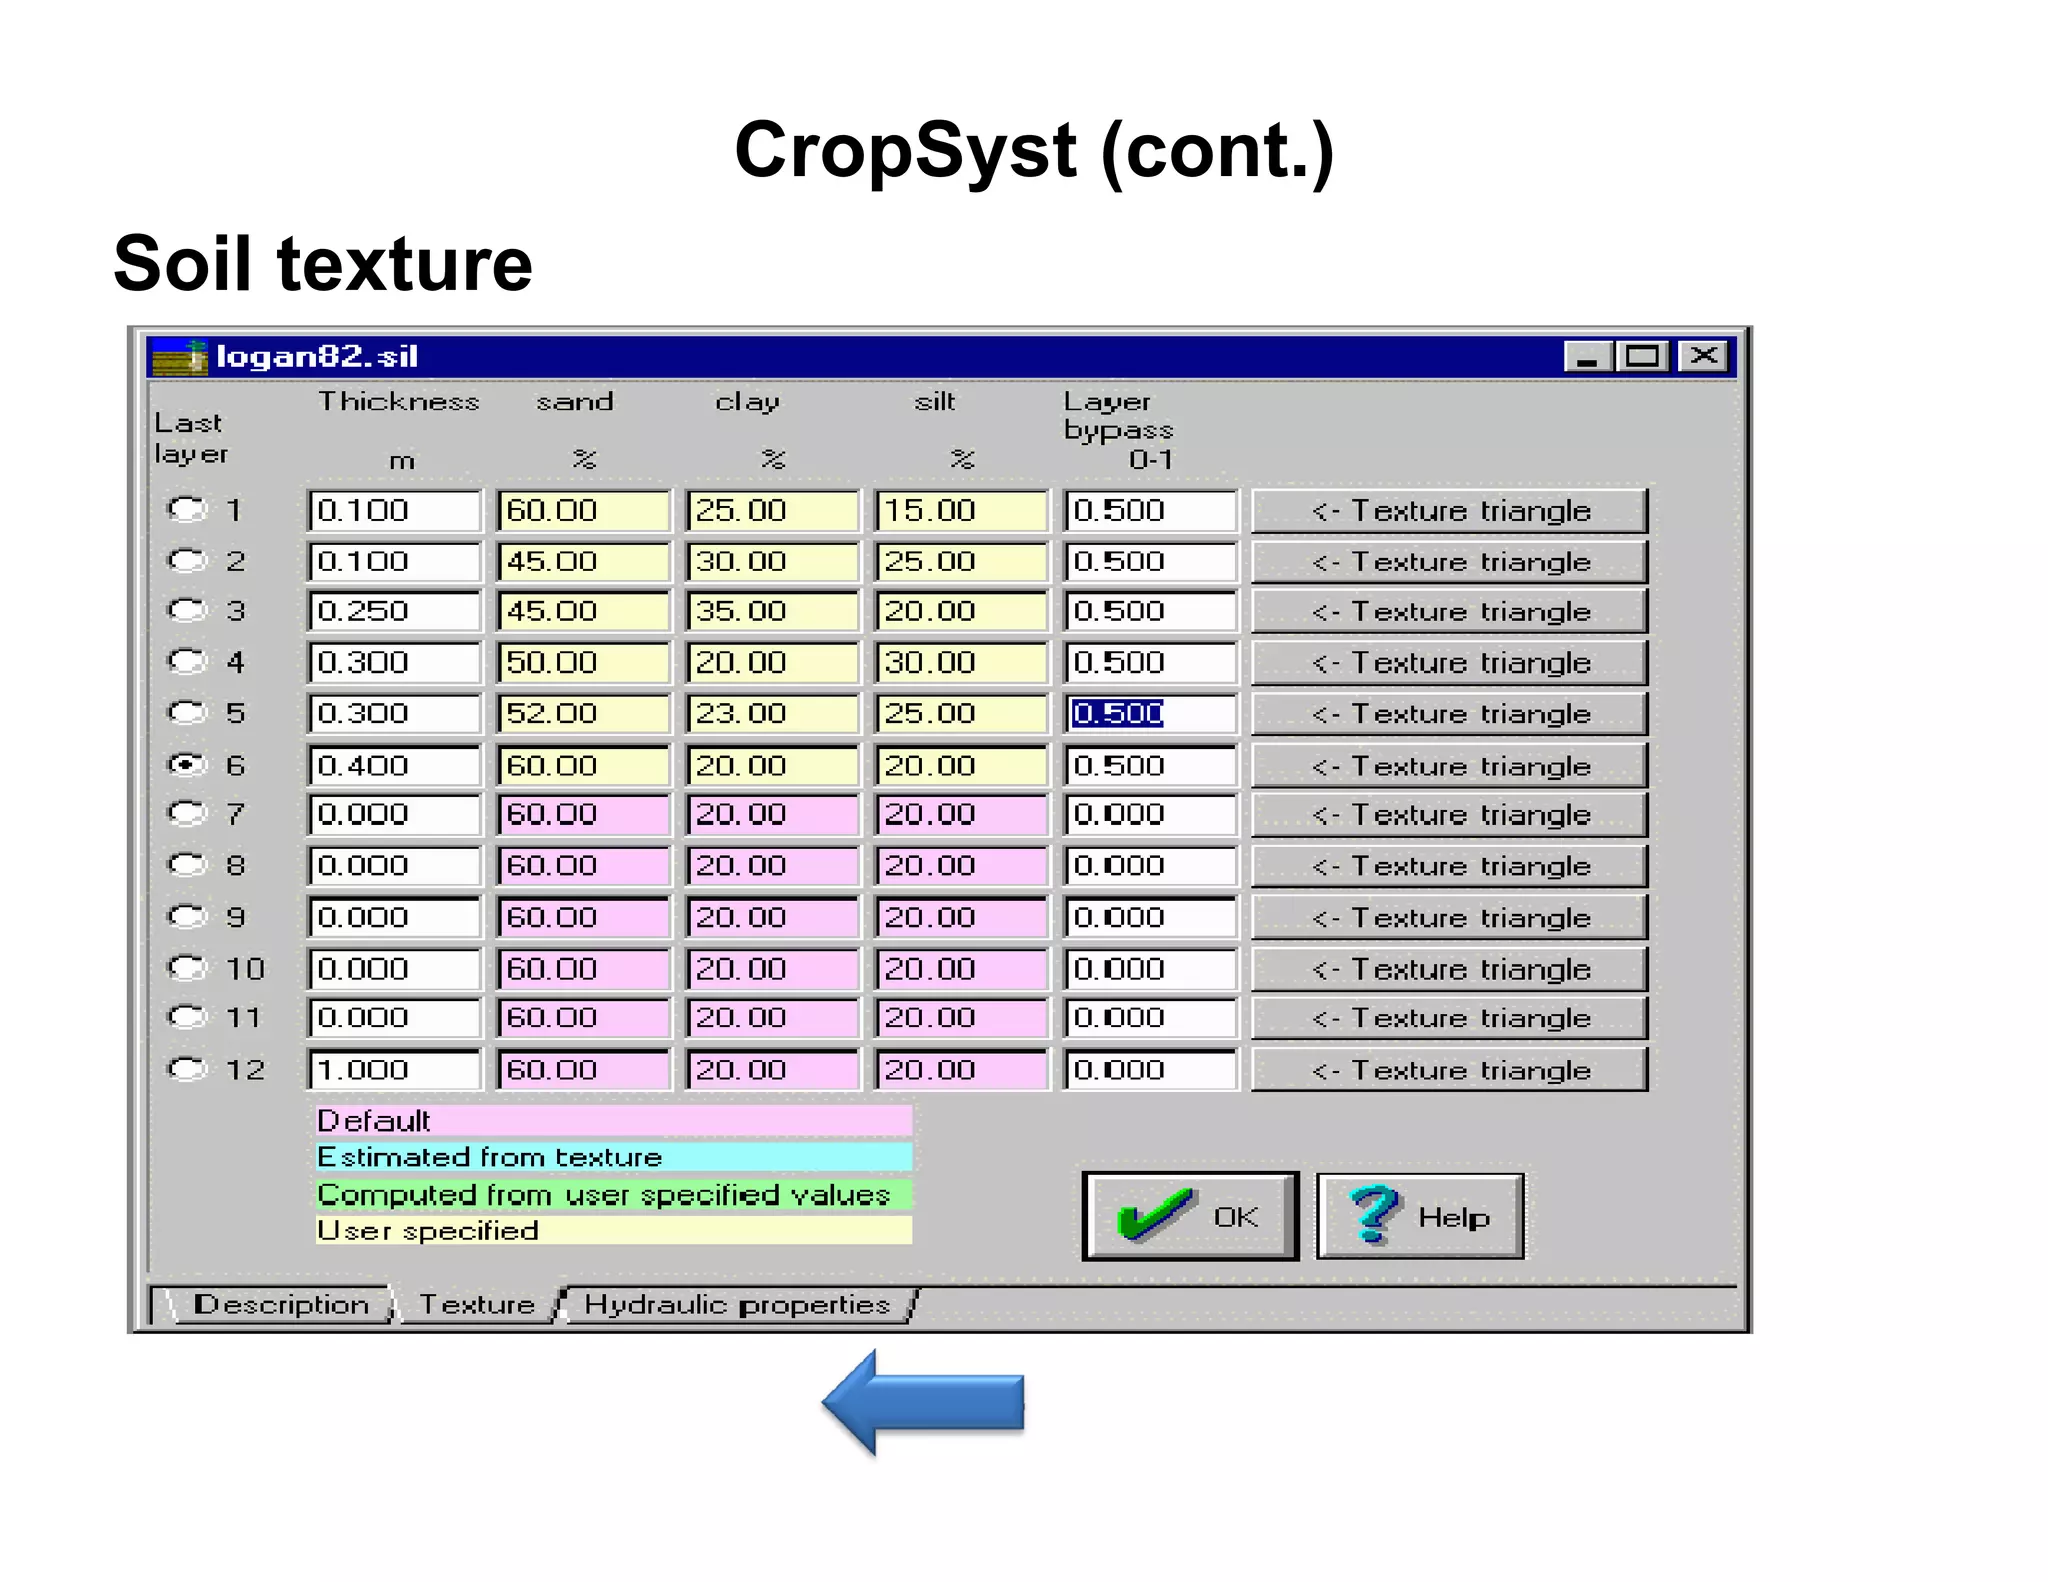
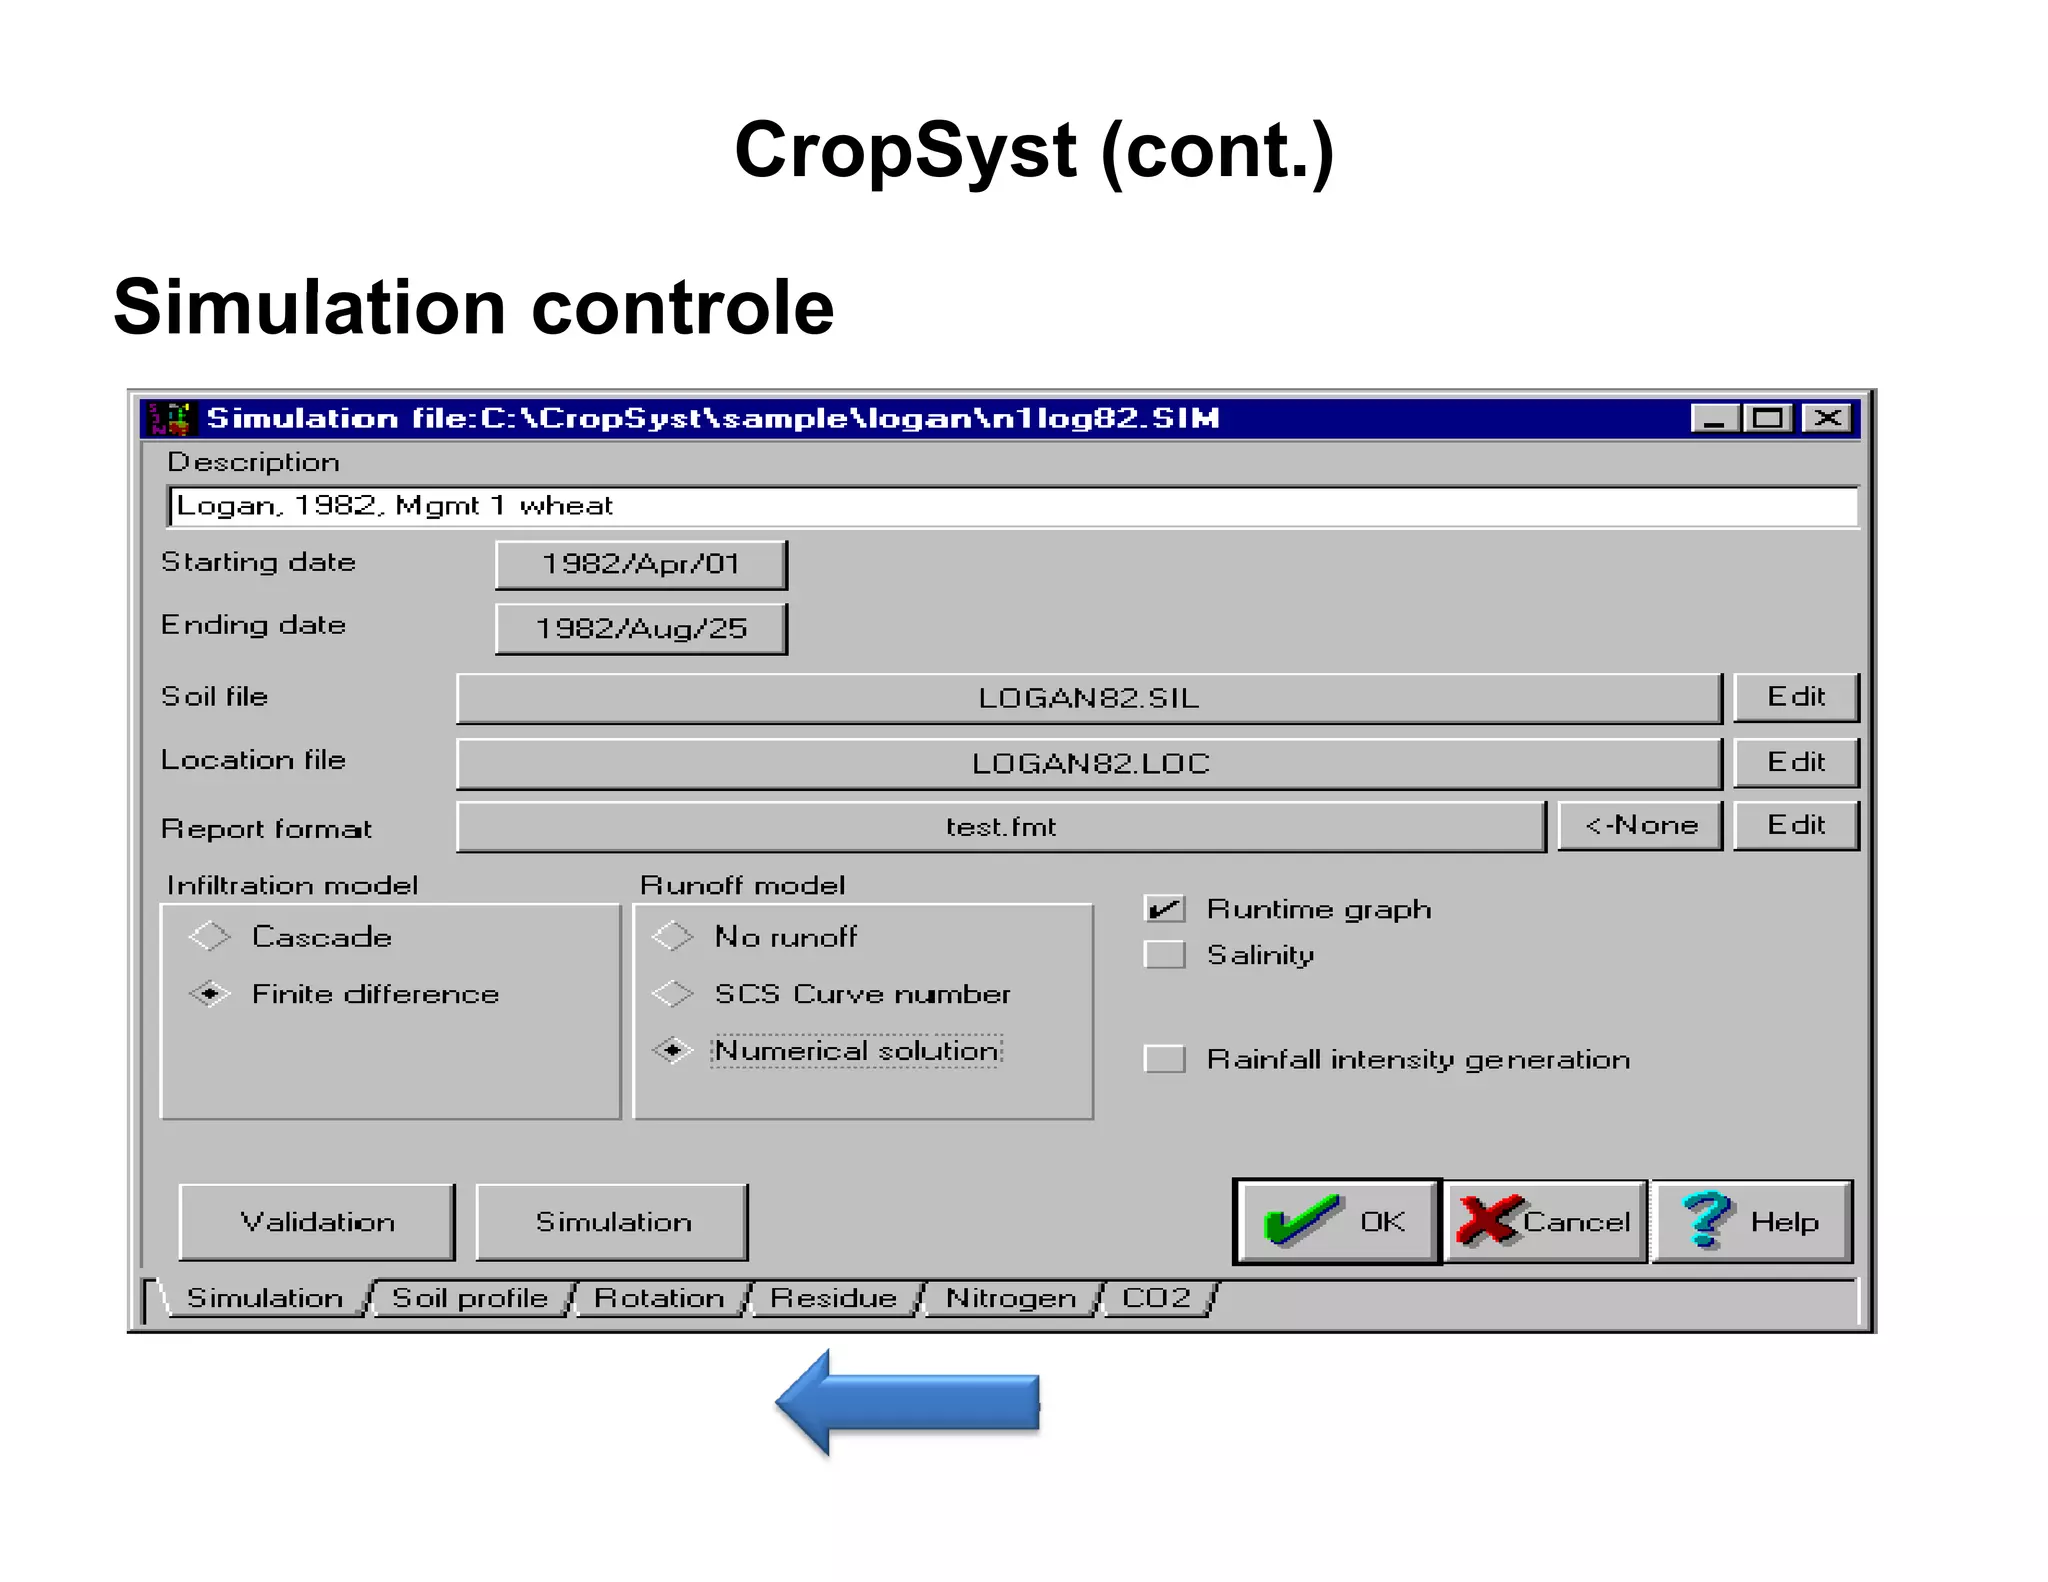
barley SIMULATION CONTROLE
(RL 2%) Rotation Soft wheat
[Crop+Location+Soil+Manage]
Soil profile (RL 4%)
Residue [Crop+Location+Soil+Manage]
Nitrogen
Runoff
Fava beans
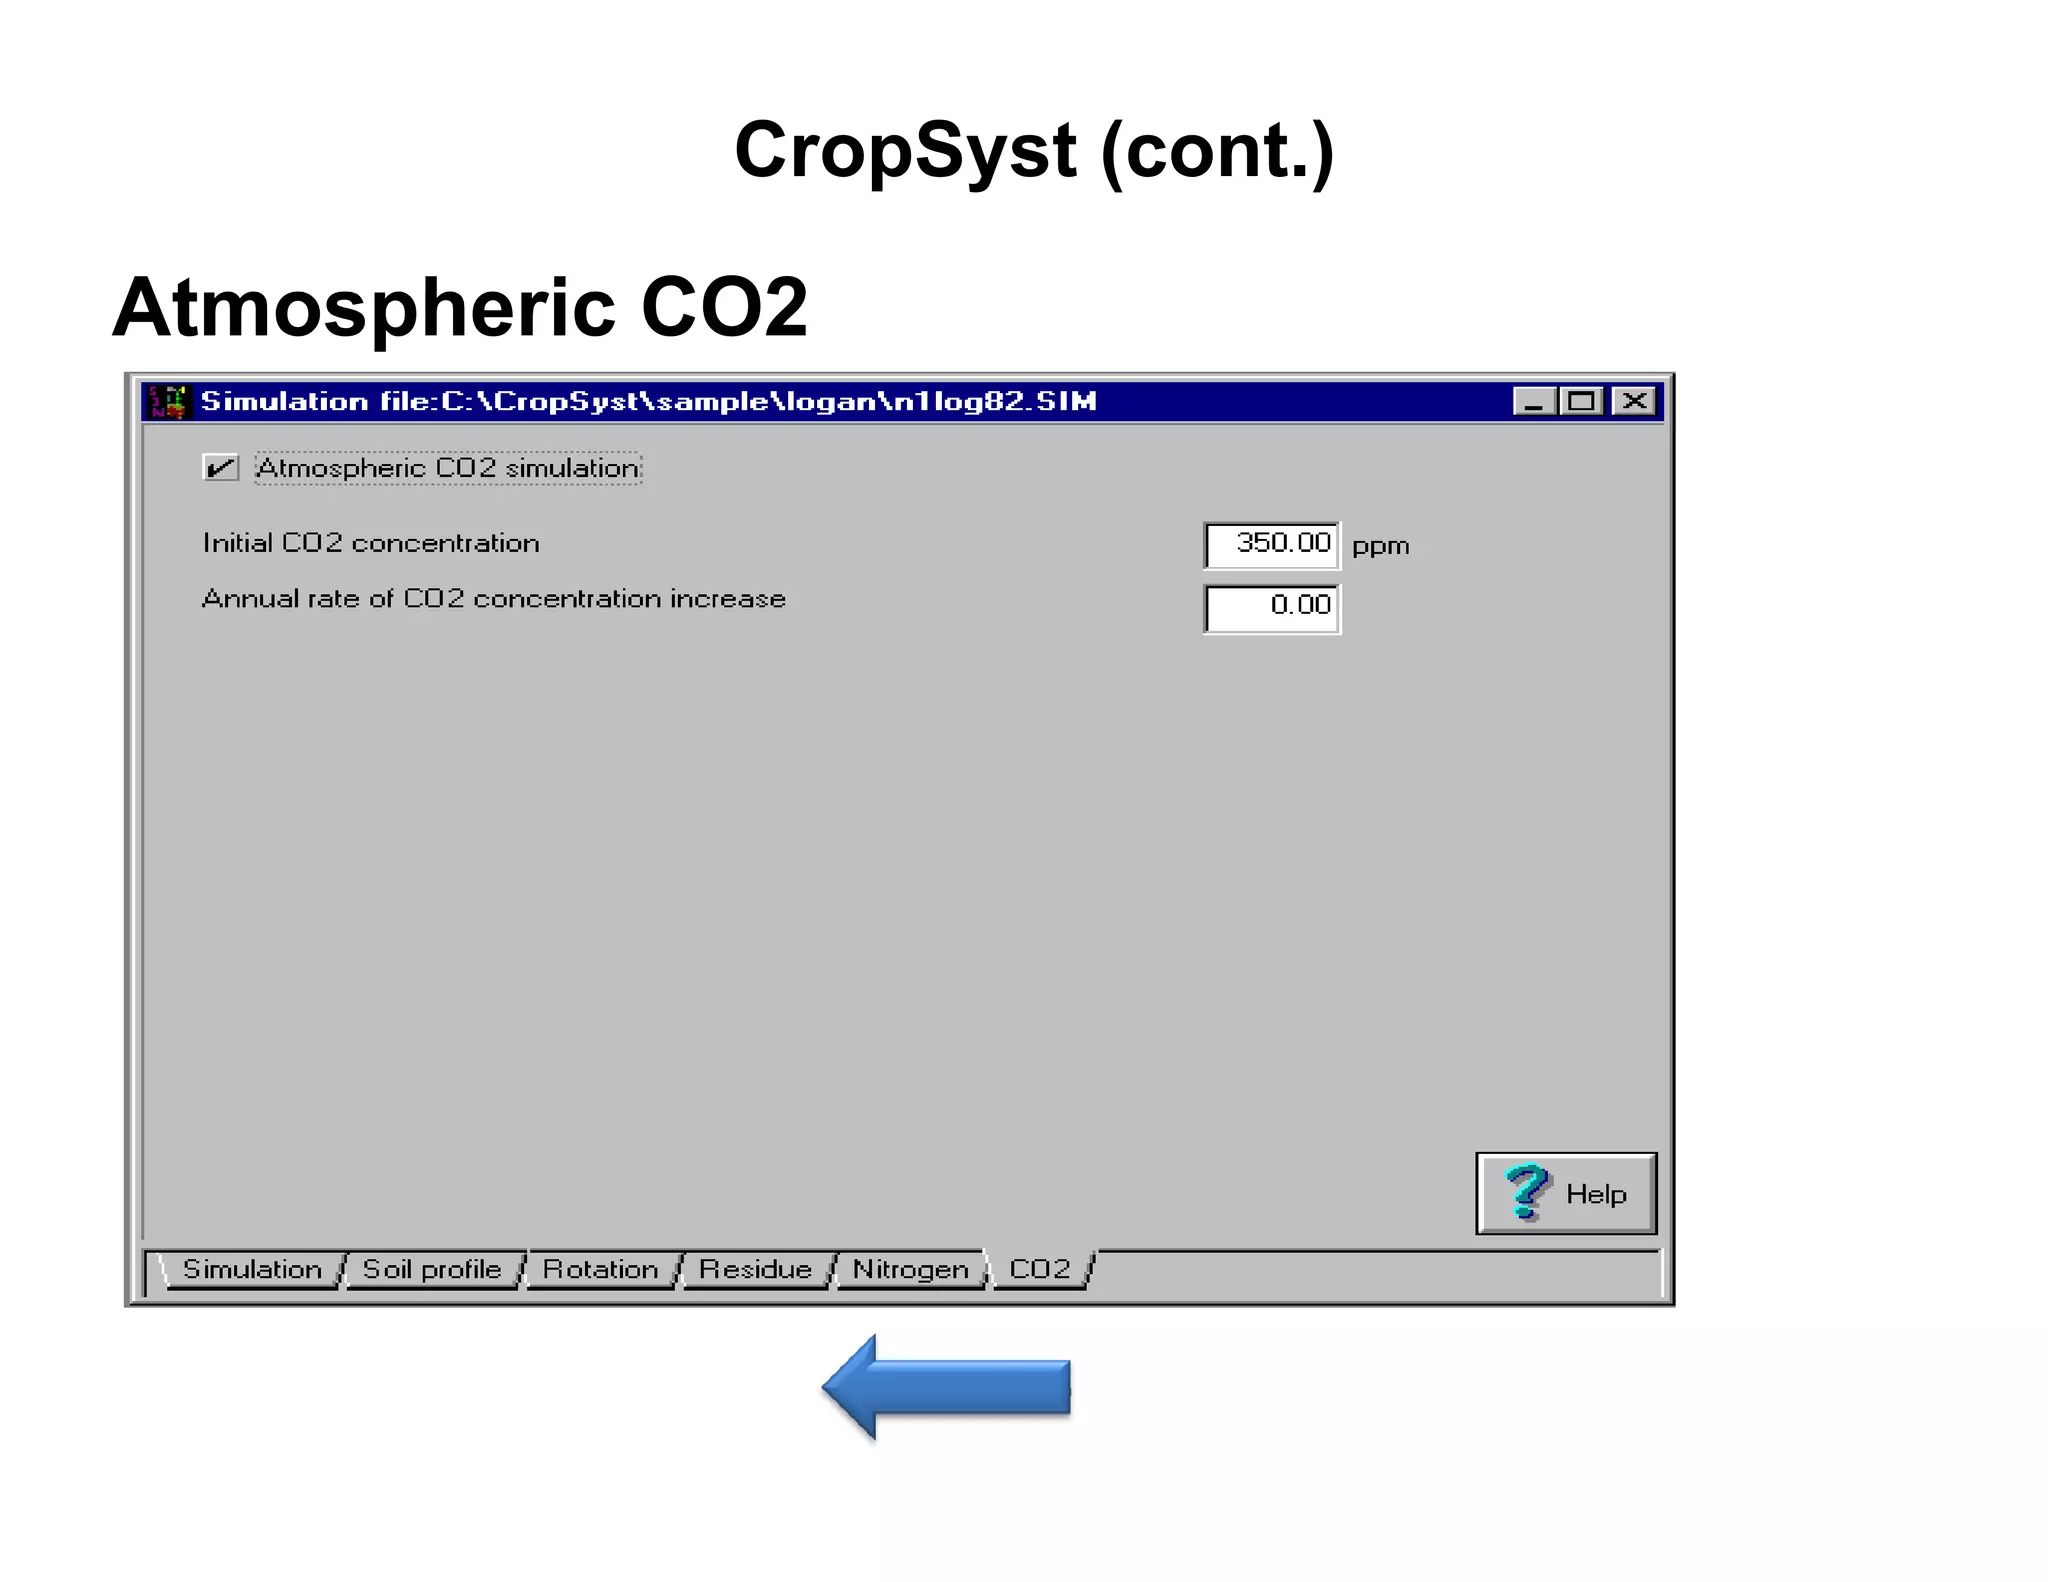
CO2
(RL 2%)
[Crop+Location+Soil+Manage]
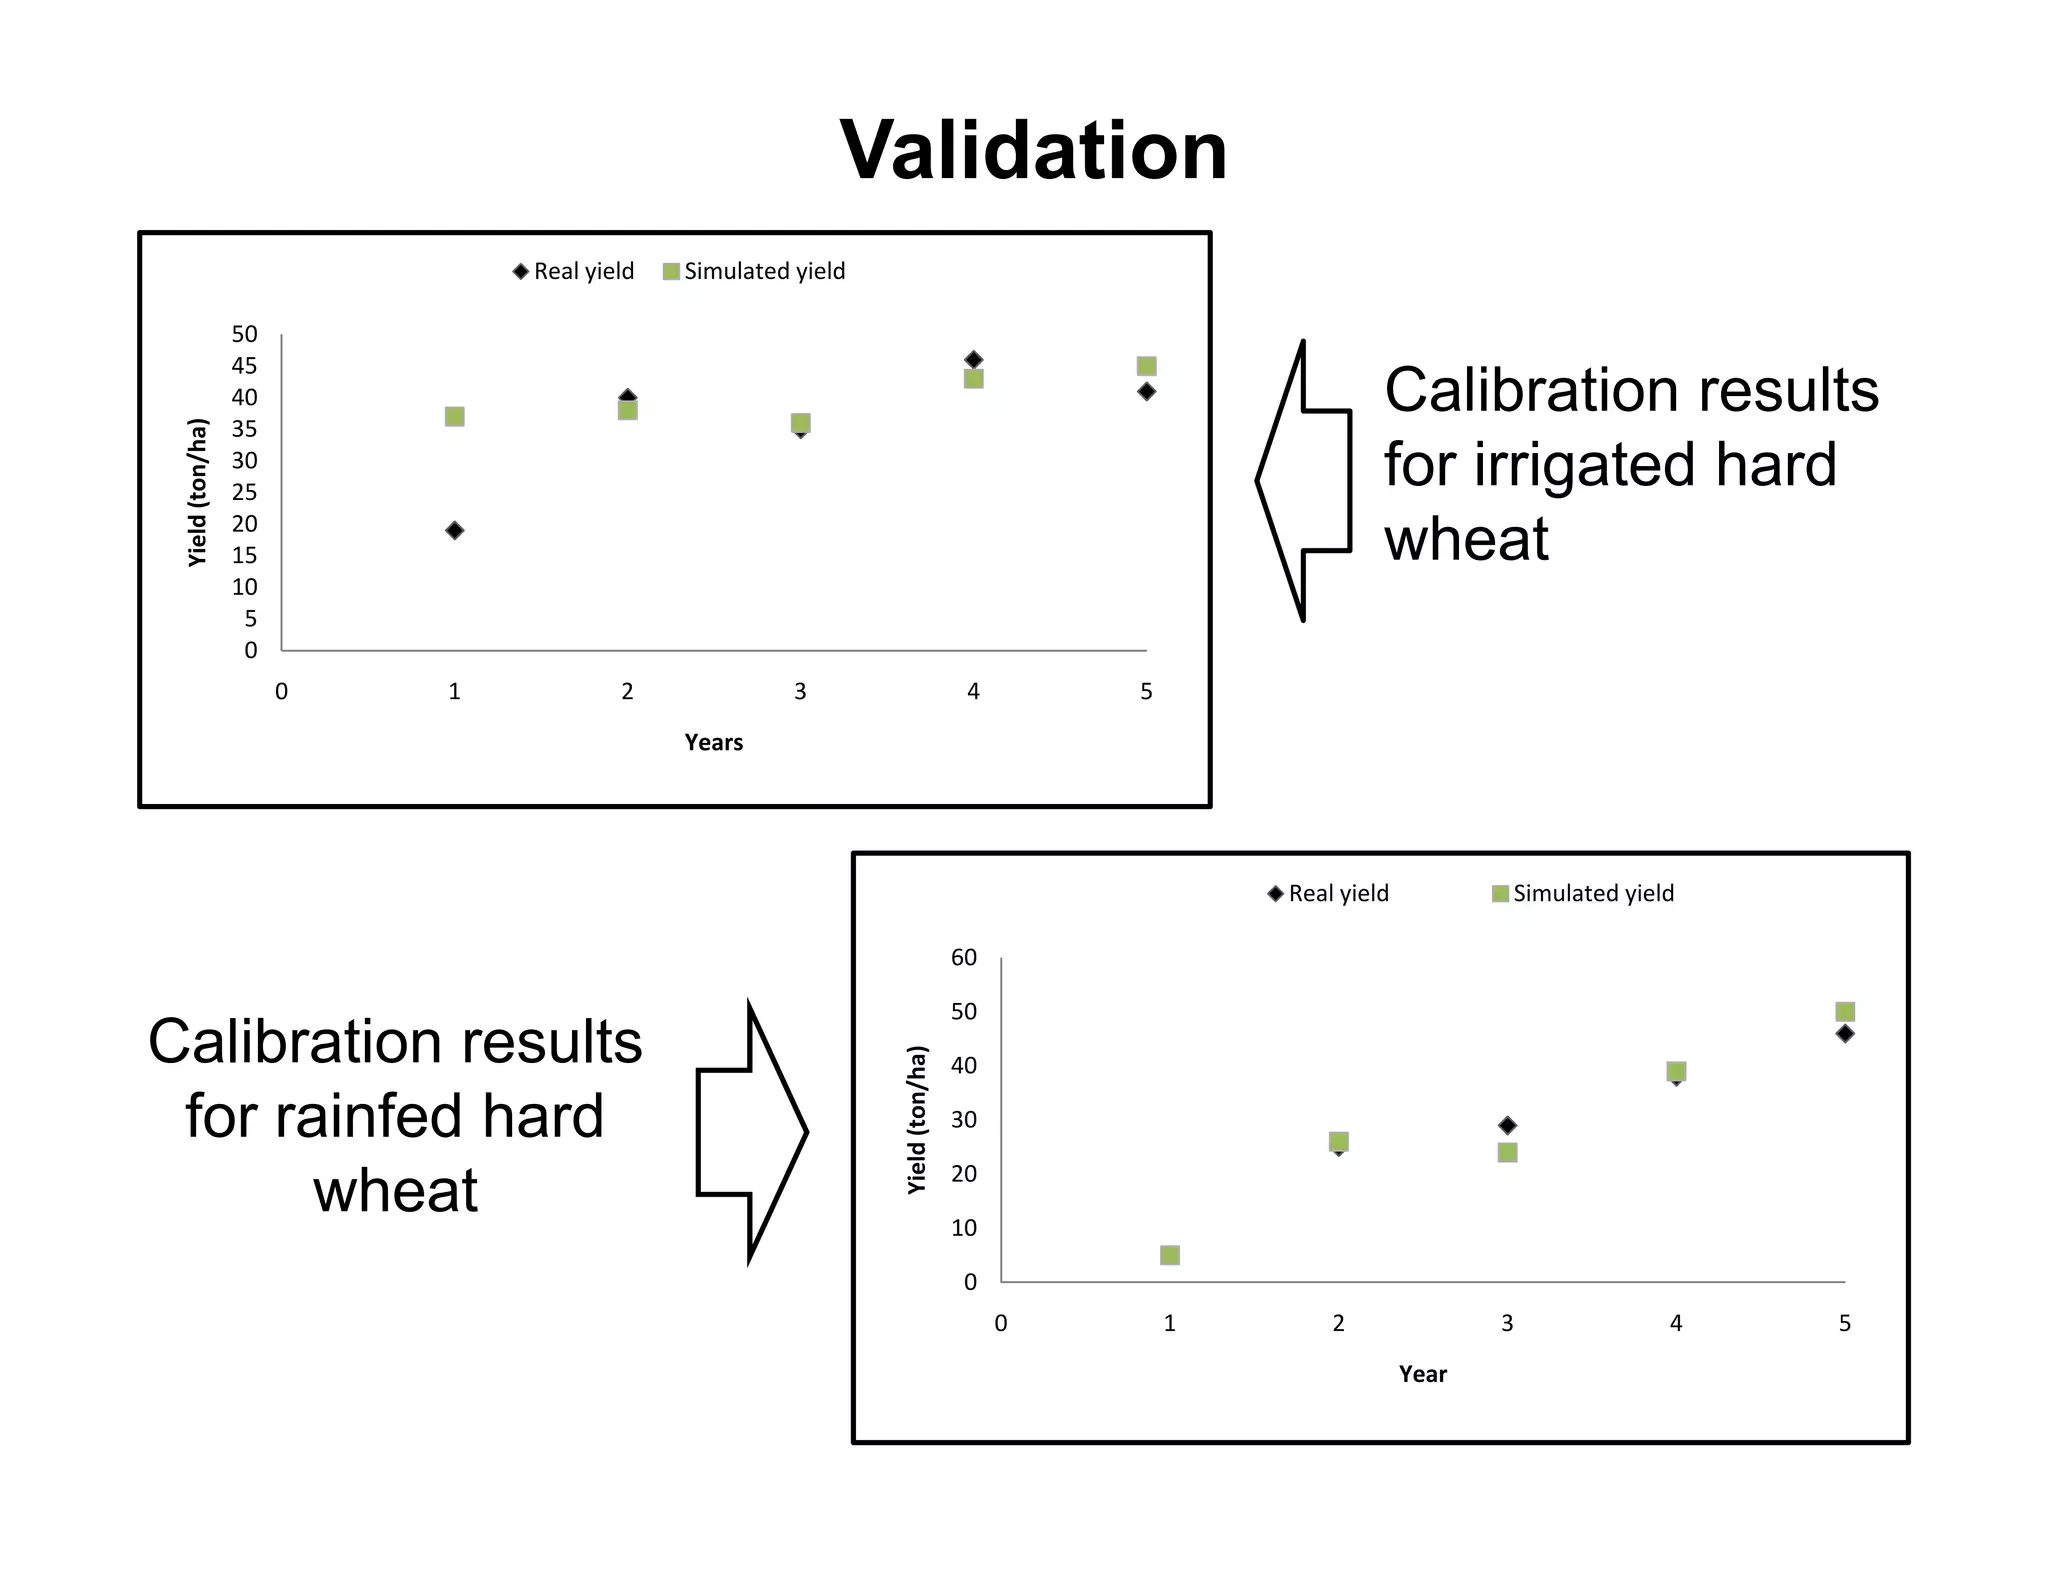
Validation
Oat hay
Chi k
Chickpeas (IL 8%)
[Crop+Location+Soil+Manage]
(RL 1%)
[Crop+Location+Soil+Manage]](https://image.slidesharecdn.com/ccday2s1fofana-110621143820-phpapp01/75/Simulating-the-Impact-of-Climate-Change-and-Adaptation-Strategies-on-Farm-Productivity-and-Income-A-Bioeconomic-Analysis-12-2048.jpg)
![CropSyst (cont.)
Runtime graphic display
u t e g ap c d sp ay
Atmospheric conditions graph
• Average daily temperature
• Actual evapotranspiration
Growth • Potential evapotranspiration
stage • Precipitation Atmospheric conditions graph
graph • Runoff • Plant height
• Actual transpiration • Biomass
• Potential transpiration • Leaf area index
• Green area index
• Total stress
• Nitrogen stress
• Light stress
g
• Water stress
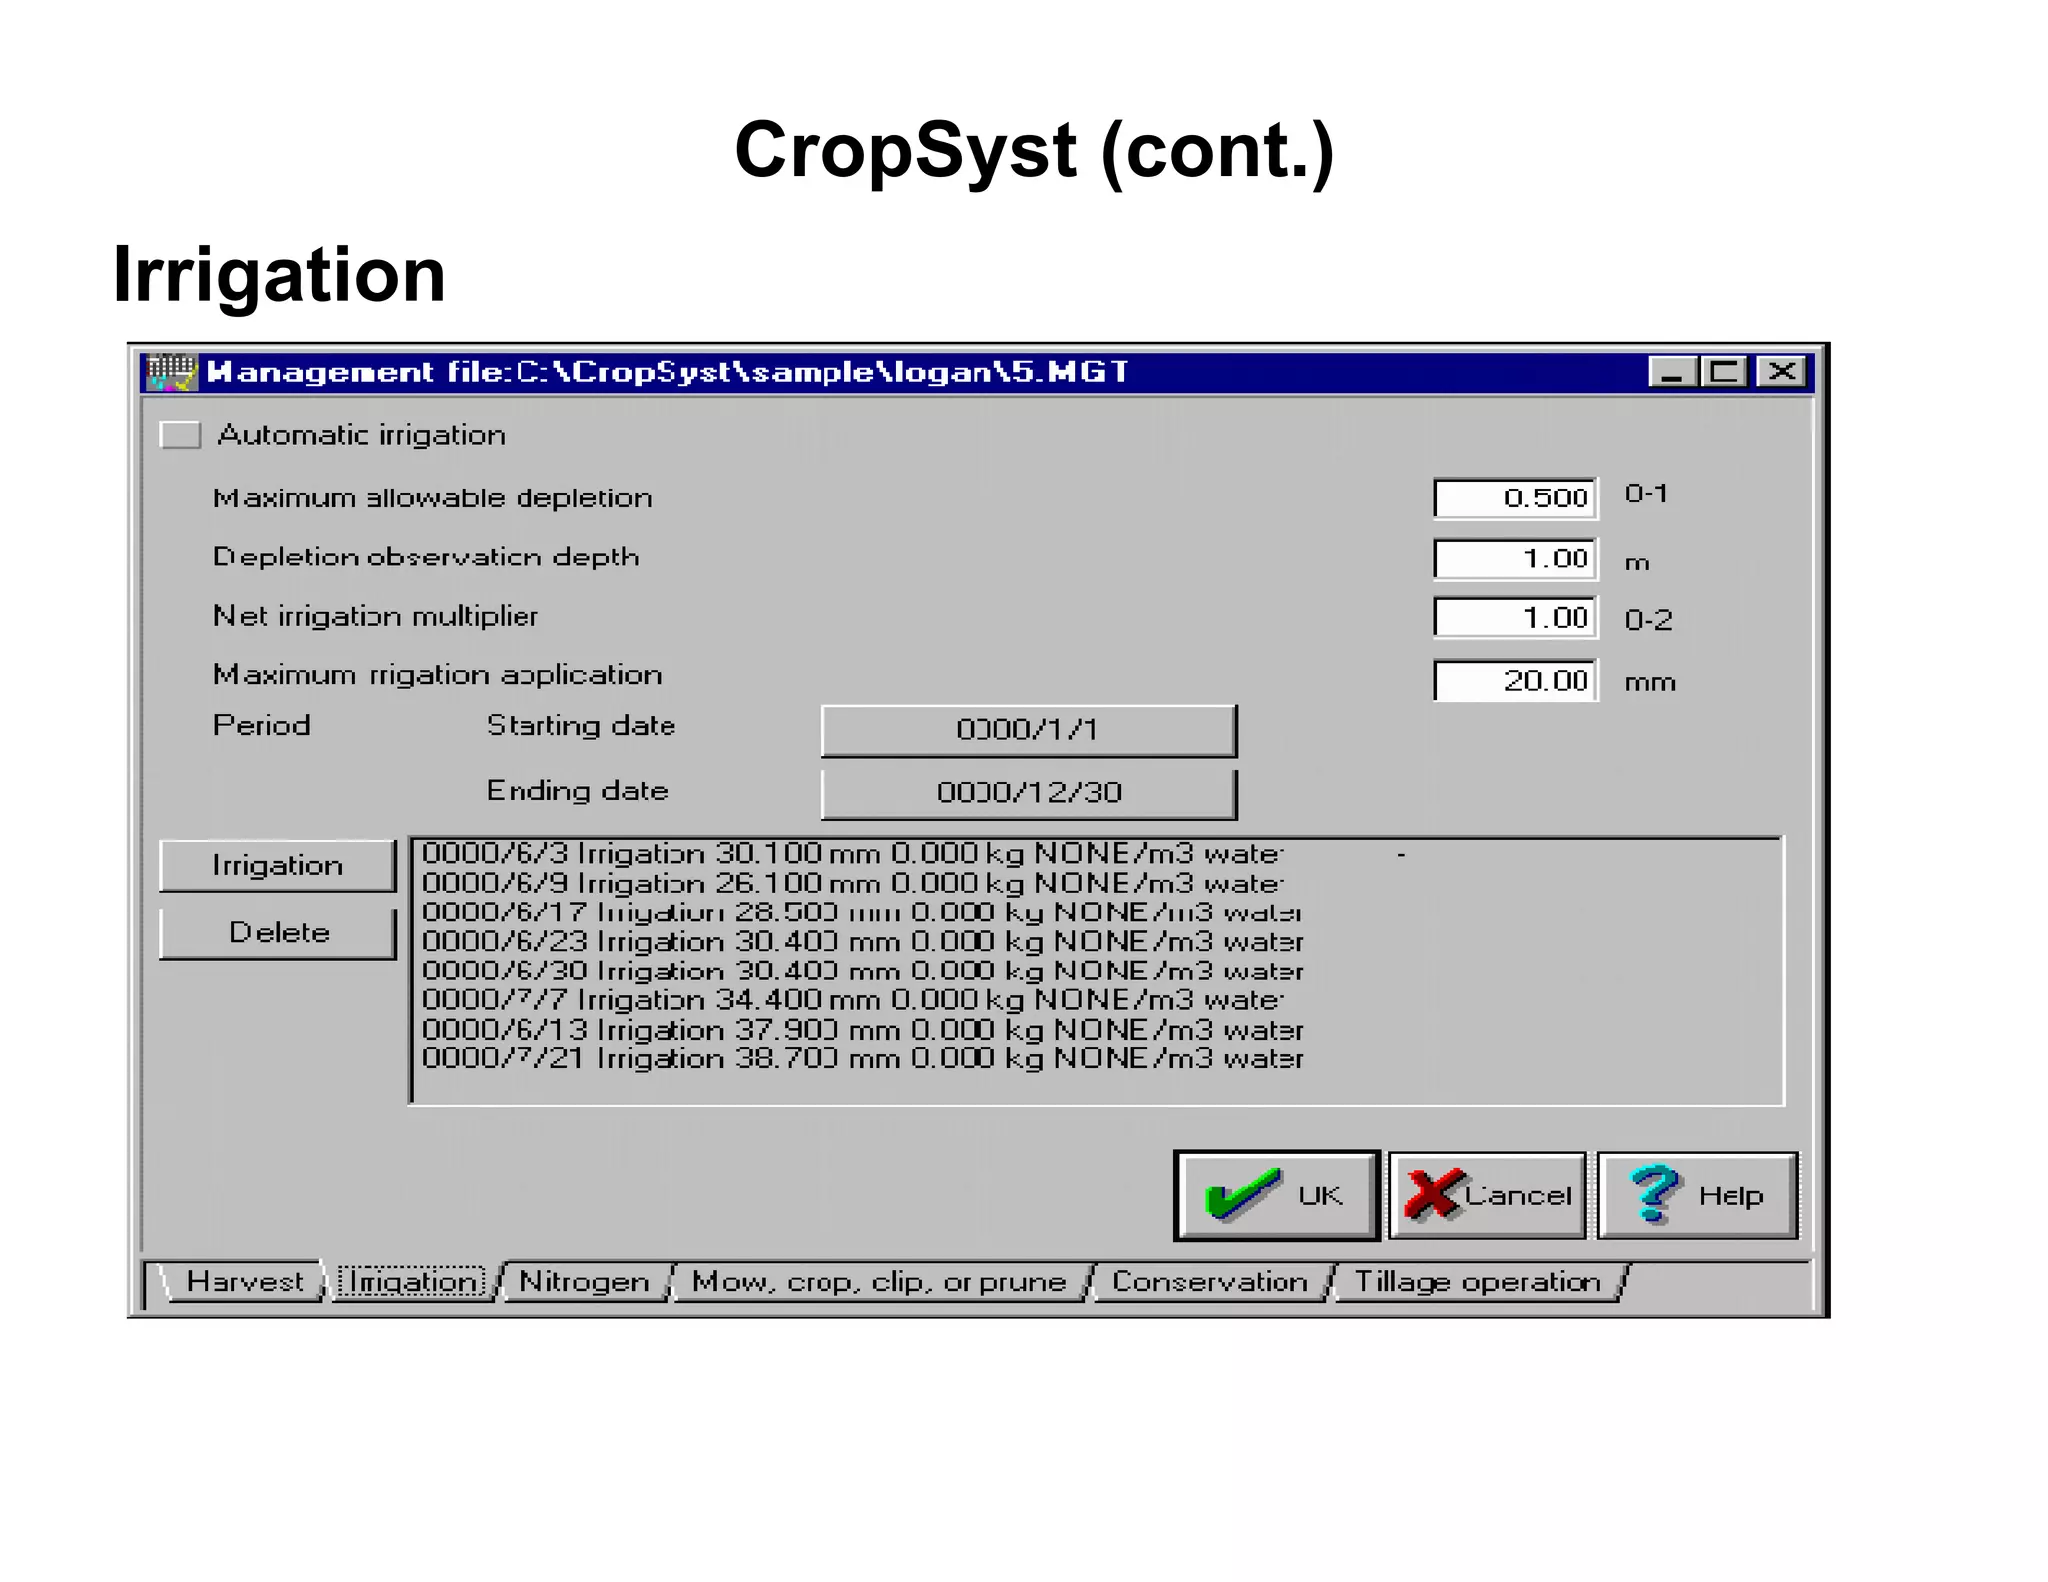
Harvest
• Temperature stress
Totals
Display Plant
Pl t Plant Available
Pl t A il bl
Available Nitrogen graph
Water graph [ammonium & nitrate]](https://image.slidesharecdn.com/ccday2s1fofana-110621143820-phpapp01/75/Simulating-the-Impact-of-Climate-Change-and-Adaptation-Strategies-on-Farm-Productivity-and-Income-A-Bioeconomic-Analysis-16-2048.jpg)
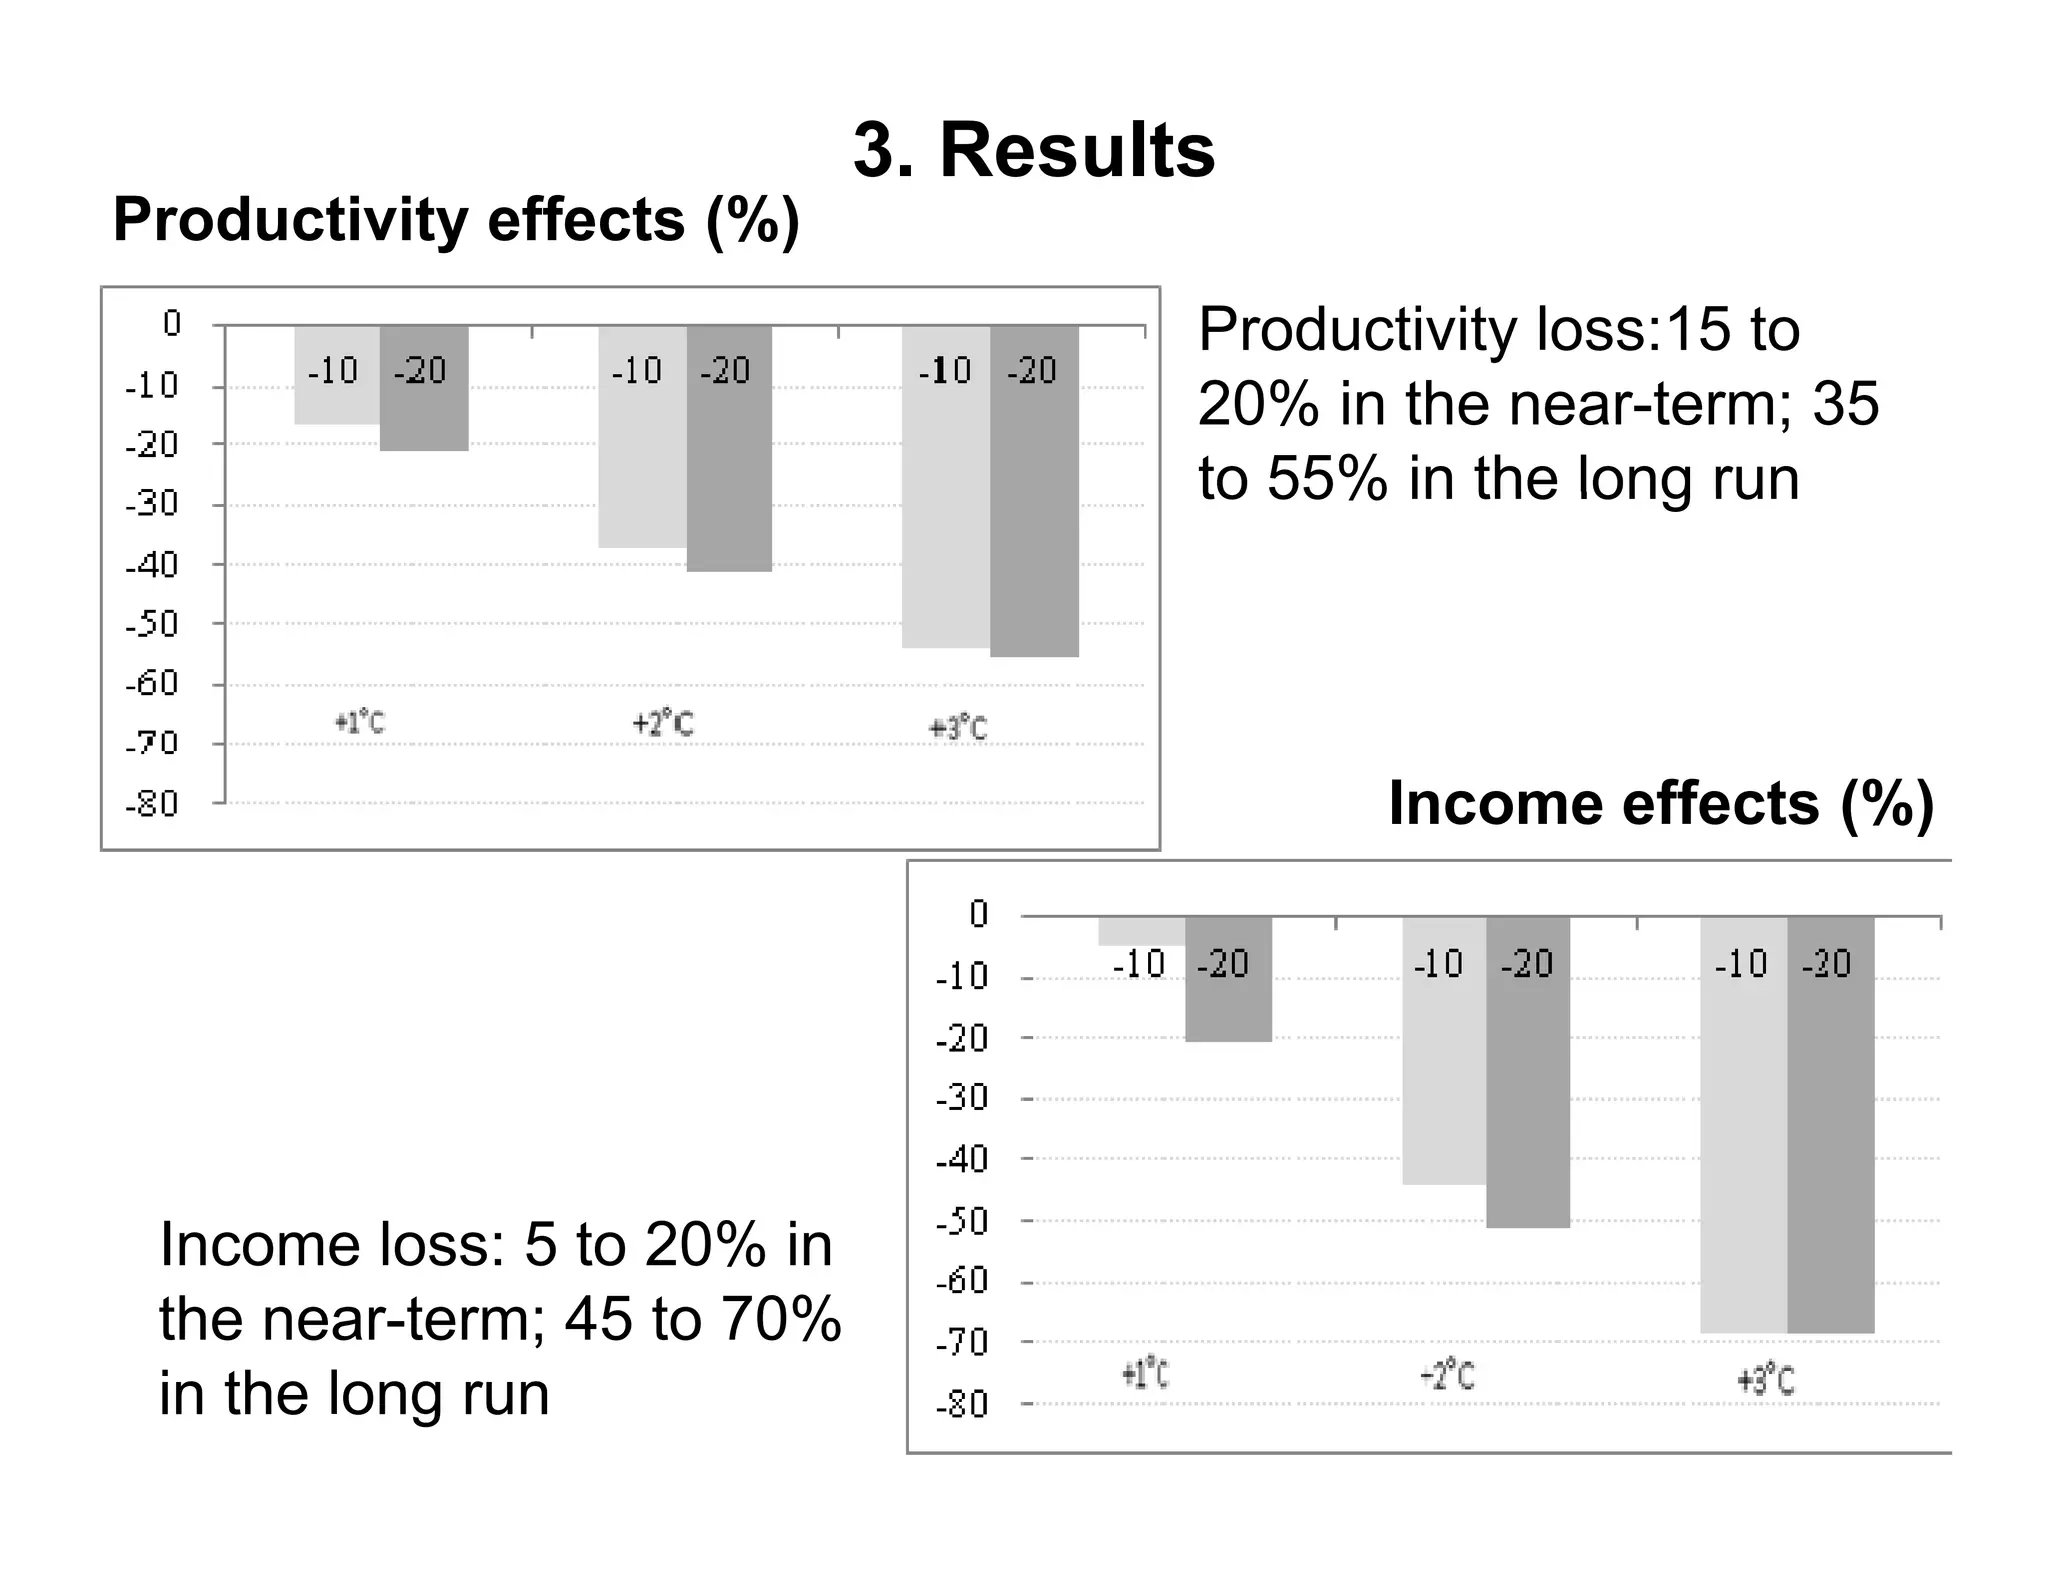
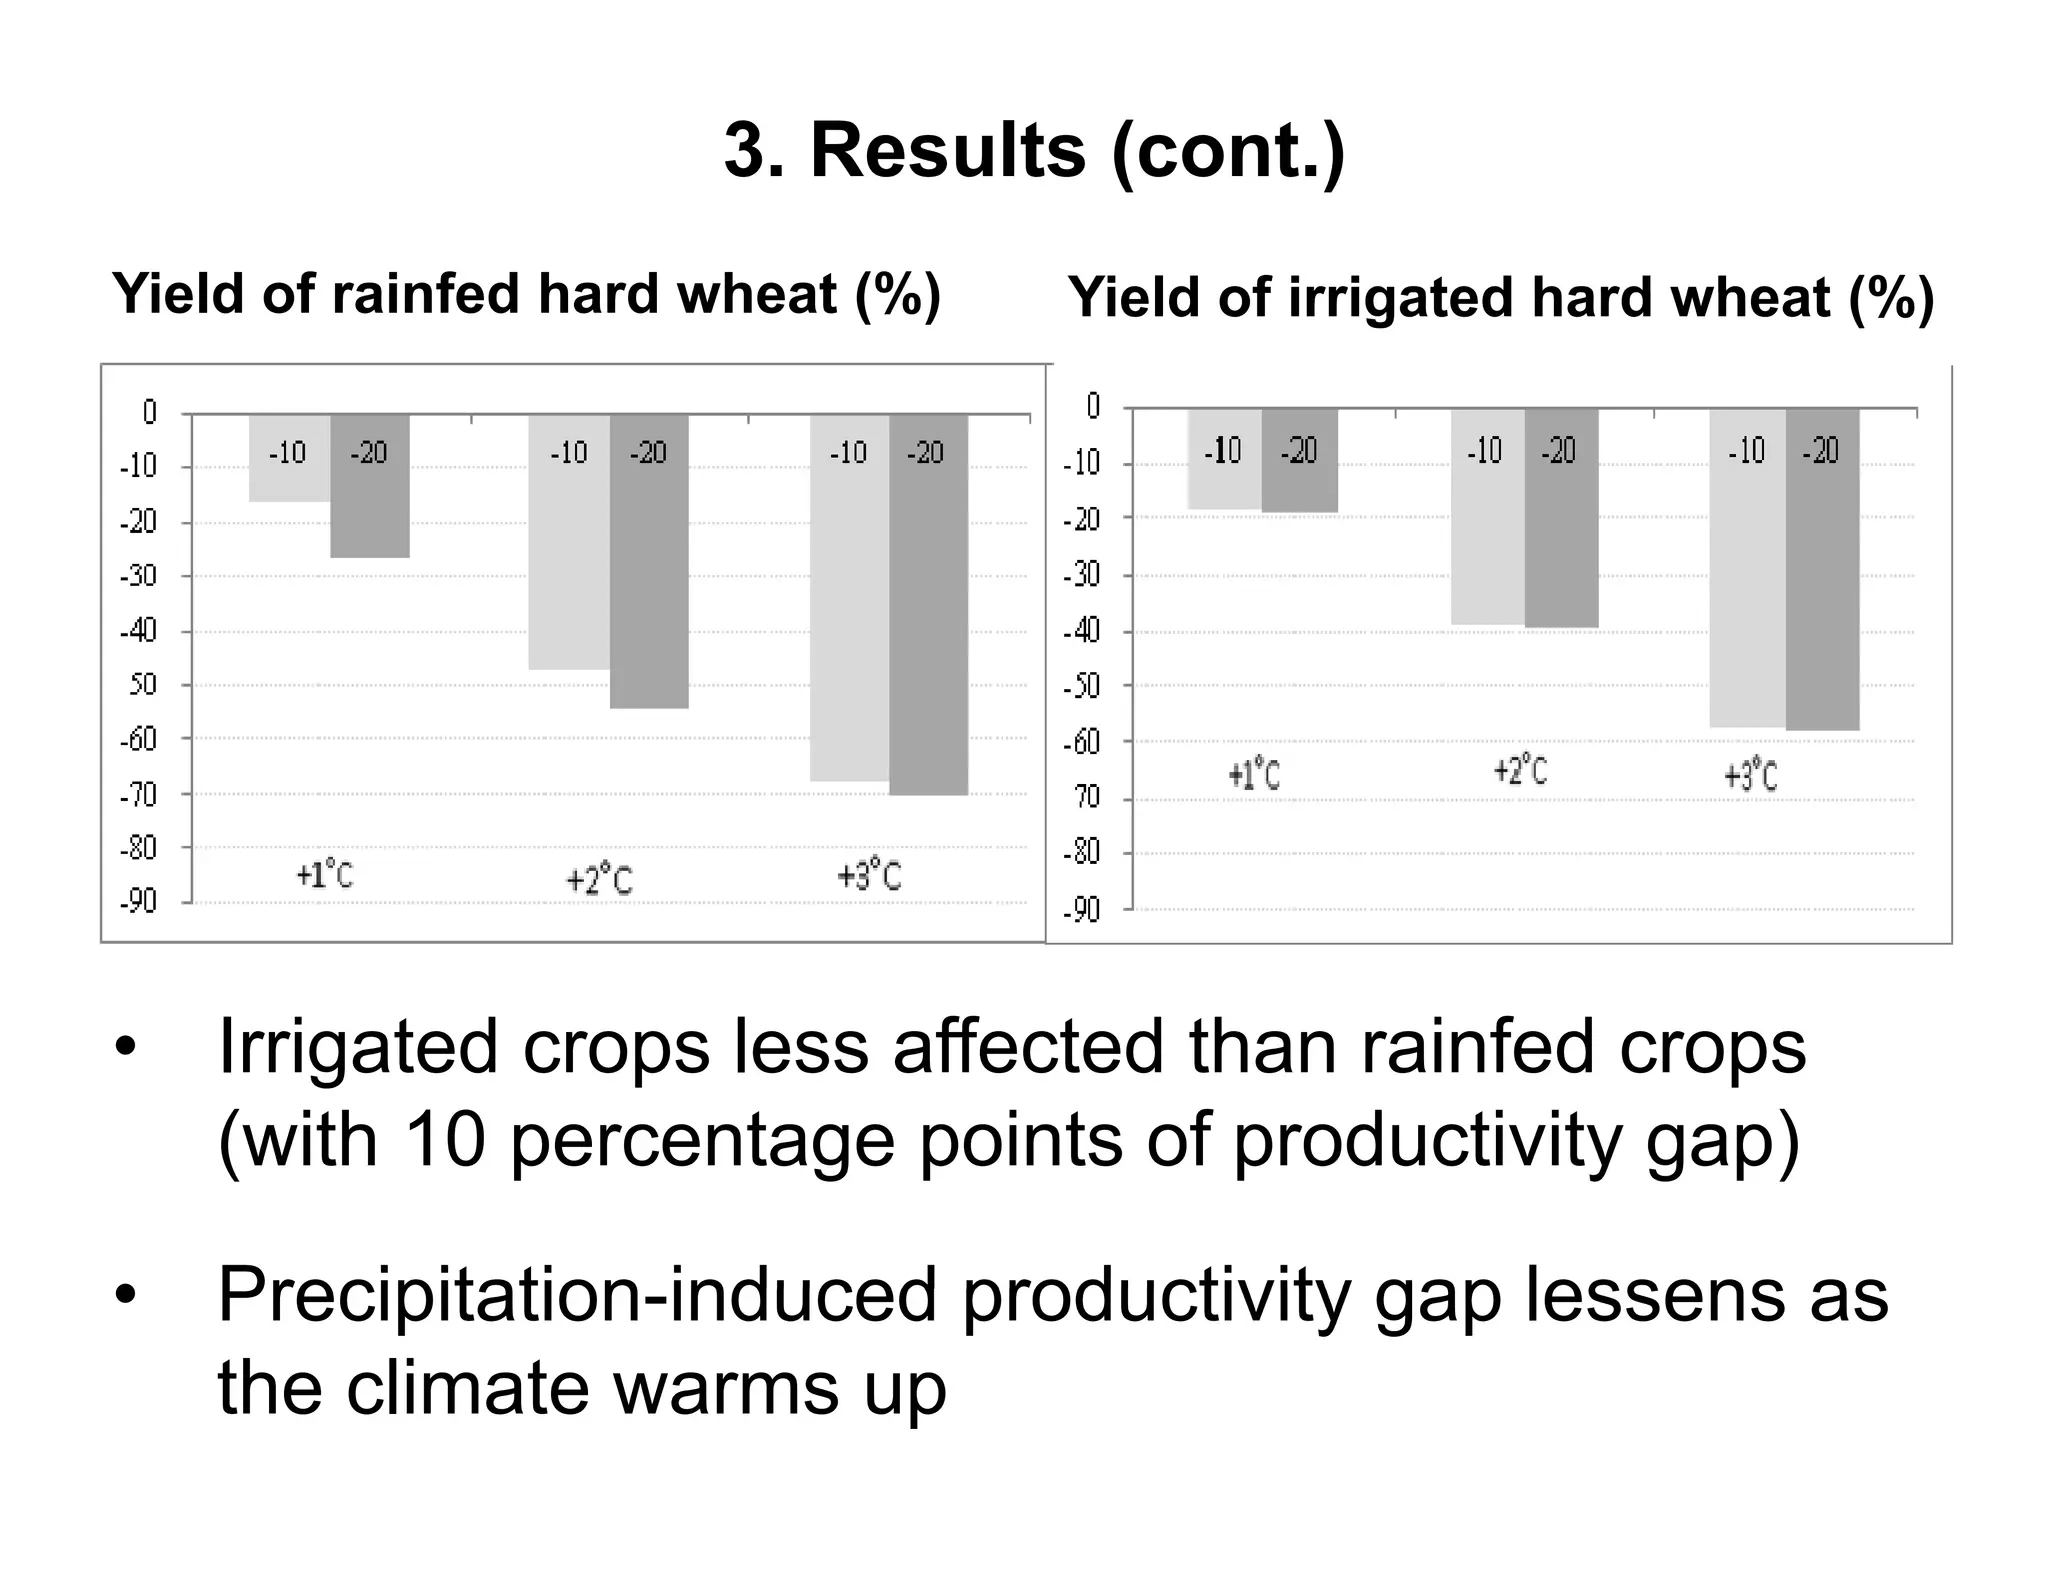
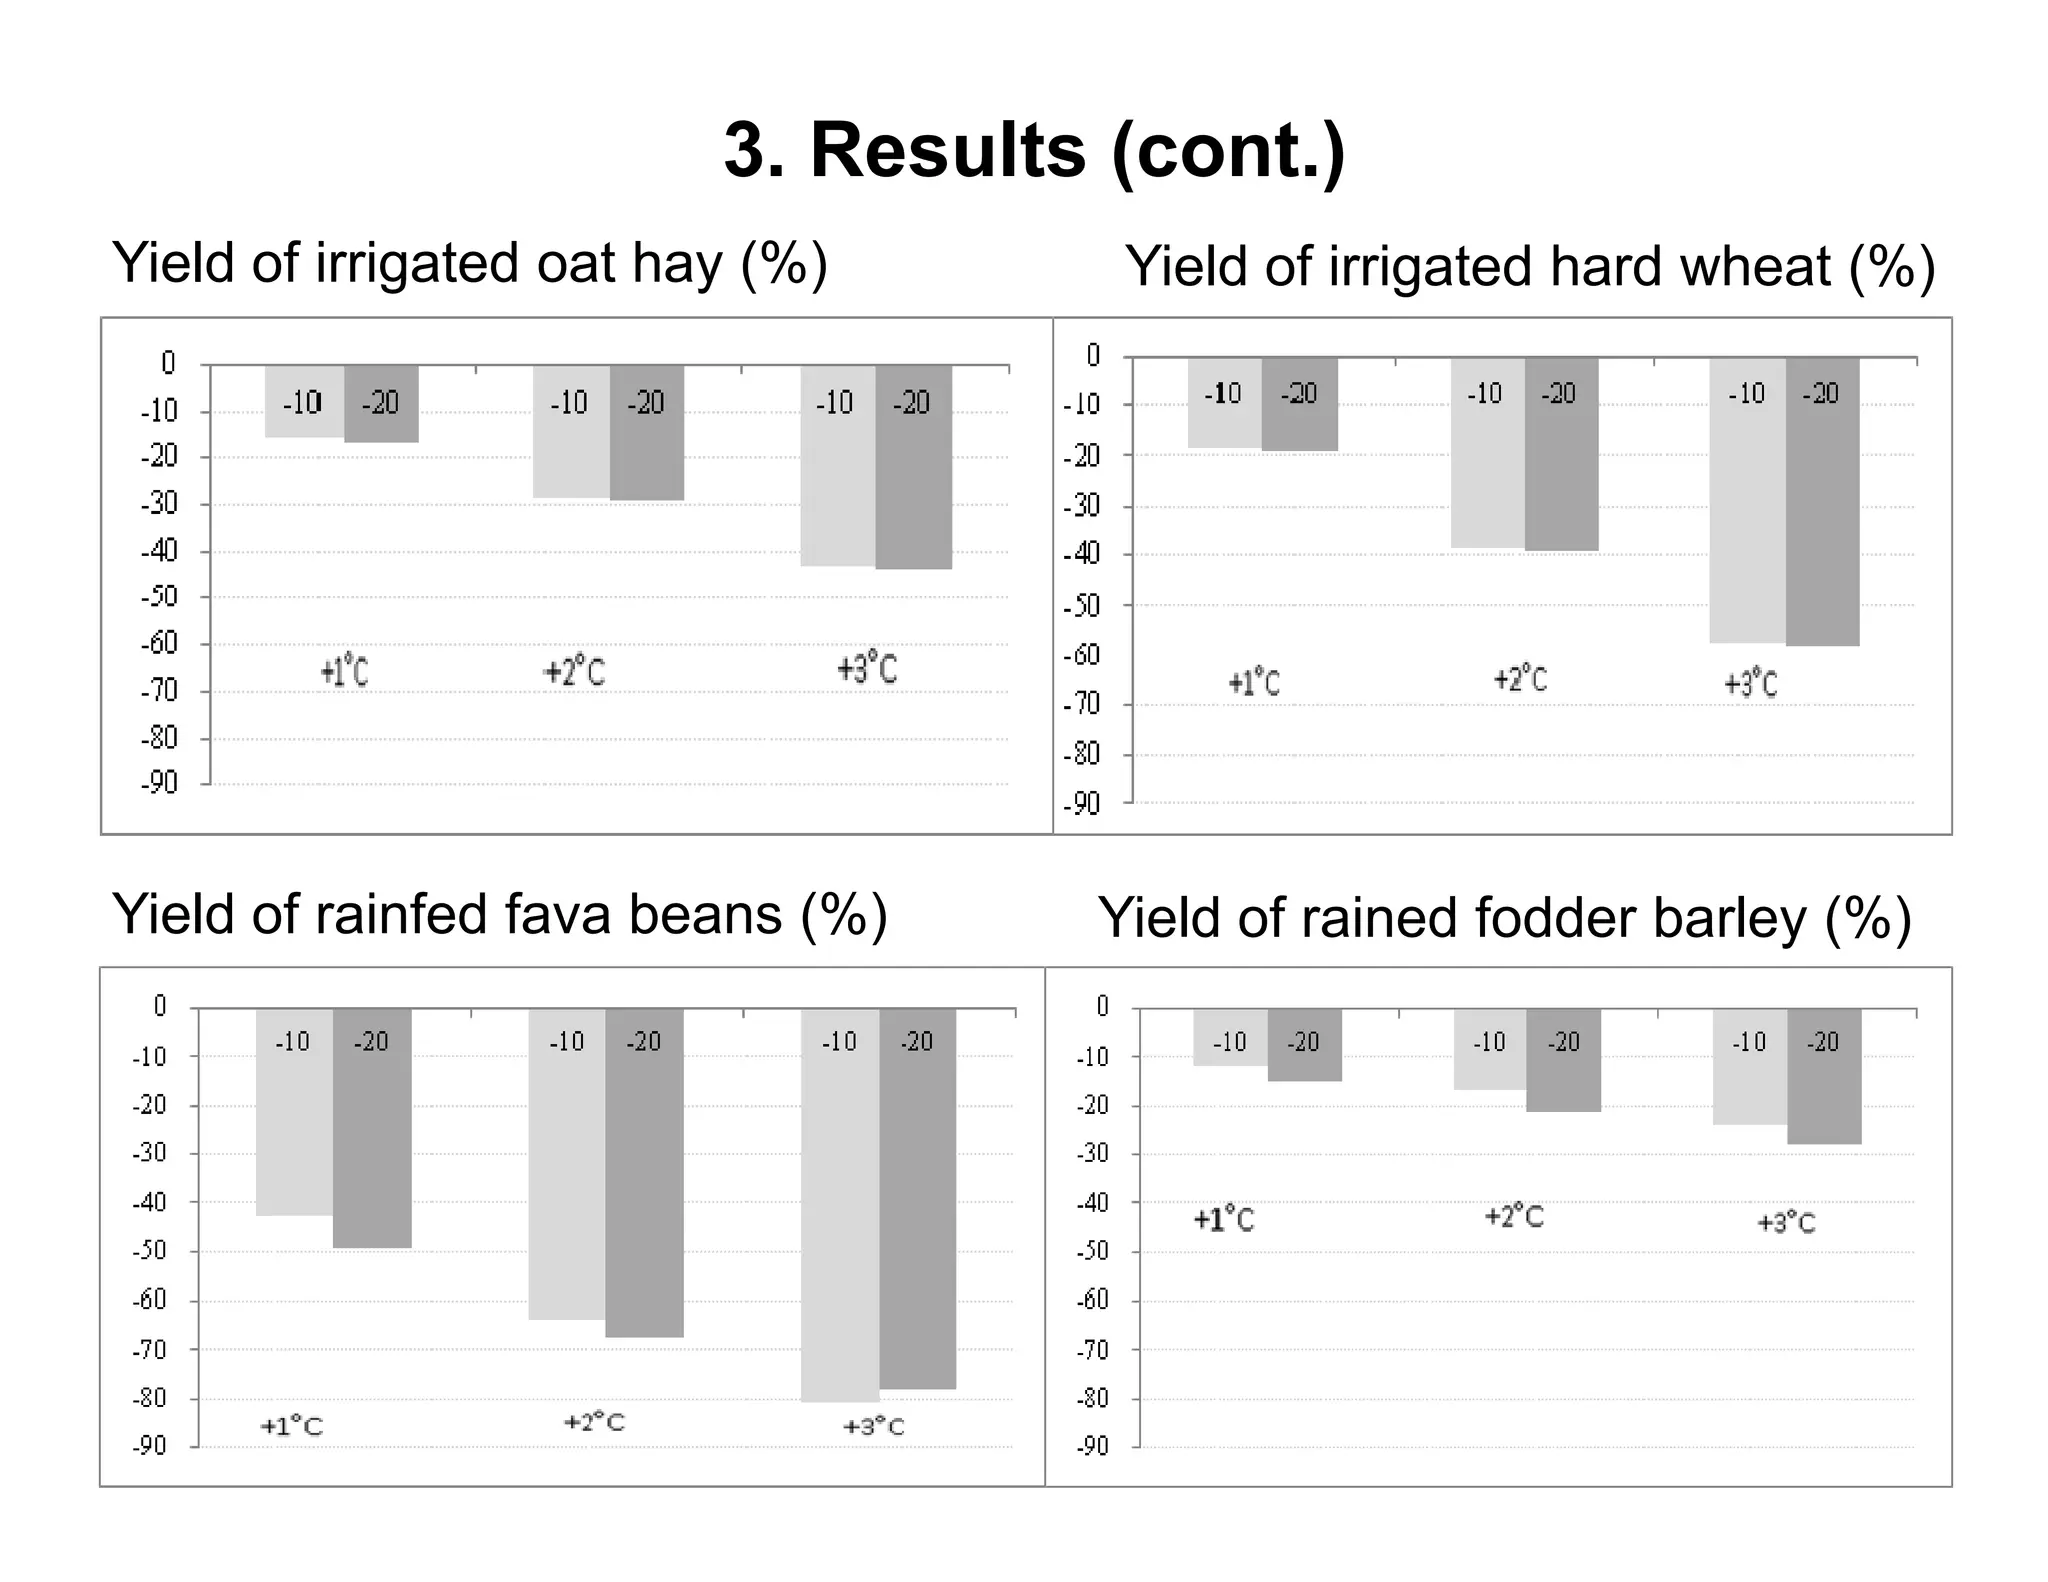
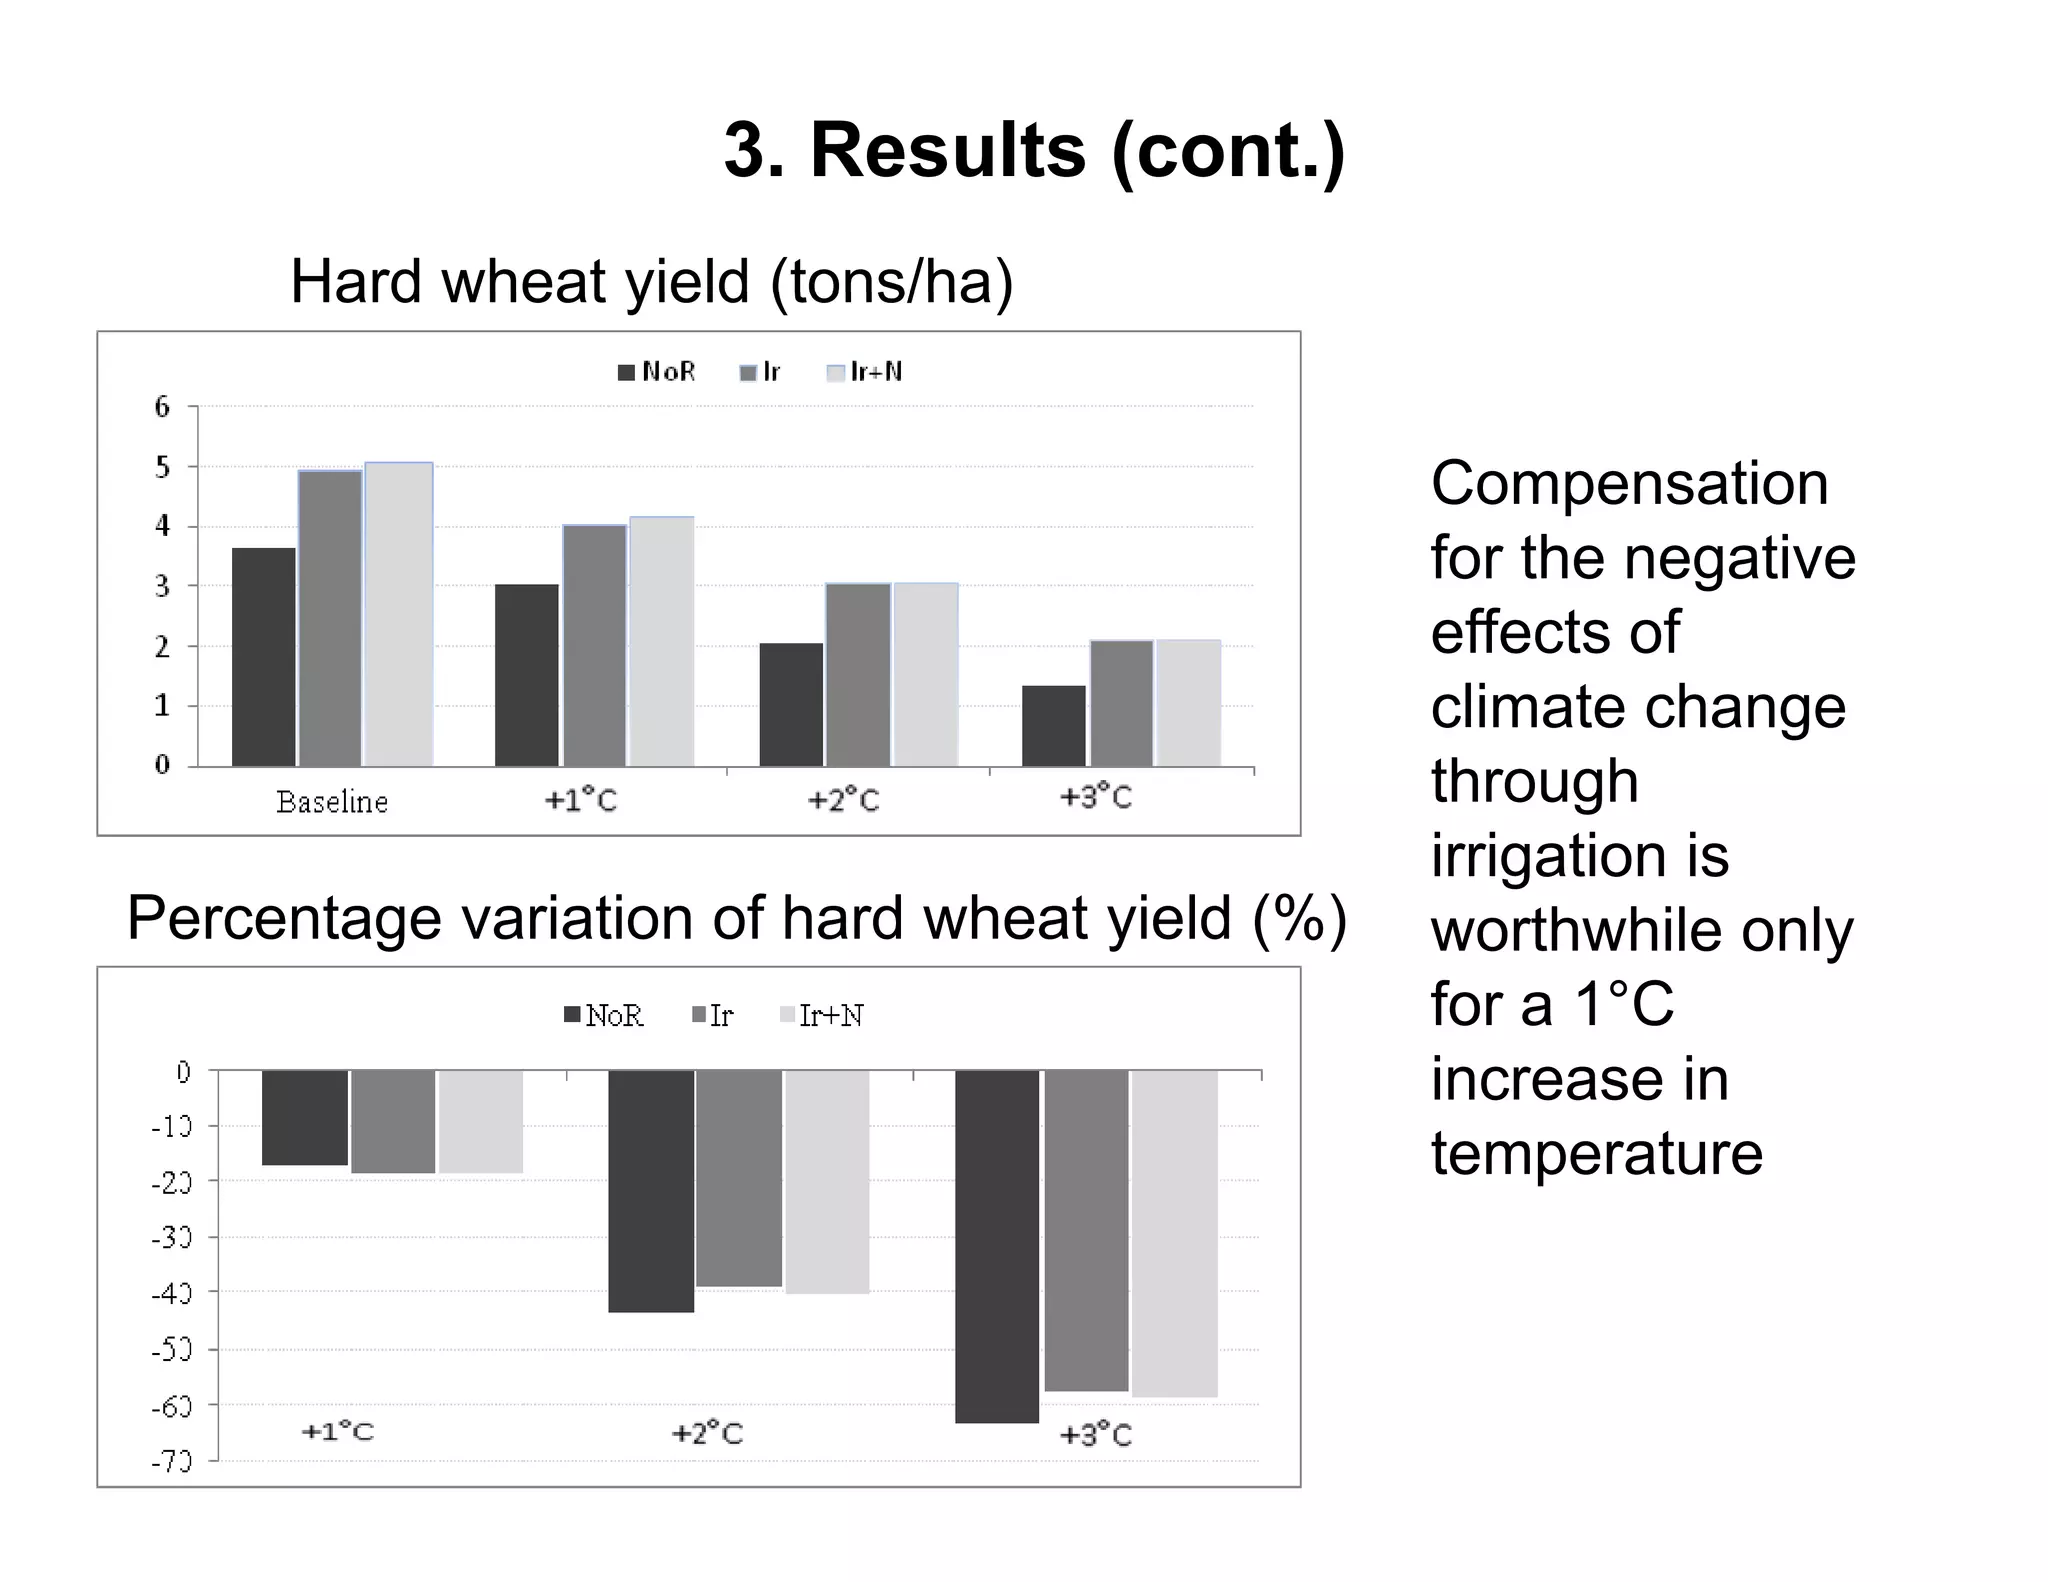
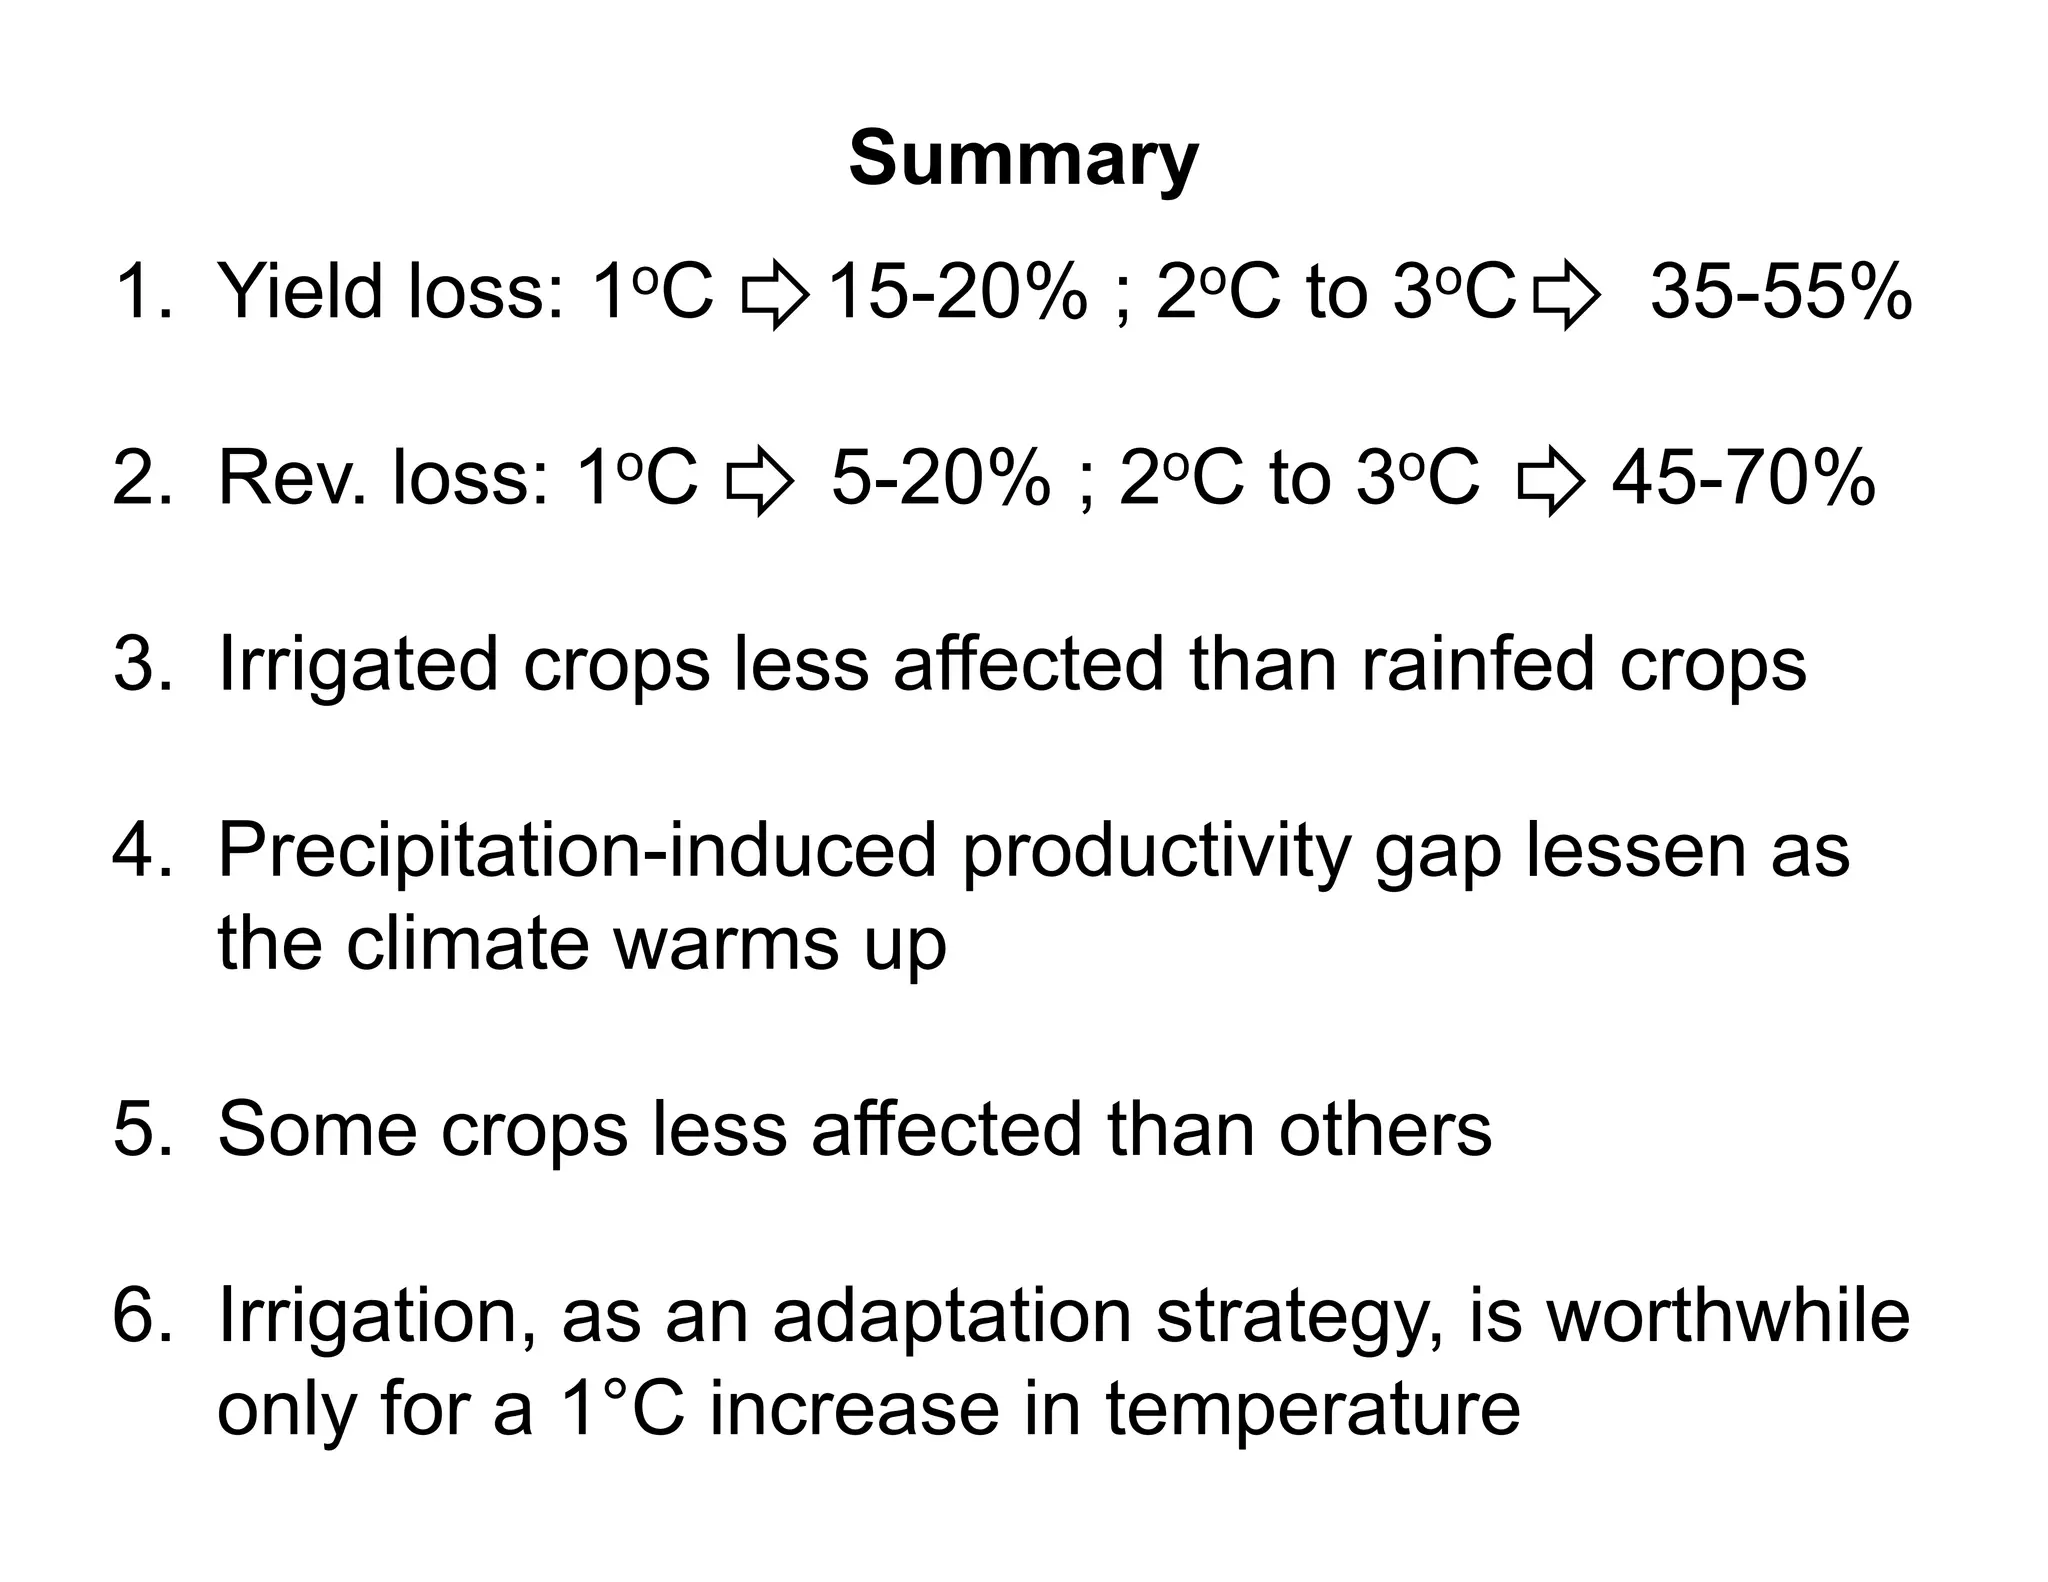
The document analyzes the impact of climate change on farm productivity and income through bioeconomic models, revealing significant productivity and income losses for both irrigated and rainfed crops. It indicates that productivity losses can range from 15-20% in the near term to 35-55% in the long run, with income losses projected between 5-20% and 45-70%, respectively. The findings suggest that irrigation can mitigate some negative effects of climate change, particularly for a 1°C increase in temperature.


![[Day 2] Center Presentation: IFPRI](https://cdn.slidesharecdn.com/ss_thumbnails/cgiar-csi-day2-1apr2009-center-ifpri-090405003244-phpapp02-thumbnail.jpg?width=640&height=640&fit=bounds)


