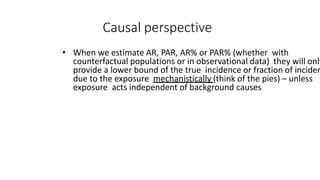
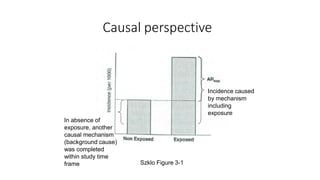
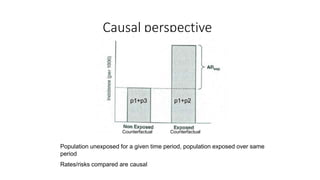
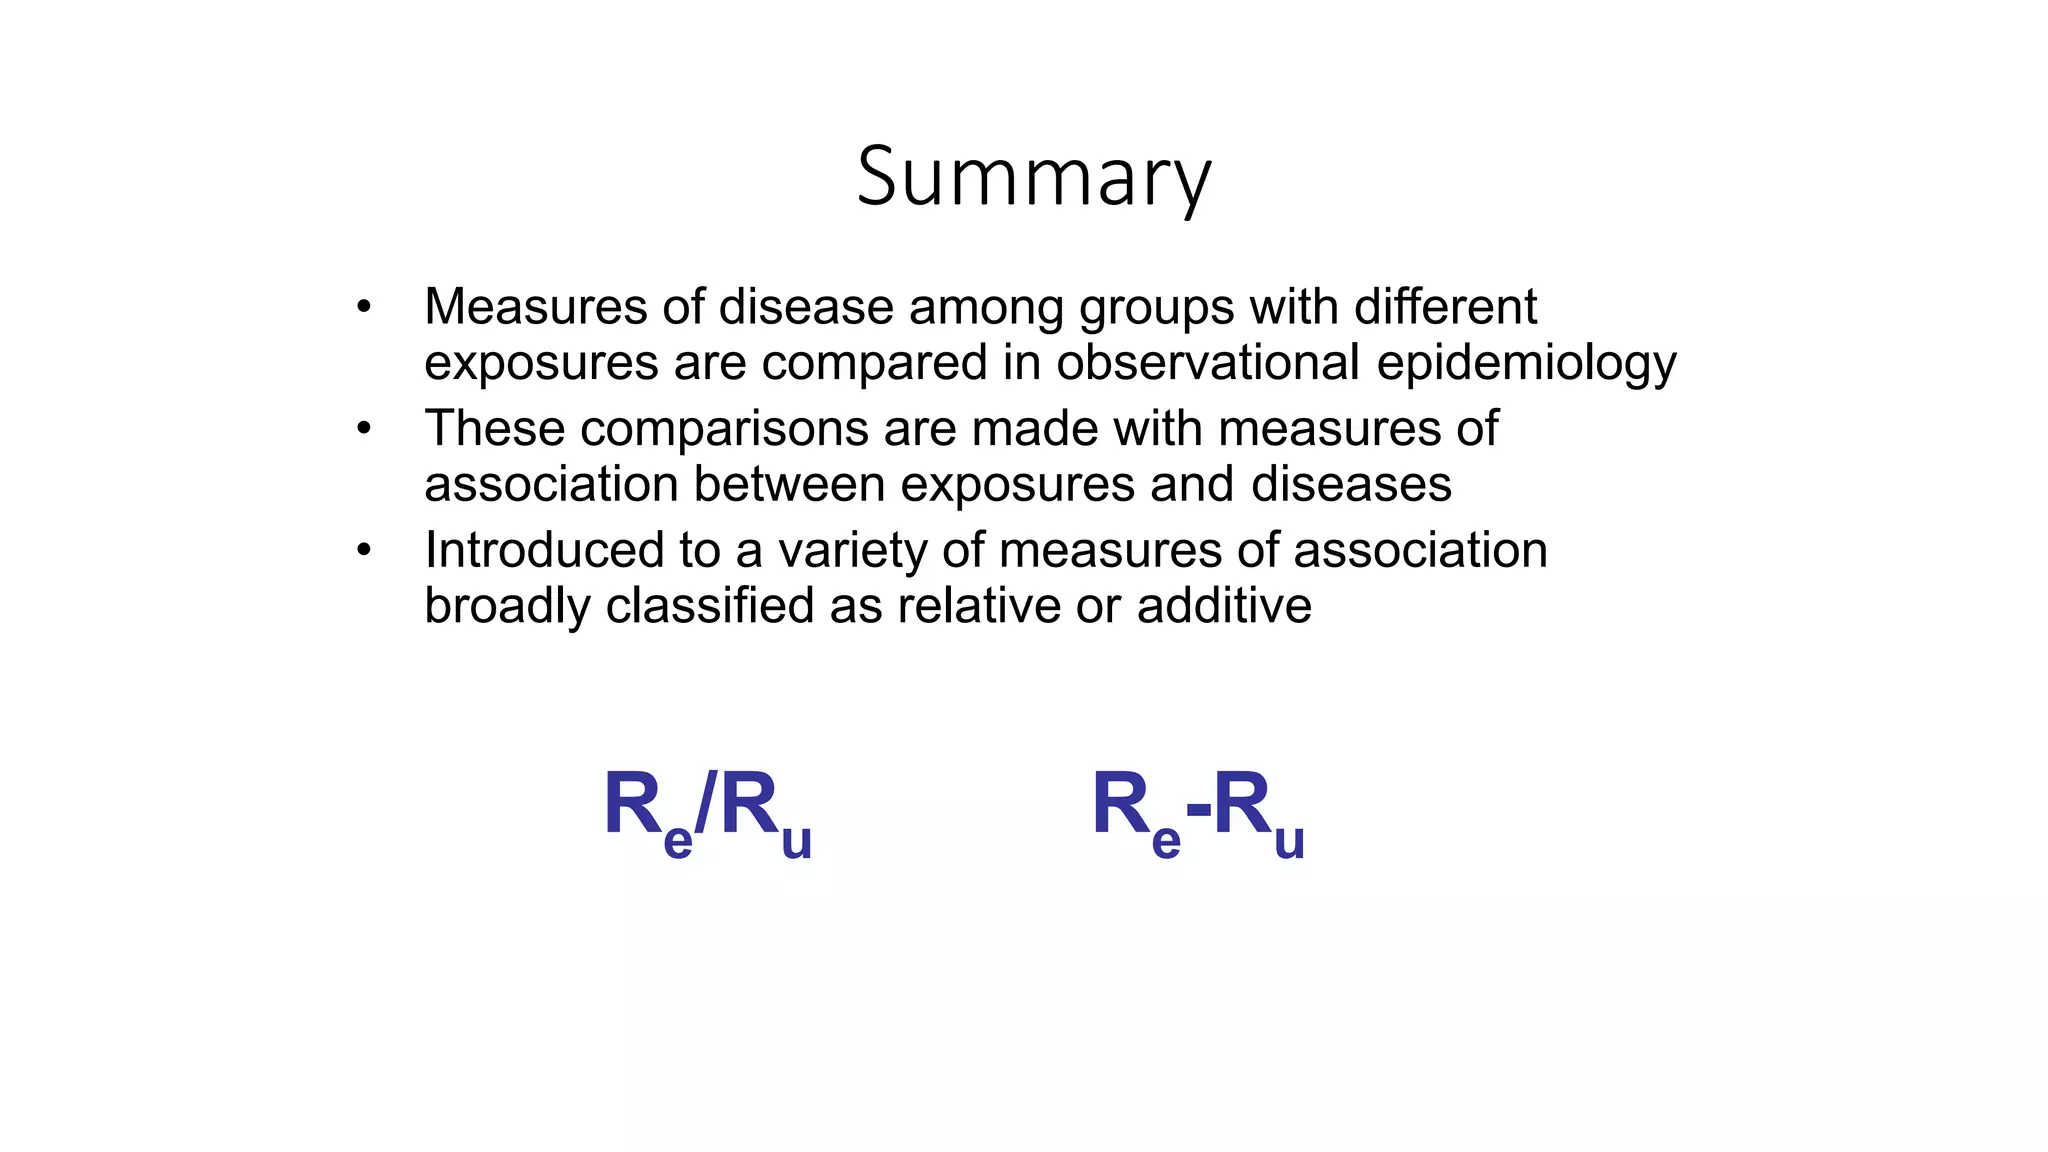
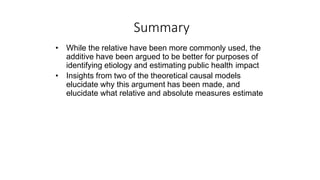
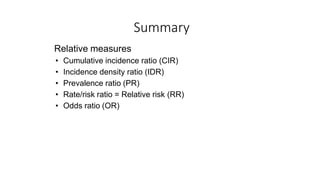
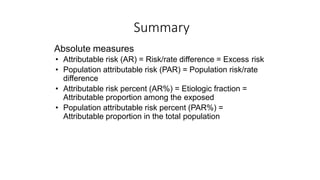
This document discusses measures of association used in observational epidemiology to compare disease rates between exposed and unexposed groups. It introduces both relative measures like risk ratios and odds ratios, as well as absolute measures like attributable risk and population attributable risk. While relative measures are more commonly used, absolute measures may better identify disease etiology and public health impact by taking into account differences in baseline risk between groups. However, these measures provide a lower bound on the true impact of an exposure, as individuals who develop disease due to other causes in the unexposed group are not distinguished.
Measures of disease association in observational epidemiology
1. Summary
• Measures of disease among groups with different
exposures are compared in observational epidemiology
• These comparisons are made with measures of
association between exposures and diseases
• Introduced to a variety of measures of association
broadly classified as relative or additive
Re/Ru Re-Ru
2. Summary
• While the relative have been more commonly used, the
additive have been argued to be better for purposes of
identifying etiology and estimating public health impact
• Insights from two of the theoretical causal models
elucidate why this argument has been made, and
elucidate what relative and absolute measures estimate
3. Summary
Variety of terms used for measures of association
discussed today
• “Risk” often used generically to include rates (ID), risks
(CI) and even prevalence
4. Summary
Relative measures
• Cumulative incidence ratio (CIR)
• Incidence density ratio (IDR)
• Prevalence ratio (PR)
• Rate/risk ratio = Relative risk (RR)
• Odds ratio (OR)
5. Summary
Absolute measures
• Attributable risk (AR) = Risk/rate difference = Excess risk
• Population attributable risk (PAR) = Population risk/rate
difference
• Attributable risk percent (AR%) = Etiologic fraction =
Attributable proportion among the exposed
• Population attributable risk percent (PAR%) =
Attributable proportion in the total population
6. Summary
• Have only examined what are called “crude” measures
of association
– Compared exposed and unexposed populations without
considering other variables that may differ between the
populations
– Later in the course we will discuss how to deal analytically with
other variables that may be different between the exposed and
unexposed and that thus make the populations not
exchangeable (to be discussed in confounding)
9. Absolute measures
• Alternative formulation:
• PAR = (AR)(Pe)
• Where does this come from?
• PAR = Rt – Ru
• PAR = [(Pe)Re + (1-Pe)Ru] - Ru
• PAR = (Pe)Re + Ru - (Pe)Ru - Ru
• PAR = (Pe)Re - (Pe)Ru
• PAR = (Re - Ru)(Pe)
• PAR = (AR)(Pe)
10. Causal perspective
• When we estimate AR, PAR, AR% or PAR% (whether with
counterfactual populations or in observational data) they will only
provide a lower bound of the true incidence or fraction of inciden
due to the exposure mechanistically (think of the pies) – unless
exposure acts independent of background causes
11. Causal perspective
Szklo Figure 3-1
Incidence caused
by mechanism
including
exposure
In absence of
exposure, another
causal mechanism
(background cause)
was completed
within study time
frame
12. Causal perspective
Population unexposed for a given time period, population exposed over same
period
Rates/risks compared are causal
p1+p3 p1+p2
Counterfactual Counterfactual
13. Causal perspective
• Extreme example – mechanism including your exposure
causes disease 1 day earlier than would have occurred
otherwise from background causes
• In the exposed, your exposure mechanistically caused
100% of disease
• In your data the rate of disease appears the same in the
exposed and unexposed and you infer 0% of disease
caused by your exposure (ME3 p63, 297 for elaborated
discussion)
• Type 2 (slide 74) individuals (in this example 100% of
them) had disease caused by exposure when exposed,
but caused by another mechanism when not exposed
• Thus incidence due to specific causal mechanisms
cannot be estimated from epidemiologic data
14. Relative measures
• OR – exposure OR vs disease OR
– Exposure OR = odds(E|D)/odds(E|Dnot)
– EOR = (a/c)/(b/d) = ad/bc
– Disease OR = odd(D|E)/odds(D|Enot)
– DOR = (a/b)/(c/d) = ad/bc
– Exposure OR = disease OR