Role of Geologists in Natural Hazard Mapping and Application_Dr Kyi Khin_MGSS...KYI KHIN
Every year, natural hazard events threaten lives and livelihoods, resulting in deaths and billions of dollars in damage. Many geoscientists and various institutions are working with many partners to monitor, assess, and conduct targeted research on a wide range of natural hazards so that policymakers and the public have the understanding to enhance preparedness, response and resilience. For planning and risk assessment to tackle the Natural Hazards for public awareness, alarming and evacuation, Hazard Maps are essentially needed for institutions and governmental working committees of Natural Disaster Prevention, in future.
Flooding is one of the most devastating natural
disasters in Nigeria. The impact of flooding on human activities
cannot be overemphasized. It can threaten human lives, their
property, environment and the economy. Different techniques
exist to manage and analyze the impact of flooding. Some of these
techniques have not been effective in management of flood
disaster. Remote sensing technique presents itself as an effective
and efficient means of managing flood disaster. In this study,
SPOT-10 image was used to perform land cover/ land use
classification of the study area. Advanced Space borne Thermal
Emission and Reflection Radiometer (ASTER) image of 2010 was
used to generate the Digital Elevation Model (DEM). The image
focal statistics were generated using the Spatial Analyst/
Neighborhood/Focal Statistics Tool in ArcMap. The contour map
was produced using the Spatial Analyst/ Surface/ Contour Tools.
The DEM generated from the focal statistics was reclassified into
different risk levels based on variation of elevation values. The
depression in the DEM was filled and used to create the flow
direction map. The flow accumulation map was produced using
the flow direction data as input image. The stream network and
watershed were equally generated and the stream vectorized. The
reclassified DEM, stream network and vectorized land cover
classes were integrated and used to analyze the impact of flood on
the classes. The result shows that 27.86% of the area studied will
be affected at very high risk flood level, 35.63% at high risk,
17.90% at moderate risk, 10.72% at low risk, and 7.89% at no
risk flood level. Built up area class will be mostly affected at very
high risk flood level while farmland will be affected at high risk
flood level. Oshoro, Imhekpeme, and Weppa communities will be
affected at very high risk flood inundation while Ivighe, Uneme,
Igoide and Iviari communities will be at risk at high risk flood
inundation level. It is recommended among others that buildings
that fall within the “Very High Risk” area should be identified
and occupants possibly relocated to other areas such as the “No
Risk” area.
GIS is an essential technology for all phases of emergency management preparation, mitigation, response, and recovery. Find out how GIS provides a foundation for comprehensive emergency management .
To prepare for and mitigate emergencies, GIS can map and model potential disasters to help visualize critical vulnerabilities and damage consequences. As rebuilding begins, GIS aids local, state, and federal agencies with technology that supports collaboration between multiple agencies.
Field data captured with mobile GIS provides the ability to add updates from remote locations for more efficient incident management. It also supplies rapid damage assessment and more accurate recovery operations.
APPLICATIONS OF REMOTE SENSING AND GIS TECHNOLOGIES IN FLOOD RISK MANAGEMENTrsmahabir
Flooding is the most common of all major disasters that regularly affect populations and results in extensive damage to property, infrastructure, natural resources, and even to loss of life. To ensure better outcomes, planning and execution of flood management projects must utilize knowledge on a wide range of factors, most of which are of a spatial nature. Advances in geospatial technologies, specifically remote sensing and Geographic Information Systems (GIS), have enabled the acquisition and analysis of data about the Earth's surface for flood mitigation projects in a faster, more efficient and more accurate manner.
Remote sensing and GIS have emerged as powerful tools to deal with various aspects of flood management in prevention, preparedness and relief management of flood disaster. GIS facilitates integration of spatial and non-spatial data such as rainfall and stream flows, river cross sections and profiles, and river basin characteristics, as well as other information such as historical flood maps, infrastructures, land use, and social and economic data. Such data sets are critical for the in-depth analysis and management of floods.
Remote sensing technologies have great potential in overcoming the information void in the Caribbean region. The observation, mapping, and representation of Earth’s surface have provided effective and timely information for monitoring floods and their effect. The potential of new air- and space-borne imaging technologies for improving hazard evaluation and risk reduction is continually being explored. They are relatively inexpensive and have the ability to provide information on several parameters that are crucial to flood mapping and monitoring.
The use of satellite imagery for improvement of disaster risk management, focusing on tsunami and earthquake. Major cases of Indian Ocean Tsunami, Central Java Earthquake and Japan Tsunami are selected as practical example for remote sensing analysis.
A Survey on Landslide Susceptibility Mapping Using Soft Computing Techniquesiosrjce
Landslide is a common phenomenon especially in tectonically fragile and sensitive mountainous
terrain which causes damage to both human lives and environment. The complex geological setting of the areas
in the mountainous region makes the land highly susceptible to landslides. Hence, landslide susceptibility
mapping is an important step towards landslide hazard and risk management. The accurate prediction of the
occurrence of the landslide is difficult and in the recent years various models for landslide susceptibility
mapping has been presented. GIS is a key factor for the modeling of landslide susceptibility maps. This paper
presents the review of ongoing research on various landslide susceptibility mapping techniques in the recent
years.
Disaster Management in Taiwan by using GIS technology.Pankaj Saini
Due to the particular geographical location and geological conditions, Taiwan suffers from many natural hazards, such as typhoons, flooding, landslides, land debris, and earthquakes.
which often cause series property damages and even life losses.
The sufferings and risks can be minimized by developing suitable strategies for disaster management.
6th International Disaster and Risk Conference IDRC 2016 Integrative Risk Management - Towards Resilient Cities. 28 August - 01 September 2016 in Davos, Switzerland
Geospatial Mapping of Health Facilities in Nangere Local Government Area of Y...ijtsrd
This paper is aimed at mapping healthcare facilities in the Nangere Local Government Area of Yobe State. Geospatial mapping of health care facilities was achieved by taking the geographic coordinates of all the healthcare facilities in the Local Government using the Global Positioning System Garmin GPS map 76CS receiver. The data were analyzed using ArcGIS 10.8 version software. The study identified primary and secondary health care facilities without any tertiary health care facility and also without a single private hospital or clinic across the entire eleven 11 political wards of Nangere Local Government Area. The findings revealed that 46 healthcare facilities were distributed across the eleven 11 political wards in the Local Government Area. The primary health care facilities PHC constituted 98 45 while the secondary Health Care facilities SHC constituted 2 1 . The average nearest neighbor summary for the study area shows the significant level and the critical level that indicates a random distribution pattern of health care facilities in the area, however, it was unevenly distributed given the concentration of health care facilities in Dazigau, Degubi, Darin, Pakarau, and Tikau while other wards were inadequately served. However, both the primary and secondary health care facilities were government owned, the study concluded that there were inequalities in the spatial distribution of health care facilities in the Nangere Local Government Area of Yobe state, thus this disparity in the distribution of health facilities has generated different accessibility level to health care facilities in the LGA, it, therefore, recommends that Government and the private organization should provide health care facilities in the wards that do not have enough health care facilities. This will further improve access to Health Care facilities in the study area. Ibrahim Abubakar Audu | Tijjani Bukar Lawan "Geospatial Mapping of Health Facilities in Nangere Local Government Area of Yobe State, Nigeria" Published in International Journal of Trend in Scientific Research and Development (ijtsrd), ISSN: 2456-6470, Volume-5 | Issue-4 , June 2021, URL: https://www.ijtsrd.compapers/ijtsrd42527.pdf Paper URL: https://www.ijtsrd.comother-scientific-research-area/other/42527/geospatial-mapping-of-health-facilities-in-nangere-local-government-area-of-yobe-state-nigeria/ibrahim-abubakar-audu
Skywards industries then showed their work in generating remote sensing data at a local level using drones. This can be used for mapping farms and assessing which crops are being grown. The drones can also be used for assessing agricultural health based on infrared reflectance. These images can then be reviewed by farmers in the field using tablets or mobile devices to assess areas of damage
Modul agisoft photoscan tingkat lanjut. Disini dibahas tentang ekstraksi kontur, pembuatan DTM, Point clouds classification, Mesh editing, dan Kalibrasi kamera guna memperoleh hasil pemodelan yang lebih baik.
Developing social vulnerability index for newcastle extreme temperature riskAlex Nwoko
This vocational dissertation was undertaken in collaboration with Newcastle City Council. This study was aimed at developing a quantitative social vulnerability indices for assessing extreme temperature vulnerability in Newcastle. This report is expected to help in identifying localized community-level social vulnerability determinants for emergency planning and response. The first objective of this study was to determine the social indicators which could contribute to increased losses on well-being. First, drawing theoretical justification from the literature and consultation with experts at Newcastle City Council, an initial set of indicators was collected from census data for 910 Output Areas (OAs) in Newcastle. These datasets were used to quantify to what extent their availability or lack can contribute to an overall increase or decrease in vulnerability in different parts of Newcastle. The summary of social vulnerability proxies developed in this study is presented in Chapter 3.
The second part of the analysis combines statistics and GIS to compare the relationship between sensitivity, adaptive capacity and enhanced exposure sub-indices and their components. The result of this investigation indicates that there is a significant statistical relationship between sensitivity and adaptive capacity, and also between sensitivity and enhanced exposure. The spatial relationship was tested using Getis Ord Gi* hotspot analysis and Ripley's K statistic, which found a significant clustering of vulnerability driven by both “sensitivity”, “adaptive capacity” and “enhanced exposure”. This study has identified the most vulnerable output areas in Newcastle in these wards; Walker, Elswick, Jesmond, Newburn, and Gosforth. From these observations, this report advocates the inclusion of social indicators in vulnerability analysis to reveal the marginalized population otherwise not acknowledged.
Finally, a proximity assessment of health and emergency services was carried out to reveal the southern cluster of emergency facilities and inefficient coverage of ambulance services. The identified accessibility-deprived output areas are located in the wards on the Northern parts including; Woolsington, Parkland, Fawdon, East and West Gosforth, and Castle.
This report summarizes by noting that the new framework is only intended to inform the periodic review of emergency planning and response strategies in Newcastle, suggesting an adoption of spatially detailed data to improve quantitative understanding of the spatial distribution of extreme temperature-related social vulnerability. It finally recommends an improvement in institutional adaptive capacity to handle emergencies in Newcastle.
To Establish Evacuation Decision-Making Selection Modes of Aboriginal Tribes ...IJERA Editor
In this study I try to utilize the concepts of ―environmental vulnerability‖ and ―evacuation behaviors among minority groups‖ and apply the evacuation selection mode generated from the public hazard perception to geographic information system, and analyze movement paths of residents during after disaster by using composite technology so that I can modify the suggested service scope and capacity of evacuation sites in the regions investigated in this study and provide minority groups with optimal selection mode.
Monitoring and Assesment of Landslide from Agastmuni to Sonprayagpaperpublications3
Abstract: The present work is concentrated on the landslides which are very common disaster in the Himalayan region. This specific research theme was attempted taking cues from preparation of a landslide inventory, damage assessment, hazard mapping and subsequently risk analysis. Moreover Landslide change detection of two event pre and post Digitized based on visual interpretation over LISS4 image.
Landslide inventory, a catalogue of present and past landslides prepared by comparing pre and post Kedarnath disaster from a high resolution IRSP6 LISS4 image. Multiple landslides are identified and marked along the Mandakini River course in the inventory map. For susceptibility mapping eight data layers viz Geology, Geomorphology, Slope, Aspect, Distance to lineament, Soil type stream order, NDVI and LULC were created from different sources like SRTM DEM (30M), high resolution multispectral image, soil map etc. Then by weighted overlay in which weights are assigned to each layer according to their influence, susceptibility map is prepared. The statistics of the map indicate that 4% of the area is under high susceptible zone.
After that vulnerability and risk assessment analysis was carried out considering agriculture, built-up and road as important elements. According to the obtained vulnerability map only 7% of the area is under high vulnerability zone where most of the built-up and road is concentrated. The final map is the risk map which shows that only 3% of the total area is under high risk zone.
Keywords: Landslide, Hazard Mapping, Susceptibility Map, Vulnerability Map, Risk Mapping.
Title: Monitoring and Assesment of Landslide from Agastmuni to Sonprayag
Author: Bushra Praveen
ISSN2349-7831
International Journal of Recent Research in Social Sciences and Humanities (IJRRSSH)
Paper Publications
Assessment of landslide susceptibility using geospatial analysis and interfer...Pavlos Krassakis
The main purpose of the current study, was to examine the assessment of landslide susceptibility in the mountainous Municipalities of Nafpaktia and Karpenisi (Central Greece) by using geospatial analysis via RES (Rock Engineering System) and interferometry data.
1. Landslides cause significant amounts of damage and economic loss in mountainous regions throughout the world. The continuous
growth of population and resulting urban sprawl creates an outcome where people are forced to live in areas that are more
vulnerable to landslides and other disturbances. Therefore, there is a growing need to understand what areas are most likely to be
affected by landslides and who will be impacted. Landslides can vary in shape, rate of movement and how the surface is affected
depending on the type of movement and material (Dahal 2008, Dai 2001, Wachel 2000).
Landslide hazard is defined as the probability of occurrence of a potentially damaging landslide within a given area (Hadmoko
2010). The main factors that affect the landslide hazard for any area include: lithology, geomorphology, soil depth, soil type, slope
gradient, elevation, land use, and drainage patters. Other external variables include, heavy rainfall, earthquakes and volcanic
activity. An expert based heuristic approach is used to establish a direct relationship between slope failures and the relevant terrain
parameters during the landslide inventory (Dahal 2008).
A Landslide Economic Risk Map is commonly produced when evaluating landslide susceptibility to determine individuals most
vulnerable in an area. Landslide Economic Risk is defined by the landslide potential along with the expected losses to life and
property during the event. The main goal here is to understand the areas where the greatest likelihood of landslides is to be
expected and the resulting damage from landslides (USGS 2014).
A Social-Vulnerability Map helps us understand the demographic and socio-economic status of the community in relation to the
landslide risk map. Loss in an event varies geographically, over time, among different social groups, and over time and space
(Cutter 2003). Vulnerability can be defined as the likelihood of being harmed by unforeseen events or as susceptibility to
exogenous shocks, which extends the traditional view on poverty. The susceptibility to a shock depends on the ability of avoidance
which is another aspect of risk management (Holzmann 2001).
The information provided by this work would be valuable to the local government in order to support decisions concerning land use
planning and future expansion in South Carolina. Detailed information on the specific types of properties, and infrastructures is
recommended to be included for future research. This project could help governmental agencies plan, coordinate and standardize
their approach to disaster management.
A GIS Based Modeling of Landslide Hazards and Potential Impacts on the Local Communities in the Upstate of South Carolina
Katie Caulfield and Suresh Muthukrishnan
Department of Earth and Environmental Sciences, Furman University, Greenville, SC 29613
III. Results
I. Introduction
II. Methodology
VI. Acknowledgements
V. Future Research
VII. References/ Data Sources
IV. Conclusion
The data collected from various sources were first re-projected (to UTM GCS 1983 17N) and clipped to the extent of the study area.
The data used for this study includes slope, aspect, land use, lithology, faults, rivers, roads, and precipitation. All of the data layers
were converted to raster format to facilitate carrying out spatial analysis. Thematic raster layers were reclassified and individual
classes were ranked based on their importance on a scale of 1-6, with 6 corresponding to a more favorable condition for occurrence
of landslide. The spatial database was constructed through a weighted overlay analysis (figure 3 and table 1).
In the Landslide Economic Risk Map, the main steps follow the Landslide Hazard Map in data collection from various sources and
construction of the spatial database from ArcGIS layers. This map uses four variables (slope, urban infrastructure, land use,
transportation infrastructure) that were weighted with a 1-6 parameter, with 6 being the highest risk using a heuristic method (figure 4
and table 2).
The Social-Vulnerability Map was created by intersecting data in census block group to analyze where the majority race, mean
income by race and percentage of age 18-25 and over 85 overlap spatially in the study area. This intersection created Population
Groups which was then given a corresponding number for easier reference (figure 5 and table 3). This map is viewed in conjunction
with previous work done on Landslide Hazards to see which Population Groups are living in different hazard areas, with particular
focus on the High Hazard areas.
The Landslide Hazard Map for the Upstate of South Carolina revealed that 0.001% of the study area is within the very high hazard (5)
area, while 6.4% of the study area falls within the very low hazard (1) area. The high hazard (4) area is 1.2% of the study area, 22.1%
of the study area falls within the medium hazard (3) area, and 70.3% fall into the low hazard (2) area of the study area (Table 1, Figure
3). The areas that have the highest percentage of high hazard are located in Pickens and Oconee Counties.
The Landslide Economic Risk Map for the Upstate of South Carolina revealed that 0.1% of the study area is within the high risk (6)
area, while 8.1% of the study area falls within the low risk (1) area. The medium-high risk (5) area is 0.6% of the study area, 0.3% and
4.6% of the study area falls within the two medium hazard (3 and 4) areas, and 86.4% fall into the medium-low hazard (2) area of the
study area (Figure 4, Table 2). In comparing the high risk (Risk 6) with the Landslide Hazard Map, 0% are in high hazard (5) areas, with
0.01% in the low hazard (1) area. There are 1.4% is in the medium-high (4) area, 54.9% is in the medium hazard (3) area, and 43.7%
in the medium-low hazard (2) area.
In the Social-Vulnerability Map, only two Population Groups live in the Very High Hazard Area (5), with Group 1 having a higher
percentage than Group 2. Every other Hazard Area has all the Population Groups living in them. Comparing the High Age categories to
one another, Group 2 is the higher percentage in the study area in the lower hazards (1-3) areas and in medium-high hazard (4) areas
Group 1 becomes the higher percentage in the study area. In comparing the Black categories to one another, Group 3 is the higher
percentage in the study area in the lower hazards (1-2) areas and Group 4 in the medium and medium-high hazards (3-4) areas.
Comparing income as a whole looks a little skewed because of the higher numbers under Whites than Blacks or African Americans but
if the two races are compared separately before seeing if the trends are the same then it is much easier. Interestingly, ‘Mean Above’
has a higher percentage of the study area in the lower hazard (1-3 or 4) areas and ‘Mean Below’ has a higher percentage of the study
area in the higher hazard (3 or 4-4 or 5) areas. This trend holds for both mean income levels and across all categories except
Low/Medium Age and Black or African American which is reversed (Figure 5, Table 4).
Landslides cause tremendous loss of life and property damage every year in mountainous areas. In these areas, landslide hazard
mapping is important to outline landslide susceptible areas. This paper presents an applied ArcGIS approach for assessing potential
slope instability, which is valuable for the Upstate of South Carolina in land use planning and identifying where greatest hazard and
risk areas are to be expected. Using ArcGIS, three levels of susceptibility, low, medium, and high, were mapped based on degree of
slope, aspect, rock type, distance from faults, distance from roads, distance from rivers and land cover. Most landslide hazard areas
area in Oconee and Pickens Counties while most landslide economic risk areas are in Spartanburg and Greenville Counties. These
high levels are not in overlapping counties but with increased urban sprawl there is a potential for development in high hazard areas
which is important to recognize and prevent.
A special thank you to Mike Winiski for his support and assistance on this project, without him this research would not be possible. We
also would like to thank everyone in the EES 201 Geographic Information Systems class and 472 Research and Analysis class for
their insights, suggestions and moral support along the way. Thanks to Furman Advantage Funding for providing the resources to
complete this work.
• Durre, Imke, Michael F. Squires, Russell S. Vose, Xungang Yin, Anthony Arguez, and Scott Applequist, 2012, NOAA's 1981-2010
U.S. Climate Normals: Monthly Precipitation, Snowfall, and Snow Depth: Journal of Applied Meteorology and Climatology, 2013.
• Horton, J. Wright, Jr., and Connie L. Dicken, 2001, Preliminary Digital Geologic Map of the Appalachian Piedmont and Blue Ridge,
South Carolina Segment: U.S. Geological Survey Open-File Report 01-298.
• Gesch, D.B., 2007, The National Elevation Dataset, in Maune, D., ed., Digital Elevation Model Technologies and Applications: The
DEM Users Manual, 2nd Edition: Bethesda, Maryland, American Society for Photogrammetry and Remote Sensing, p. 99-118.
• Minnesota Population Center, 2011, National Historical Geographic Information System: v. 2.0, 2014.
• South Carolina Geological Survey South Carolina Department of Natural Resources, 2006, Statewide DEM for SC: South Carolina
Department of Natural Resources, 2014.
• US Geological Survey, 2011, Gap Analysis Program (GAP): National Land Cover, v 2.
Table 2: Landslide Economic Risk Map Data
Landslide Risk Percentage of Study Area Km2 in Study Area
6 (High) 0.087% 10.5
5 0.6% 76.1
4 (Medium) 0.2% 28.5
3 4.6% 551.6
2 86.4% 10473.9
1 (Low) 8.1% 975.3
Total 12116
Table 1: Landslide Hazard Map Data
Landslide Hazard Percentage of Study Area Km2 in Study Area
5 (High) 0.001% 0.12
4 1.2% 142.6
3 (Medium) 22.2% 2684.5
2 70.3% 8513.6
1 (Low ) 6.4% 777.2
Total 12116
Table 3: Social-Vulnerability Map Methodology Labels
Population Group Attributes Population Group Name
Low/Medium Age and White and Mean
Below $45,000
Group 1
Low/Medium Age and White and Mean
Above $45,000
Group 2
Low/Medium Age and Black/African
American and Mean Below $25,000
Group 3
Low/Medium Age and Black/ African
American and Mean Above $25,000
Group 4
High Age and White and Mean Below
$45,000
Group 5
High Age and White and Mean Above
$45,000
Group 6
High Age and Black/ African American and
Mean Below $25,000
Group 7
High Age and Black/ African American and
Mean Above $25,000
Group 8
Figure 1: The study area is located in the Upstate of South
Carolina and covers the counties of Spartanburg, Greenville,
Pickens, Oconee, Cherokee, Laurens, and Anderson. The
area is in the foothills of the Appalachian Mountains. The
area is subject to a number of factors that favor the
occurrence of landslides, which includes steep slopes in the
mountains, a humid climate with heavy rainfall, and growing
sprawl centered around Greenville City. The areas are in the
Blue Ridge Escarpment and Piedmont Ecoregion (SCDNR,
2014).
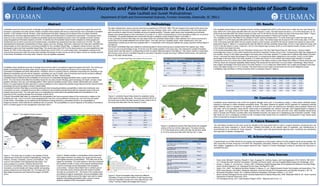
Figure 2: Spatial variation in precipitation shows areas that
have higher elevation and steep river gorges are the areas
with highest amounts of precipitation. This often acts as the
trigger for landslides. The area marked in dark blue represent
the conditions similar to many of the tropical rainforest areas
in terms of average annual precipitation and ecological
communities. Caesars Head State Park in northern part of
the Greenville county receives about 80 inches of rainfall
annually as compared to 40 – 55 inches in the coastal plains
and piedmont regions respectively. Annual precipitation data
from weather stations around the region was used to create
spatially interpolated precipitation data, using an inverse
distance weighted (IDW) interpolation method.
Figure 3: Landslide Hazard Map shows the weighted overlay
of the seven intrinsic data layers. The study showed 0.001% of
the study area is within the high hazard (5) area, while 6.4% of
the study area falls within the low hazard (1) area.
Figure 4: Landslide Economic Risk Map shows the weighted
overlay of the four intrinsic data layers. The study showed
0.1% of the study area is within the high risk (6) area, while
8.1% of the study area falls within the low risk (1) area.
Figure 5: Social-Vulnerability Map shows the different
Population Groups and their relation to high hazard areas.
Only two Population Groups live in the High Area (5), with
Group 1 having a higher percentage than Group 2.
Abstract
Landslides cause enormous amounts of damage and significant economic loss in mountainous regions throughout the world. An
increase in population and urban sprawl creates a situation where people start living in areas that are more vulnerable to landslide
hazards. In the Upstate of South Carolina, urban development has been creeping up the slopes of the mountains, therefore
addressing the concerns regarding safety of the communities and infrastructure is of paramount importance. The purpose of this
study is to use a heuristic model to evaluate the landslide hazard and landslide economic risk in the Upstate of South Carolina
using Geographical Information Systems (ArcGIS). To identify how the landslide hazard model compares to where people and
infrastructure are at risk to economic and societal losses, a landslide risk assessment was also carried out in ArcGIS. The data
representing the landscape characteristics of slope, aspect, land use, lithology, fault lines, roads and river lines were classified and
ranked based on their importance in promoting instability for the Landslide Hazard Map. A weighted overlay function was then
developed to derive the final Landslide Hazard Map. The results show that 0.001% of the study area is in an area classified as high
hazard, 22.148% of the study area is in medium hazard area, and 6.415% is in a low hazard area. Demographic analysis at the
census block group level within the study area indicates that people of mean income as well as higher income are equally exposed
to the threat of landslide in the study area, however, they are spatially separated.
Table 4: Socio-Economic Hazard Map Data
Percent of Group Populations by Hazard Group 1 Group 2 Group 3 Group 4 Group 5 Group 6 Group 7 Group 8
1 ( Very Low) 45.1% 49.0% 2.2% 0.5% 0.9% 2.1% 0.1% 0.1%
2 42.6% 51.9% 2.1% 1.2% 0.7% 1.2% 0.1% 0.1%
3 (Medium) 39.6% 54.4% 1.9% 1.9% 0.7% 1.2% 0.2% 0.1%
4 37.9% 59.2% 0.9% 0.9% 0.5% 0.5% 0.04% 0.03%
5 (Very High) 90.0% 10.0% 0.0% 0.0% 0.0% 0.0% 0.0% 0.0%