The document analyzes the implications of utility-scale solar development on public lands in 6 southwestern states where 19 solar energy zones were identified. Landscape condition and integrity models were used to assess the current landscape and quantify existing natural vegetation in each zone. Results showed the zones had landscape condition ratios below average, indicating they were suitable for solar development. The most prominent natural vegetation across the zones was basin shrubland and grassland, and developing solar panels was not expected to endanger these populations. Continued monitoring of the landscape condition was recommended to determine any negative impacts from implementing solar panels.
Remote sensing of the environment and Earth observation sciences are relatively young research domains that are highly interdisciplinary, combining expertise in biology, ecology, geography, physics, and computing science. Combining data from space-based and airborne sensors with traditional field observations provides powerful insights on how different ecosystems function and what drives changes in them at a global scale. With the turn of the 21st century we have seen a major expansion of our Earth observation capabilities with hundreds of new satellite systems in orbit around our planet and a myriad of new environmental sensor systems at the surface keeping an eye on how our planet is changing and how those changes influence our societies.
This presentation reviews the basics of remote sensing of vegetation biophysics for ecology and environmental monitoring and explores in greater depth how we can use these new technologies to better understand how more sensitive ecosystems respond to global change forces and can act as canaries in the coal mine for the early detection of climate change risks. I will also discuss how our research capabilities in this field are changing with the start-up of commercial aerospace agencies, the ever-decreasing size and cost of consumer electronics, and the emergence of affordable unmanned aerial vehicles, or ‘drones’.
Objective
Understand and quantify the nature of land-atmosphere interactions
- as they exist today
- as they may be modulated by the radiatively-driven component of climate change
- as they may evolve with changing land use
Report outlining the University of Adelaide and TERN's mapping of the ecological facets for continental Australia using globally consistent methods. The new maps capture the three major factors driving ecosystem formation-macroclimate, lithology and landform-with multiple spatial indicators. Vegetation structure has also been mapped and combined with the three indicators of ecosystem formation to produce 'ecological facets'.
Objectives:
- Develop an integrated agricultural and urban modeling system
- Characterize decadal and regional impacts associated with agriculture/urban expansion for selected regions in the continental US
- Examine socio-economic impacts associated with agri-urban development including urban farms/community gardens
- Educate next generation of interdisciplinary scientists
Connecting USDA and NSF Terrestrial Observation Network to Science PolicyBrian Wee
Large-scale environmental changes pose challenges that straddle environmental, economic, and social boundaries. As we design and implement climate adaptation strategies at the Federal, state, local, and tribal levels, accessible and usable data are essential for implementing actions that are informed by the best available information. Data-intensive science has been heralded as an enabler for scientific breakthroughs powered by advanced computing capabilities and interoperable data systems. Those same capabilities can be applied to data and information systems that facilitate the transformation of data into highly processed products.
At the interface of scientifically informed public policy and data intensive science lies the potential for producers of credible, integrated, multi-scalar environmental data like the National Ecological Observatory Network (NEON) and its partners to capitalize on data and informatics interoperability initiatives that enable the integration of environmental data from across credible data sources. NEON is designed to provide high-quality, long-term environmental data for research. These data are also meant to be repurposed for operational needs that like risk management, vulnerability assessments, resource management, and others. The proposed USDA Agriculture Research Service (ARS) Long Term Agro-ecosystem Research (LTAR) network is another example of such an environmental observatory that will produce credible data for environmental / agricultural forecasting and informing policy.
To facilitate data fusion across observatories like NEON and LTAR, there is a growing call for observation systems to more closely coordinate and standardize how variables are measured. Together with observation standards, cyberinfrastructure standards enable the proliferation of an ecosystem of applications that utilize diverse, high-quality, credible data. Interoperability facilitates the integration of data from multiple credible sources of data, and enables the repurposing of data for use at different geographical scales. Metadata that captures the transformation of data into value-added products (“provenance”) lends reproducability and transparency to the entire process. This way, the datasets and model code used to create any product can be examined by other parties.
This poster outlines a pathway for transforming environmental data into value-added products by various stakeholders to better inform sustainable agriculture using data from environmental observatories including NEON and LTAR.
This is the 7th lesson the course - Climate Change & Global Environment taught at the Faculty of Social Sciences and Humanities of the Rajarata University of Sri Lanka
- Explore how crop and forest management influences decadal scale climate predictions
- Improve the representation of managed ecosystems in Earth system models
- Specific focus on institutional strengths: soil carbon dynamics, pine plantation forestry, plant physiology under warming temperatures, forest nitrogen cycling
- Evaluate and reduce uncertainty associated with ecological processes in climate predictions
Presentation by Tor-Gunnar Vagen at the session on sustainable soil management in Africa at the European Development Days 2017. https://eudevdays.eu/sessions/sustainable-soil-management-foundation-africas-future
Modeling the Climate System: Is model-based science like model-based engineer...Steve Easterbrook
Keynote Talk given at the ACM/IEEE 18th International Conference on Model Driven Engineering Languages and Systems (Models 2015), Ottawa, September 2015.
Objectives
- Develop an integrated agricultural and urban modeling system
Characterize decadal and regional impacts associated with agriculture/urban expansion for selected regions in the continental US
- Examine socio-economic impacts associated with agri-urban development including urban farms/community gardens
- Educate next generation of interdisciplinary scientists
A Review on the Application of Natural Computing in Environmental InformaticsAndreas Kamilaris
Natural computing offers new opportunities to understand, model and analyze the complexity of the physical and human-created environment. This presentation examines the application of natural computing in environmental informatics, by investigating related work in this research field. Various nature-inspired techniques are presented, which have been employed to solve different relevant problems. Advantages and disadvantages of these techniques are discussed, together with analysis of how natural computing is generally used in environmental research.
Presented at EnviroInfo 2018 at Munich, Germany (September 2018)
Duplicate Posts is a WordPress Plugin that will clone or create a new draft of a Post and Page.
WordPress Plugin: DUPLICATE POST
https://wordpress.org/plugins/duplicate-post/
SLIDE #35: How to Duplicate a Page/Post in WordPress (Video)
https://youtu.be/B295t2pXsUw
CompTIA exam study guide presentations by instructor Brian Ferrill, PACE-IT (Progressive, Accelerated Certifications for Employment in Information Technology)
UST Holloran Center and SLLF: Technological, societal, and behavioral changes...Paul W. Taylor
Presentation to the State Legislative Leaders Foundation (SLLF)
and the Holloran Center for Ethical Leadership's Professions 2015 Upper Midwest Ethics & Leadership Summit (University of St. Thomas School of Law)
Marcellus Shale Wildlife/Nature Impacts Research Study from Nature ConservancyMarcellus Drilling News
A new "research study" published in the journal PLOS ONE, authored by the Nature Conservancy. The article is titled: "Shale Gas, Wind and Water: Assessing the Potential Cumulative Impacts of Energy Development on Ecosystem Services within the Marcellus Play." It attempts to make the case for centralized planning of Marcellus drilling in order to avoid undue impacts on wildlife and nature in the northeast.
The North America and Eurasia Arctic transects: Edie Barbour
Walker, D.A., Kuss, H.P., Kopecky, M., Frost, G.V., Kade, A., Vonlanthen, C., Raynolds, M.K., and Epstein, H., 2011, The North America and Eurasia Artctic transects: Using phytosociology and remote sensing to detect vegetation pattern and change: Proceedings Euiropean Vegetation Survey, 20th Workshop, Rome, 6-9 April 2011,
NISAR
Oil, Gas, and Water Underground Reservoirs
NASA
National Aeronautics and Space Administration
NASA-ISRO Synthetic Aperture Radar (NISAR)
By
Dr. Pankaj Dhussa
1. Landscape Implications of Utility Scale Solar Development on Public Lands, Garcia, S., Argonne
National Laboratory, Environmental Science Division, Aug. 2015
Abstract
The implications of utility scale solar development in 6 southwestern states, (Arizona, California,
Colorado, Nevada, New Mexico, and Utah), in which 19 solar energy zones were studied for solar
panel construction. To assess the current landscape condition of each SEZ (solar energy zone),
landscape and integrity condition models of the Central Basin Range, Mojave Basin Range, Sonoran
Desert, and San Luis Valley ecoregions were retrieved. Specific vegetation data was attained through
extraction, using the Extraction by Mask tool in the Spatial Analyst section of ArcGIS, in which the
data was quantified, and categorized onto a database. Data was calculated based on the percent of
existing natural vegetation relative to its ecoregion, and to its solar energy zone in acres. The
ecological integrity of the SEZs were also assessed based on risk values from 0 to 1, in which 0
represented an area of high environmental disturbance, and 1 represented an area of low environmental
disturbance. Results showed the 6 states were below the landscape condition ratio of 1.1, which
indicated the SEZs are in an attractive area to initiate the BLM Solar Energy Program. The natural
vegetation most prominent in the sites were basin shrubland & grassland and the implementation of the
solar panels would not endanger its population. It would be valuable to assess the landscape
throughout the years to determine if implementing the solar panels were a negative impact to the
landscape.
Introduction
There are more than 7 billion people inhabiting the Earth now, and a projected 9.6 billion by 2050.
How will the Earth support such an increase in population, particularly the use of our natural
resources? Our current production of coal will not be suffice with this demand, and an increase in
production will only be more detrimental to the Earth's core. The availability of natural resources has
defined contemporary human land use patterns both in time and space (Leu et al. 008). A proposed
solution would be to utilize our natural resources as a path towards the clean energy efforts. Utility-
scale solar energy development would be one solution that would reduce the environmental impacts of
green house gasses and other air pollution emissions. Although solar development does have quite a
few benefits, it also comes with potential adverse impacts associated with the construction, operation,
and decommissioning of solar power plants, (solarieis.anl.gov). Utility scale energy facilities cover
large areas of land which is needed to properly collect enough solar radiation to generate electricity at a
commercial scale. To construct these facilities it would entail the clearing out of the landscape,
resulting in various environmental direct and indirect impacts such as changes in soil moisture and
temperature, changes in hydrological conditions, changes in community structure and function, habitat
degradation, changes in productivity, and reduced diversity. Plant communities and habitats affected
by direct or indirect impacts from project activities could incur short- or longterm changes in species
composition, abundance, and distribution (Patton et al. 2013). Mechanical equipment for drilling, and
heavy equipment on site, will obstruct the soil cycle and therefore can cause contamination. The use of
dielectric fluids to quench electric discharges and other solvents, would release unwanted constituents
that can reduce the soil surface quality. Once this occurs, other resources, including vegetation, and
wildlife, can be ultimately affected. These impacts will continue through the life of the facility, and
may pose future threats to the health of the landscape, if ever the facility was decommissioned.
2. This report describes the strategy I took towards evaluating the impacts of solar development on
landscapes, specifically with determining existing natural vegetation and ecological intactness.
Landcover type data was used to help
identify areas of high conservation value
at local landscapes as well as ecological
intactness models. Landscape condition
assessments commonly apply principles
of landscape ecology with mapped
information to characterize ecological
condition for a given area (Comer et al.,
2012). Since human land uses such as
built infrastructure for transportation or
urban/industry, and land cover such as
for agriculture or other vegetation
alteration, are increasingly available in
mapped form, they can be used to
spatially model inferences about
ecological condition (Comer et al.,
2012). These maps provide information
such as the ecological intactness of an
unaltered area in which we can make
inferences. Intactness is a quantifiable
estimate of naturalness measured on a
gradient of anthropogenic influence and based on available spatial data (U.S., BLM, 2012). These
measurements range from 0 to 1, reflecting ecological stress or impact. A value that is closer to 1 is
considered a high quality ecosystem, while a value closer to 0 indicates a low quality ecosystem, such
as an area that has been industrialized. These analyses will enhance the planning of ecologically and
economically feasible strategies for new development such as solar or wind energy infrastructures on
public lands.
This study was an
extension to a larger
project run by the Bureau
of Land Management.
The BLM has developed a
solar energy program in
which a programmatic
environmental impact
statement, (PEIS), has
been established. Through
the Solar PEIS, the BLM
allows the permitting of
future solar energy
development projects on
public lands to proceed
in a more efficient,
standardized, and
environmentally
responsible manner
(blm.solar.anl.gov., 2014). The PEIS implements the proper mitigation of potential adverse impacts on
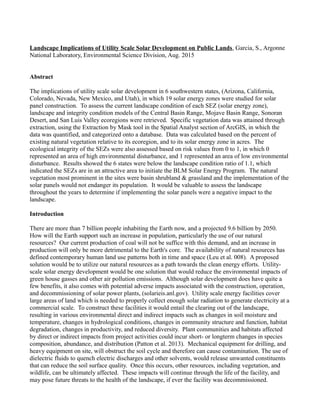
Figure 2: An SEZ is defined by the BLM as an area well-suited for utility-scale production of solar energy
where BLM will prioritize solar energy and associated transmission infrastructure development. The map
above shows the potential SEZ's that are being evaluated for future solar energy development.
Figure 1: This map shows the ecological intactness of the San Luis Valley ecoregion.
Intactness is measured from very low to very high.
3. the solar facility sites. The BLM has collaborated with scientists from Argonne National Laboratory to
examine 19 potential solar energy zones for utility scale production for solar energy. This area covers
approximately 338,000 acres of public land, located in the southwestern states of Arizona, California,
Colorado, Nevada, New Mexico, and Utah, in which ecological habitats such as natural vegetation
exists.
Methods
The geospatial data for this study was retrieved from landscape condition models through NatureServ,
SWRegap, and LandFire. Existing vegetation types were extracted from the models, using the extract
by mask tool, in the spatial analyst extension of ArcGIS, for each SEZ. This data, encoded into 30 x 30
cells, measured 1 sq meter per cell. Conversions were performed by calculating every 1 cell to
0.000247105 acres. Ecological
systems were compared and
categorized amongst all SEZs.
Landscape condition ratios
were averaged amongst all
SEZs and projected onto a box
plot graph, which represented a
description of how confident
the mean represents the true
landscape condition value. All
extractions and analyses were
performed using ArcGIS 10.2,
and data was categorized and
quantified onto a database.
ArcGIS allows us to analyze
and quantify large datasets of
ecological condition
throughout a vast ecoregion.
At a smaller scale, information
relating to ecological resources
is readily available, whereas
when dealing with a large area
or region, it is more difficult to obtain. Because obtaining quantitative information for ecological
resources at such large spatial scales is difficult, programmatic NEPA documents are often considered.
These evaluations often rely on sketchy or partial information such as recorded species occurrences,
species ranges, and general habitat descriptions. However, new spatial data and improved GIS tools
allow much more comprehensive and quantitative analyses using large, readily available datasets
(Walston et al., 2012).
Results
Average landscape condition ratios were compared for each SEZ and projected onto a box-plot graph.
The average overall ratio of above 1.1 represents the average condition of total areas in the four
ecoregions, which are Central Basin Range, Mojave Basin Range, Sonoran Desert, and San Luis Valley.
The landscape condition ratio is represented along the Y axis with scores between 0.6 to 1.2. SEZs in
all 5 states are in areas of lower landscape condition than other areas in the surrounding landscape. The
Figure 3: De Tilla Gulch SEZ, showing existing vegetation type extracted using ArcGIS.
4. error bars extending above the upper quartile of each box plot, indicates there are areas within that state
that have variability above the mean.
“Box and Whisker” (box plots) plots were developed to visualize the relative correspondence between
data sets. The “box” portion represents 50% of samples, while the “whisker” captures 95% of all
samples. We see variability occurring in
each state, with the most significant
difference occurring between California
and Nevada.
Natural vegetation was of most concern
when conducting this study. The most
abundant of all existing vegetation
found in the combined SEZs were
the Basin Shrubland & Grassland,
exhibiting more than half of the overall
vegetation located in the SEZs.
This type of vegetation lives in arid and
semi arid climate, with temperatures up to
100° Fahrenheit during the day, and 30°
Fahrenheit at night. Woodland,
Riparian/Wetland and Disturbed vegetation
made up the rest of the four ecoregions,
in which are also native to the area.
The chart below shows vegetation types found in the De Tilla Gulch SEZ, which were quantified and
categorized based upon amount of vegetation in acres, percent of vegetation in total area, amount of
vegetation in the ecoregion, and the percent vegetation in the total ecoregion. This chart is one of 19
that were prepared for the study. The remaining calculations for each SEZ are in the appendix section
of this report.
Figure 4: Box plot showing each SEZ in areas of lower landscape condition than other areas
in surrounding landscape.
Figure 5: Pie chart indicating breakdown of dominant vegetation type in total SEZs
5. Conclusion
In order to better understand the condition of existing landscapes, and to assess the effects of the
environmental impacts that may occur, we can use tools such as ArcGIS to retrieve landscape condition
data at larger spatial scales, and develop landscape integrity models. In this study, we used a
quantitative approach to more accurately determine if the construction of the solar panels will pose
environmental impacts on the 19 SEZs. According to our results, the current landscape condition of
each SEZ is below the average intactness value, which indicates that each SEZ is attractive and suitable
to begin solar panel construction. Using our quantitative method we were able to determine the most
abundant vegetation that occurred in the total SEZs, which was the Basin Shrubland & Grassland. If a
disturbance would occur on the landscape, then the Basin Shrubland would not be affected, being that
its population is dominant and thus will not endanger the population. These types of analysis allows
management to make important decisions such as future industrial developments. We can use these
techniques to predict ecological trends and conditions, and opportunities for resource conservation,
restoration, and development, (U.S. D.O.I, 2015). Overall the development of solar energy utilities will
not pose a harmful risk to natural vegetation within the SEZs. We can continue to monitor the
condition of the landscape throughout the years to properly mitigate any potential risks to the area.
Literature Cited:
Matthias Leu, Steven E. Hanser, and Steven T. Knick. 2008. The Human Footprint In The West: A
Large-Scale Analysis Of Anthropogenic Impacts. Ecological Applications Vol. 18, No. 5.
www.solarieis.anl.gov
Figure 6: The data shows the vegetation in the De Tilla Gulch SEZ, which was obtained through the extraction by mask spatial
analyst tool, ArcGIS. Green and blue indicates the existing natural vegetation found.
6. T. Patton, L. Almer, H. Hartmann, and K.P. Smith. Environmental Science Division, Argonne National
Laboratory. 2013. An Overview of Potential Environmental, Cultural, and Socioeconomic
Impacts and Mitigation Measures for Utility-Scale Solar Energy Development. ANL/EVS/R-
13/5.
Comer P. J. & J. Hak. 2012. Landscape Condition in the Conterminous United States. Spatial Model
Summary. NatureServ, Boulder, CO.
U.S. Department Of The Interior. Bureau of Land Management. 2012.
http://www.blm.gov/wo/st/en/prog/energy/solar_energy.html
Leroy J. Walston, Kirk E. LaGory, William Vinikour, Robert Van Lonkhuyzen, and Brian Cantwell.
2012. Improving Landscape-Level Environmental Impact Evaluations. ArcUser, Spring 2012.
Bureau of Land Management, Solar Energy Program Western Solar Plan. 2014.
http://blmsolar.anl.gov/program/
U.S. Department Of The Interior. Bureau of Land Management. 2015.
http://www.blm.gov/wo/st/en/prog/more/Landscape_Approach/reas.html