Penalized GLM
and
GBM Guide
Arno Candel, PhD
Tomas Nykodym
Patrick Hall
Penalized Generalized Linear Models
Part 1
Linear Modeling Methods
Ordinary Least Squares
Carl Friedrich Gauss
(1777–1855)
Elastic Net
Hui Zou and Trevor Hastie
Regularization and variable selection via the elastic net,
Journal of the Royal Statistical Society, 2005
Ordinary Least Squares Requirements
Requirements If	broken	…
Linear	relationship between	inputs	and	
targets;	normal	y,	normal	errors
Inappropriate	application/unreliable results; use	a	machine	learning	
technique;	use	GLM
N >	p Underspecified/unreliable results; use	LASSO or	elastic net	penalized	
regression	
No	strong	multicollinearity Ill-conditioned/unstable/unreliable results;	Use	
ridge(L2/Tikhonov)/elastic net	penalized	regression
No influential	outliers Biased predictions,	parameters,	and	statistical	tests;	use	robust	
methods,	i.e.	IRLS,	Huber	loss,	investigate/remove	outliers
Constant	variance/no heteroskedasticity Lessened	predictive accuracy,	invalidates	statistical	tests;	use	GLM	in	
some	cases
Limited	correlation	between	input	rows	
(no	autocorrelation)
Invalidates	statistical	tests;	use time-series	methods	or	machine	
learning	technique
Anatomy of GLM
Family/distribution defines
mean and variance of Y
Family/distribution allows for non-constant variance
Nonlinear link function between
linear component and E(Y)
Linear
component
Distributions / Loss Functions
For regression problems, there’s a large choice of different distributions
and related loss functions:
• Gaussian distribution, squared error loss, sensitive to outliers
• Laplace distribution, absolute error loss, more robust to outliers
• Huber loss, hybrid of squared error & absolute error, robust to outliers
• Poisson distribution (e.g., number of claims in a time period)
• Gamma distribution (e.g, size of insurance claims)
• Tweedie distribution (compound Poisson-Gamma)
• Binomial distribution, log-loss for binary classification
Also, H2O supports:
• Offsets
• Observation weights
Iteratively reweighted least squares (IRLS) complements
model fitting methods in the presence of outliers by:
• Initially setting all observations to an equal weight
• Fitting GLM parameters (β’s)
• Calculating the residuals of the fitted GLM
• Assigning observations with high residuals a lower weight
• Repeating until GLM parameters (β’s) converge
Iteratively Reweighed Least Squares
!" = min
'
( )* − !, − ( -*. ∗ !.
0
.12
3
4
*12
“Inner loop”
(ADMM optimization in H2O)
“Outer loop”
Regularization (e.g. Penalties)
Combining GLM, IRLS and Regularization
!" = min
'
( )* − !, − ( -*. ∗ !.
0
.12
3
4
*12
+ 	7((9 ∗ |!.| + 1 − 9 ∗ !.
3
)
0
.12
Error function for a GLM.
𝜆 controls magnitude of penalties. Variable selection conducted by refitting model
many times while varying 𝜆. Decreasing 𝜆 allows more variables in the model.
“Outermost loop” L2/Ridge/Tinkhonov penalty
helps address multicollinearity.
L1/LASSO helps
with variable
selection.
𝛼 tunes balance between L1 and L2 penalties,
i.e. elastic net.
• Inner loop: Fitting GLM parameters for a given 𝜆 and 𝛼
• Outer loop: IRLS until β’s converge
• Outermost loop: 𝜆 varies from 𝜆max to 0
Elastic net advantages over L1 or L2:
• Does not saturate at min(p, N)
• Allows groups of correlated variables
Outer most loop(s):
• 𝜆 search from 𝜆max (where all coefficients = 0) to 𝜆 = 0
• Grid search on alpha usually not necessary
• Just try a few: 0, 0.5, 0.95
• Always keep some L2
• Set max_predictors, large models take longer
• Models can also be validated:
• Validation and test partitioning available
• Cross-validated (k-fold, CV predictions available)
Hyperparameter Selection
•P-values available for non-penalized models
•β constraints available, i.e. for all positive β’s
•Use IRLS optimization for tall, skinny data sets
•L1 OR LBFGS for wide data (> 500 predictors)
• (L1 AND LBFGS possible, but can be slower)
Practical Pointers
Gradient Boosting Machines
Part 2
GBM builds a sequential ensemble of decision trees: each tree attempts to correct the mis-
predictions of all previous trees
…
First tree models
the data.
Data is sampled with
replacement for each tree
(iteration). Both rows and
columns can be sampled.
Each subsequent tree models the residuals of the previous trees.
(Equivalent to a gradient-based update to model predictions)
Gradient Boosting Machines
Jerome H. Friedman
Greedy function approximation: a gradient boosting machine
Annals of statistics, 2001
Ensemble models: Intuition
•Stability: the predictions of ensemble models are stable w.r.t. minor perturbations of
training data
• Variable hiding: important variables are often correlated and can hide one-another
(only the single most important variable from a group of important correlated
variables will be used in many models); in different samples, many different
important variables can shine through
• Representative samples: some samples can be highly representative of new data
15
Distributed Gradient Boosting Machine
find optimal split
(feature & value)
• H2O: First open-source implementation of scalable,
distributed Gradient Boosting Machine - fully featured
• Each tree is built in parallel on the entire compute cluster
• Discretization (binning) for speedup without loss of
accuracy
age < 25 ?
Y N
all data
age
1 118
income
1 1M
Analytical error
best split: age 25
H2O: discretized into
1 118
age 25
age
16
map()
map()
map()
map()
map()
map()
map()
map()
map()
map()
map()
map()
map()
map()
map()
map()
map()
map()
map()
map()
map()
map()
map()
map()
driver
Algo calls

histogram
method
data parallelism - global histogram computation
Scalable Distributed Histogram Calculation
global histogram
local histogram - one each for w, w*y and w*y2
w: observation weights
y : response
Same results as
if computed on
a single
compute node
• GBM builds a sequential ensemble of decision trees: each tree
attempts to correct the mis-predictions of all previous trees
• Each decision tree partitions the training data iteratively (left vs right)
• Splits are found by an approximated exhaustive search
(all features, all values)
• Stop splitting if
• max depth is reached
• no error decrease from further splitting
• Number of leaves grows exponentially, model complexity (training/
scoring time and storage) grows as O(ntrees * 2^max_depth)
• Training is iterative: can stop at any point and continue training
Model Complexity
Validation Schemes
• Validation data can be created upfront (e.g., a split)
• for big data, it’s usually fine to not use all the data for training
• 60%/20%/20% train/valid/test splits are usually fine for big data
• Validation data can be held out in N-fold cross-validation
• best for smaller datasets or when validation is critical
• e.g.: 80%/20% train/test, 5-fold CV on the 80%, final testing on
20%
• Random shuffling only works for i.i.d. distribution
• If the data is non-i.i.d., has structure (time, events, etc.), you must
stratify!
Validate properly
Training data Model training
Validation data Parameter tuning
Testing data Final estimate of generalization error
Establishing Baselines
• Train default GBM, GLM, DRF, DL models and inspect
convergence plots, train/validation metrics and variable
importances
• Train a few extra default GBM models, with:
- max_depth=3 “Do Interactions matter at all?”
- max_depth=7 “I feel lucky”
- max_depth=10 “Master memorizer”
• Develop a feel for the problem and the holdout performance of
the different models
Develop a Feel
Viewing Models in Flow
• Inspect the model in Flow during training: getModel ‘model_id’
• If the model is wrong (wrong architecture, response, parameters, etc.), cancel it
• If the model is taking too long, cancel and decrease model complexity
• If the model is performing badly, cancel and increase model complexity
Cancel early, cancel often
Use Early Stopping!
(Off by default)
Before: build as many trees as
specified - can overfit on training
data
Now: stop training once user-specified metric
converges, e.g., stopping_rounds=2,
stopping_metric=“logloss”,
stopping_tolerance=1e-3, score_tree_interval=10
Early stopping saves time and leads to higher accuracy
validation error increases
overfitting
best model
training error
decreases
early stopping finds
optimal number of
trees
BNP Paribas Kaggle dataset
Distributions / Loss Functions
• For regression problems, there’s a large choice of different distributions
and related loss functions, just like in GLM.
• GBM also supports Quantile regression (e.g., predict the 80-th percentile)
Do your math!
y
X
90th
50th
10th
HyperParameter Search
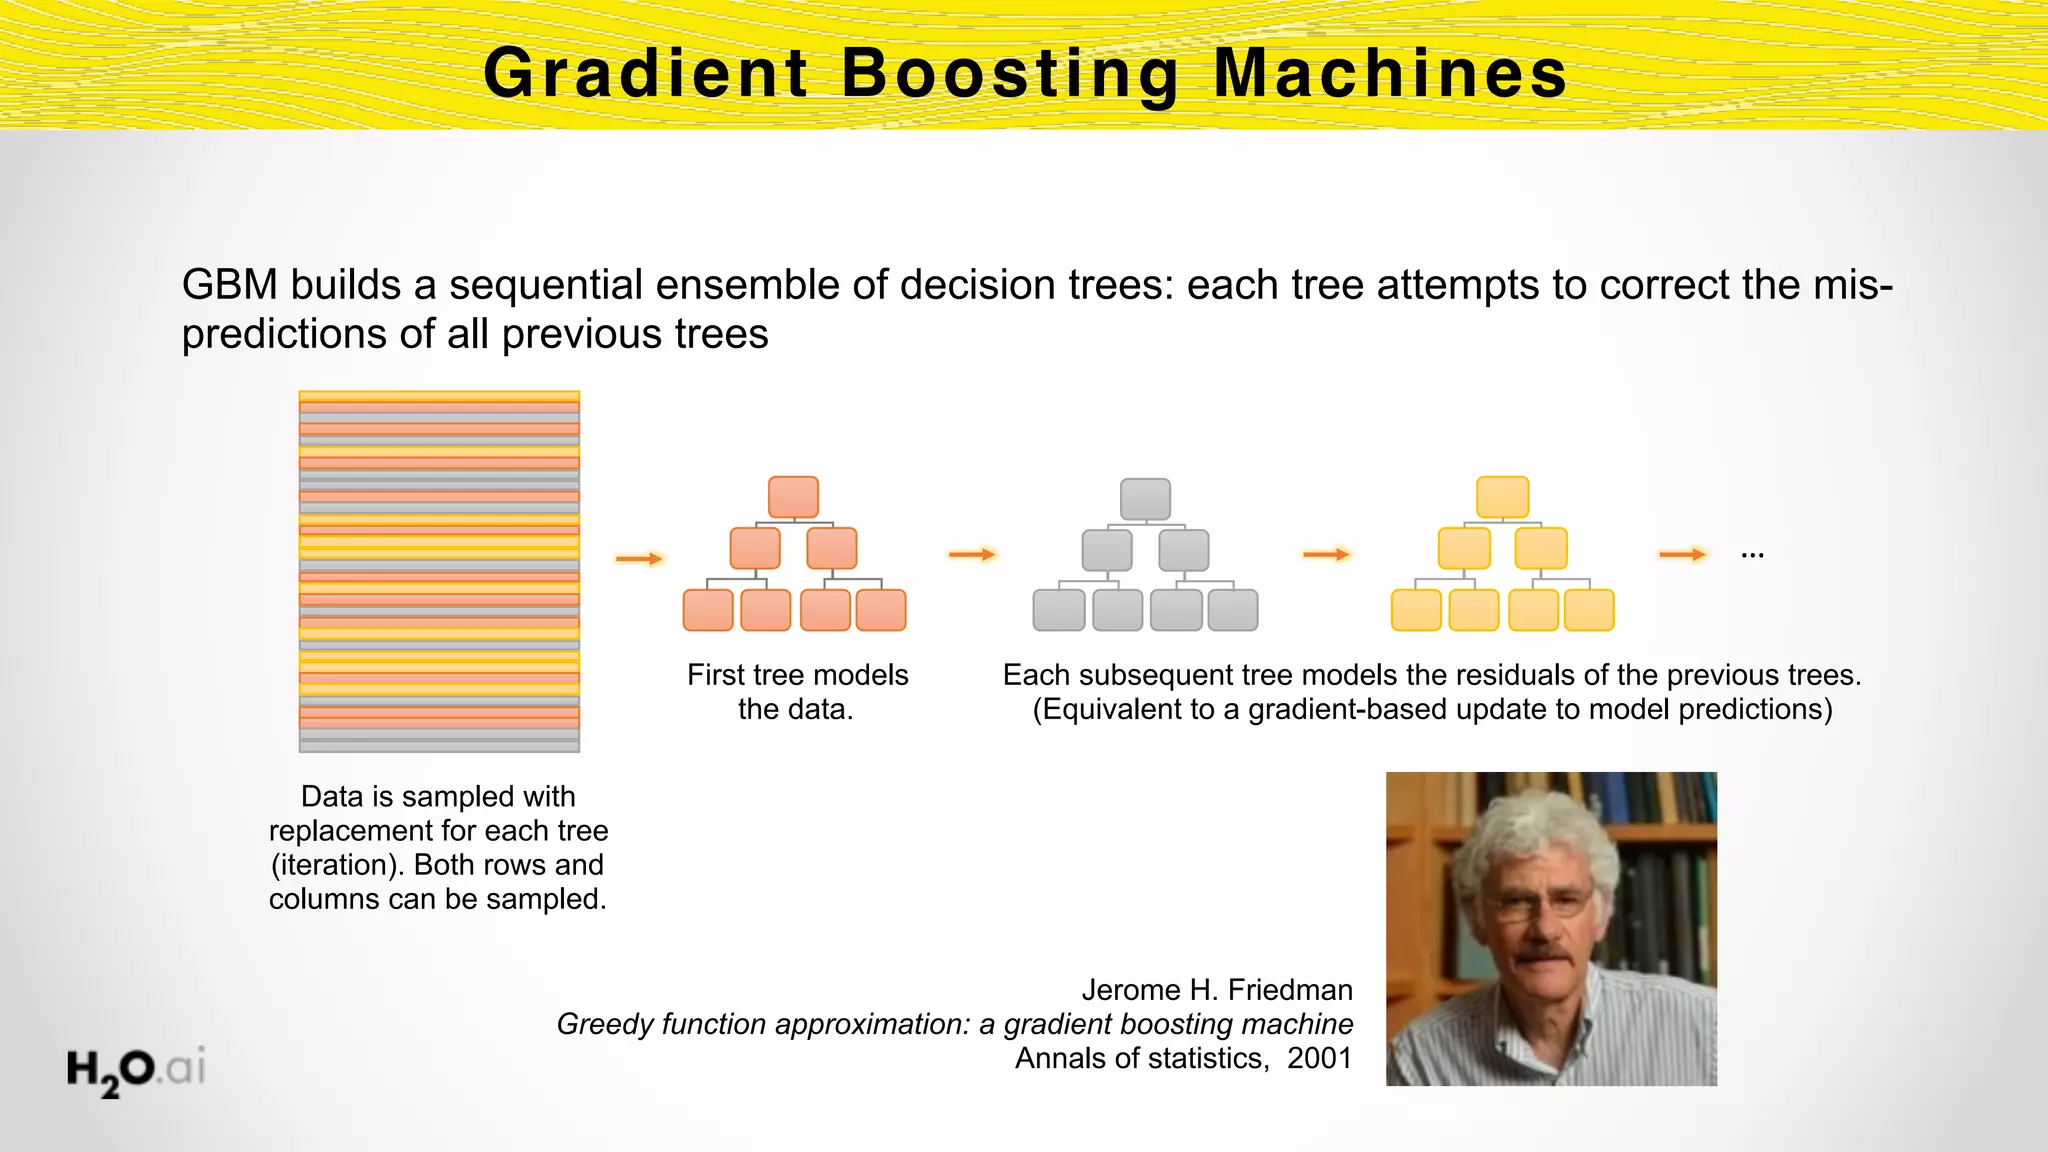
Just need to find one of the many good models
There are a lot of hyper parameters for H2O GBM. Many are for expert-level
fine control and do not significantly affect the model performance.
The most important parameters to tune for GBM are

(e.g., with a Random search via strategy = “RandomDiscrete”):
• max_depth = [1,2,…,25]
• learn_rate = [0.01,0.02,0.03,0.05,0.1]
• sample_rate = [0.2,…,1]
• col_sample_rate = [0.2,…,1]
• min_rows = [1,2,…,20]
• nbins_cats = [10, 100, 1000, 10000]
• histogram_type = [“UniformAdaptive”, “QuantilesGlobal”]
• stopping_rounds = 3 (together with ntrees=5000 or so)
Partial Dependence Plots
Trust and Understanding
Partial dependence plots for the well-known California housing data set.
Partial dependence plots display the mean prediction for a given model and a given value of a dependent variable,
over the range of the dependent variable.
Partial dependence plots now available in R, Python, and Flow.
Questions?

GLM & GBM in H2O

  • 1.
    Penalized GLM and GBM Guide ArnoCandel, PhD Tomas Nykodym Patrick Hall
  • 2.
  • 3.
    Linear Modeling Methods OrdinaryLeast Squares Carl Friedrich Gauss (1777–1855) Elastic Net Hui Zou and Trevor Hastie Regularization and variable selection via the elastic net, Journal of the Royal Statistical Society, 2005
  • 4.
    Ordinary Least SquaresRequirements Requirements If broken … Linear relationship between inputs and targets; normal y, normal errors Inappropriate application/unreliable results; use a machine learning technique; use GLM N > p Underspecified/unreliable results; use LASSO or elastic net penalized regression No strong multicollinearity Ill-conditioned/unstable/unreliable results; Use ridge(L2/Tikhonov)/elastic net penalized regression No influential outliers Biased predictions, parameters, and statistical tests; use robust methods, i.e. IRLS, Huber loss, investigate/remove outliers Constant variance/no heteroskedasticity Lessened predictive accuracy, invalidates statistical tests; use GLM in some cases Limited correlation between input rows (no autocorrelation) Invalidates statistical tests; use time-series methods or machine learning technique
  • 5.
    Anatomy of GLM Family/distributiondefines mean and variance of Y Family/distribution allows for non-constant variance Nonlinear link function between linear component and E(Y) Linear component
  • 6.
    Distributions / LossFunctions For regression problems, there’s a large choice of different distributions and related loss functions: • Gaussian distribution, squared error loss, sensitive to outliers • Laplace distribution, absolute error loss, more robust to outliers • Huber loss, hybrid of squared error & absolute error, robust to outliers • Poisson distribution (e.g., number of claims in a time period) • Gamma distribution (e.g, size of insurance claims) • Tweedie distribution (compound Poisson-Gamma) • Binomial distribution, log-loss for binary classification Also, H2O supports: • Offsets • Observation weights
  • 7.
    Iteratively reweighted leastsquares (IRLS) complements model fitting methods in the presence of outliers by: • Initially setting all observations to an equal weight • Fitting GLM parameters (β’s) • Calculating the residuals of the fitted GLM • Assigning observations with high residuals a lower weight • Repeating until GLM parameters (β’s) converge Iteratively Reweighed Least Squares !" = min ' ( )* − !, − ( -*. ∗ !. 0 .12 3 4 *12 “Inner loop” (ADMM optimization in H2O) “Outer loop”
  • 8.
  • 9.
    Combining GLM, IRLSand Regularization !" = min ' ( )* − !, − ( -*. ∗ !. 0 .12 3 4 *12 + 7((9 ∗ |!.| + 1 − 9 ∗ !. 3 ) 0 .12 Error function for a GLM. 𝜆 controls magnitude of penalties. Variable selection conducted by refitting model many times while varying 𝜆. Decreasing 𝜆 allows more variables in the model. “Outermost loop” L2/Ridge/Tinkhonov penalty helps address multicollinearity. L1/LASSO helps with variable selection. 𝛼 tunes balance between L1 and L2 penalties, i.e. elastic net. • Inner loop: Fitting GLM parameters for a given 𝜆 and 𝛼 • Outer loop: IRLS until β’s converge • Outermost loop: 𝜆 varies from 𝜆max to 0 Elastic net advantages over L1 or L2: • Does not saturate at min(p, N) • Allows groups of correlated variables
  • 10.
    Outer most loop(s): •𝜆 search from 𝜆max (where all coefficients = 0) to 𝜆 = 0 • Grid search on alpha usually not necessary • Just try a few: 0, 0.5, 0.95 • Always keep some L2 • Set max_predictors, large models take longer • Models can also be validated: • Validation and test partitioning available • Cross-validated (k-fold, CV predictions available) Hyperparameter Selection
  • 11.
    •P-values available fornon-penalized models •β constraints available, i.e. for all positive β’s •Use IRLS optimization for tall, skinny data sets •L1 OR LBFGS for wide data (> 500 predictors) • (L1 AND LBFGS possible, but can be slower) Practical Pointers
  • 12.
  • 13.
    GBM builds asequential ensemble of decision trees: each tree attempts to correct the mis- predictions of all previous trees … First tree models the data. Data is sampled with replacement for each tree (iteration). Both rows and columns can be sampled. Each subsequent tree models the residuals of the previous trees. (Equivalent to a gradient-based update to model predictions) Gradient Boosting Machines Jerome H. Friedman Greedy function approximation: a gradient boosting machine Annals of statistics, 2001
  • 14.
    Ensemble models: Intuition •Stability:the predictions of ensemble models are stable w.r.t. minor perturbations of training data • Variable hiding: important variables are often correlated and can hide one-another (only the single most important variable from a group of important correlated variables will be used in many models); in different samples, many different important variables can shine through • Representative samples: some samples can be highly representative of new data
  • 15.
    15 Distributed Gradient BoostingMachine find optimal split (feature & value) • H2O: First open-source implementation of scalable, distributed Gradient Boosting Machine - fully featured • Each tree is built in parallel on the entire compute cluster • Discretization (binning) for speedup without loss of accuracy age < 25 ? Y N all data age 1 118 income 1 1M Analytical error best split: age 25 H2O: discretized into 1 118 age 25 age
  • 16.
    16 map() map() map() map() map() map() map() map() map() map() map() map() map() map() map() map() map() map() map() map() map() map() map() map() driver Algo calls
 histogram method data parallelism- global histogram computation Scalable Distributed Histogram Calculation global histogram local histogram - one each for w, w*y and w*y2 w: observation weights y : response Same results as if computed on a single compute node
  • 17.
    • GBM buildsa sequential ensemble of decision trees: each tree attempts to correct the mis-predictions of all previous trees • Each decision tree partitions the training data iteratively (left vs right) • Splits are found by an approximated exhaustive search (all features, all values) • Stop splitting if • max depth is reached • no error decrease from further splitting • Number of leaves grows exponentially, model complexity (training/ scoring time and storage) grows as O(ntrees * 2^max_depth) • Training is iterative: can stop at any point and continue training Model Complexity
  • 18.
    Validation Schemes • Validationdata can be created upfront (e.g., a split) • for big data, it’s usually fine to not use all the data for training • 60%/20%/20% train/valid/test splits are usually fine for big data • Validation data can be held out in N-fold cross-validation • best for smaller datasets or when validation is critical • e.g.: 80%/20% train/test, 5-fold CV on the 80%, final testing on 20% • Random shuffling only works for i.i.d. distribution • If the data is non-i.i.d., has structure (time, events, etc.), you must stratify! Validate properly Training data Model training Validation data Parameter tuning Testing data Final estimate of generalization error
  • 19.
    Establishing Baselines • Traindefault GBM, GLM, DRF, DL models and inspect convergence plots, train/validation metrics and variable importances • Train a few extra default GBM models, with: - max_depth=3 “Do Interactions matter at all?” - max_depth=7 “I feel lucky” - max_depth=10 “Master memorizer” • Develop a feel for the problem and the holdout performance of the different models Develop a Feel
  • 20.
    Viewing Models inFlow • Inspect the model in Flow during training: getModel ‘model_id’ • If the model is wrong (wrong architecture, response, parameters, etc.), cancel it • If the model is taking too long, cancel and decrease model complexity • If the model is performing badly, cancel and increase model complexity Cancel early, cancel often
  • 21.
    Use Early Stopping! (Offby default) Before: build as many trees as specified - can overfit on training data Now: stop training once user-specified metric converges, e.g., stopping_rounds=2, stopping_metric=“logloss”, stopping_tolerance=1e-3, score_tree_interval=10 Early stopping saves time and leads to higher accuracy validation error increases overfitting best model training error decreases early stopping finds optimal number of trees BNP Paribas Kaggle dataset
  • 22.
    Distributions / LossFunctions • For regression problems, there’s a large choice of different distributions and related loss functions, just like in GLM. • GBM also supports Quantile regression (e.g., predict the 80-th percentile) Do your math! y X 90th 50th 10th
  • 23.
    HyperParameter Search Just needto find one of the many good models There are a lot of hyper parameters for H2O GBM. Many are for expert-level fine control and do not significantly affect the model performance. The most important parameters to tune for GBM are
 (e.g., with a Random search via strategy = “RandomDiscrete”): • max_depth = [1,2,…,25] • learn_rate = [0.01,0.02,0.03,0.05,0.1] • sample_rate = [0.2,…,1] • col_sample_rate = [0.2,…,1] • min_rows = [1,2,…,20] • nbins_cats = [10, 100, 1000, 10000] • histogram_type = [“UniformAdaptive”, “QuantilesGlobal”] • stopping_rounds = 3 (together with ntrees=5000 or so)
  • 24.
    Partial Dependence Plots Trustand Understanding Partial dependence plots for the well-known California housing data set. Partial dependence plots display the mean prediction for a given model and a given value of a dependent variable, over the range of the dependent variable. Partial dependence plots now available in R, Python, and Flow.
  • 25.