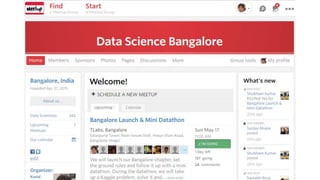
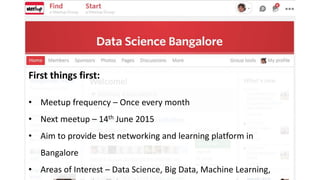
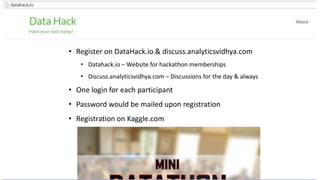
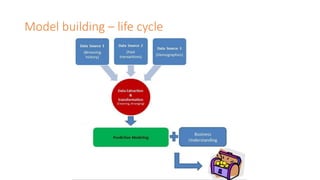
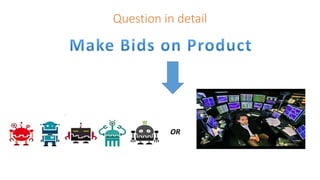
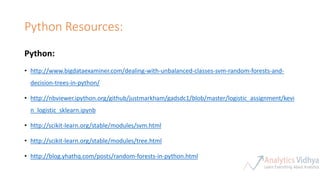
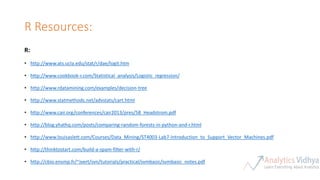
About Analytics Vidhya
Thanks Tlabs & Venturesity for being a lovely
host…
First things first:
• Meetup frequency – Once every month
• Next meetup – 14th June 2015
• Aim to provide best networking and learning platform in
Bangalore
• Areas of Interest – Data Science, Big Data, Machine Learning,
Meet Your Volunteers
Kunal
Data Science Evangelist,
(Growth) Hacker, Blogger,
Husband, Father
Tavish
Blogger, Problem solver,
Data scientist
Agenda
• Introduction
• Model building – life cycle
• Data Exploration and Feature Engineering methods
• Talk about modelling Techniques like
• Logistic Regression
• Decision Tree
• Random Forest
• SVM
• Predict Man vs. Machine
Introduction
• Name
• Experience in Data Science
• Current Company
• Are you proficient with (SAS/ R/ Python)?
Team creation
• Look for diversity in experience
• Hopefully common toolset, but complementary can also work
• Competing against each other
Team Formation
A few ground rules for today
• This is not a tutorial – you are expected to solve this problem yourself
• We are here to help you, organize your thoughts and to make sure
you are going in the right direction.
• Good question to ask:
• While trying Logistic regression in R, I am facing following error?
• Bad question to ask:
• Help me understand what is Logistic Regression!
• Register on DataHack.io & discuss.analyticsvidhya.com
• Datahack.io – Website for hackathon memberships
• Discuss.analyticsvidhya.com – Discussions for the day & always
• One login for each participant
• Password would be mailed upon registration
• Registration on Kaggle.com
Model building – life cycle
Problem of the day : FB challenge – Human or Robot
OR
Question in detail
Datasets you will have access to
Training Testing
Bids
Submission
Unique at Bid ID
Unique at Bidder ID
Unique at Bidder ID
Hypothesis generation
• In your groups, list down all possible variables, which might influence the
chances of survival of a passenger
• Download the dataset from Kaggle
• Next, look at the dataset and see which variables are available
Make sure you always do this in this order
Data Exploration & Feature Engineering
• Import data set
• Variable identification
• Univariate, Bivariate and Multivariate analysis
• Identify and Treat missing and outlier values
• Create new variables or transform existing variables
Datasets details
Test and Train
Are you a newbie, refer to these guides:
• Import data set (SAS, Python, R)
• Variable identification (Methods, SAS, Python, R)
• Univariate, Bivariate and Multivariate analysis (Methods, SAS, Python, R)
• Identify and Treat missing and outlier values (Missing, Outlier, SAS, Python, R1,
R2)
• Create new variables or transform existing variables (Methods, SAS, Python, R1)
Practice
Explore the data set and share your inferences with the group
Break
Modelling Techniques – Logistic Regression
• Logistic regression is a form of regression analysis in which the outcome variable is binary or
dichotomous
• Used when the focus on whether or not an event occurred, rather than when it occurred
• Here, Instead of modelling the outcome, Y, directly, the method models the log odds(Y) using the
logistic function
• Analysis of variance (ANOVA) and logistic regression all are special cases of General Linear Model
(GLM)
• The probability of success falls between 0 and 1 for all possible values of X
Linear & Logistic Regression
20 30 40 50 60 70
Age
0.0
0.2
0.4
0.6
0.8
1.0
CHDProbability(p)
Predictor (x)
0 20 40 60 80
Age (yrs.)
0
20
40
60
80
100
LengthofStay(days)
Predictor(X)
Y
Y=aX+b
Logit Transformation
Logit is Directly related to Odds
• The logistic model can be written as:
• This implies that the odds for success can be expressed as:
• This relationship is the key to interpreting the coefficients in a logistic regression model !!
Xo
e
P
P 1
1
 


Modelling Techniques – Decision Tree
• Decision tree is a type of supervised learning algorithm
• It works for both categorical and continuous input and output variables
• It is a classification technique that split the population or sample into two or more homogeneous
sets (or sub-populations) based on most significant splitter / differentiator in input variables
Decision Tree - Example
Types of Decision Tree
• Binary Variable Decision Tree: Decision Tree which has binary target variable then it called as
Binary Variable Decision Tree. Example:- In above scenario of student problem, where the target
variable was “Student will play cricket or not” i.e. YES or NO.
• Continuous Variable Decision Tree: Decision Tree has continuous target variable then it is called
as Continuous Variable Decision Tree.
Decision Tree - Terminology
Decision Tree – Advantages/ Disadvantages
Advantages:
• Easy to understand
• Useful in data exploration
• Less Data Cleaning required
• Data type is not a constraint
Disadvantages:
• Overfit
• Not fit for continuous variables
• Not Sensitive to Skewed distributions
Modelling Techniques – Random Forest
• “Random Forest“ is an algorithm to perform very intensive calculations.
• Random forest is like a bootstrapping algorithm with Decision tree (CART) model.
• Random forest gives much more accurate predictions when compared to simple CART/CHAID or
regression models in many scenarios.
• It captures the variance of several input variables at the same time and enables high number of
observations to participate in the prediction.
• A different subset of the training data and subset of variables are selected for each tree
• Remaining training data are used to estimate error and variable importance
Random Forest – Advantages/ Disadvantages
Advantages:
• No need for pruning trees
• Accuracy and variable importance generated automatically
• Not very sensitive to outliers in training data
• Easy to set parameters
Disadvantages:
• Over fitting is not a problem
• It is black box, rules behind model building can not be explained
Modelling Techniques – SVM
35
• It is a classification technique.
• Support Vectors are simply the co-ordinates of individual
observation
• Support Vector Machine is a frontier which best segregates the one
class from other
• Solving SVMs is a quadratic programming problem
• Seen by many as the most successful current text classification
method
Sec. 15.1
Support vectors
Case Study
36
Sec. 15.1
We have a population of 50%-50% Males and
Females. Here, we want to create some set of rules
which will guide us the gender class for rest of the
population.
The blue circles in the plot represent females and
green squares represents male.
 Males in our population have a higher average
height.
 Females in our population have longer scalp
hairs.
Case Study – How to find right SVM
37
Sec. 15.1
Here we have three possible frontiers. Decide which
one is best.
Methods:
• Find the minimum distance of the frontier from
closest support vector (this can belong to any
class).
• Choose the frontier with the maximum distance
from the closest support vector. In this case, it is
black frontier with 15 unit distance.
Predict Robots out of all the bidders
Perform prediction for robot prediction
Python Resources:
Python:
• http://www.bigdataexaminer.com/dealing-with-unbalanced-classes-svm-random-forests-and-
decision-trees-in-python/
• http://nbviewer.ipython.org/github/justmarkham/gadsdc1/blob/master/logistic_assignment/kevi
n_logistic_sklearn.ipynb
• http://scikit-learn.org/stable/modules/svm.html
• http://scikit-learn.org/stable/modules/tree.html
• http://blog.yhathq.com/posts/random-forests-in-python.html
R Resources:
R:
• http://www.ats.ucla.edu/stat/r/dae/logit.htm
• http://www.cookbook-r.com/Statistical_analysis/Logistic_regression/
• http://www.rdatamining.com/examples/decision-tree
• http://www.statmethods.net/advstats/cart.html
• http://www.cair.org/conferences/cair2013/pres/58_Headstrom.pdf
• http://blog.yhathq.com/posts/comparing-random-forests-in-python-and-r.html
• http://www.louisaslett.com/Courses/Data_Mining/ST4003-Lab7-Introduction_to_Support_Vector_Machines.pdf
• http://thinktostart.com/build-a-spam-filter-with-r/
• http://cbio.ensmp.fr/~jvert/svn/tutorials/practical/svmbasic/svmbasic_notes.pdf
Thanks

Mini datathon - Bengaluru

  • 2.
  • 3.
    Thanks Tlabs &Venturesity for being a lovely host…
  • 5.
    First things first: •Meetup frequency – Once every month • Next meetup – 14th June 2015 • Aim to provide best networking and learning platform in Bangalore • Areas of Interest – Data Science, Big Data, Machine Learning,
  • 6.
    Meet Your Volunteers Kunal DataScience Evangelist, (Growth) Hacker, Blogger, Husband, Father Tavish Blogger, Problem solver, Data scientist
  • 7.
    Agenda • Introduction • Modelbuilding – life cycle • Data Exploration and Feature Engineering methods • Talk about modelling Techniques like • Logistic Regression • Decision Tree • Random Forest • SVM • Predict Man vs. Machine
  • 8.
    Introduction • Name • Experiencein Data Science • Current Company • Are you proficient with (SAS/ R/ Python)?
  • 9.
    Team creation • Lookfor diversity in experience • Hopefully common toolset, but complementary can also work • Competing against each other
  • 10.
  • 11.
    A few groundrules for today • This is not a tutorial – you are expected to solve this problem yourself • We are here to help you, organize your thoughts and to make sure you are going in the right direction. • Good question to ask: • While trying Logistic regression in R, I am facing following error? • Bad question to ask: • Help me understand what is Logistic Regression!
  • 13.
    • Register onDataHack.io & discuss.analyticsvidhya.com • Datahack.io – Website for hackathon memberships • Discuss.analyticsvidhya.com – Discussions for the day & always • One login for each participant • Password would be mailed upon registration • Registration on Kaggle.com
  • 14.
  • 15.
    Problem of theday : FB challenge – Human or Robot
  • 16.
  • 17.
    Datasets you willhave access to Training Testing Bids Submission Unique at Bid ID Unique at Bidder ID Unique at Bidder ID
  • 18.
    Hypothesis generation • Inyour groups, list down all possible variables, which might influence the chances of survival of a passenger • Download the dataset from Kaggle • Next, look at the dataset and see which variables are available Make sure you always do this in this order
  • 19.
    Data Exploration &Feature Engineering • Import data set • Variable identification • Univariate, Bivariate and Multivariate analysis • Identify and Treat missing and outlier values • Create new variables or transform existing variables
  • 20.
  • 21.
    Are you anewbie, refer to these guides: • Import data set (SAS, Python, R) • Variable identification (Methods, SAS, Python, R) • Univariate, Bivariate and Multivariate analysis (Methods, SAS, Python, R) • Identify and Treat missing and outlier values (Missing, Outlier, SAS, Python, R1, R2) • Create new variables or transform existing variables (Methods, SAS, Python, R1)
  • 22.
    Practice Explore the dataset and share your inferences with the group
  • 23.
  • 24.
    Modelling Techniques –Logistic Regression • Logistic regression is a form of regression analysis in which the outcome variable is binary or dichotomous • Used when the focus on whether or not an event occurred, rather than when it occurred • Here, Instead of modelling the outcome, Y, directly, the method models the log odds(Y) using the logistic function • Analysis of variance (ANOVA) and logistic regression all are special cases of General Linear Model (GLM) • The probability of success falls between 0 and 1 for all possible values of X
  • 25.
    Linear & LogisticRegression 20 30 40 50 60 70 Age 0.0 0.2 0.4 0.6 0.8 1.0 CHDProbability(p) Predictor (x) 0 20 40 60 80 Age (yrs.) 0 20 40 60 80 100 LengthofStay(days) Predictor(X) Y Y=aX+b
  • 26.
  • 27.
    Logit is Directlyrelated to Odds • The logistic model can be written as: • This implies that the odds for success can be expressed as: • This relationship is the key to interpreting the coefficients in a logistic regression model !! Xo e P P 1 1    
  • 28.
    Modelling Techniques –Decision Tree • Decision tree is a type of supervised learning algorithm • It works for both categorical and continuous input and output variables • It is a classification technique that split the population or sample into two or more homogeneous sets (or sub-populations) based on most significant splitter / differentiator in input variables
  • 29.
  • 30.
    Types of DecisionTree • Binary Variable Decision Tree: Decision Tree which has binary target variable then it called as Binary Variable Decision Tree. Example:- In above scenario of student problem, where the target variable was “Student will play cricket or not” i.e. YES or NO. • Continuous Variable Decision Tree: Decision Tree has continuous target variable then it is called as Continuous Variable Decision Tree.
  • 31.
    Decision Tree -Terminology
  • 32.
    Decision Tree –Advantages/ Disadvantages Advantages: • Easy to understand • Useful in data exploration • Less Data Cleaning required • Data type is not a constraint Disadvantages: • Overfit • Not fit for continuous variables • Not Sensitive to Skewed distributions
  • 33.
    Modelling Techniques –Random Forest • “Random Forest“ is an algorithm to perform very intensive calculations. • Random forest is like a bootstrapping algorithm with Decision tree (CART) model. • Random forest gives much more accurate predictions when compared to simple CART/CHAID or regression models in many scenarios. • It captures the variance of several input variables at the same time and enables high number of observations to participate in the prediction. • A different subset of the training data and subset of variables are selected for each tree • Remaining training data are used to estimate error and variable importance
  • 34.
    Random Forest –Advantages/ Disadvantages Advantages: • No need for pruning trees • Accuracy and variable importance generated automatically • Not very sensitive to outliers in training data • Easy to set parameters Disadvantages: • Over fitting is not a problem • It is black box, rules behind model building can not be explained
  • 35.
    Modelling Techniques –SVM 35 • It is a classification technique. • Support Vectors are simply the co-ordinates of individual observation • Support Vector Machine is a frontier which best segregates the one class from other • Solving SVMs is a quadratic programming problem • Seen by many as the most successful current text classification method Sec. 15.1 Support vectors
  • 36.
    Case Study 36 Sec. 15.1 Wehave a population of 50%-50% Males and Females. Here, we want to create some set of rules which will guide us the gender class for rest of the population. The blue circles in the plot represent females and green squares represents male.  Males in our population have a higher average height.  Females in our population have longer scalp hairs.
  • 37.
    Case Study –How to find right SVM 37 Sec. 15.1 Here we have three possible frontiers. Decide which one is best. Methods: • Find the minimum distance of the frontier from closest support vector (this can belong to any class). • Choose the frontier with the maximum distance from the closest support vector. In this case, it is black frontier with 15 unit distance.
  • 38.
    Predict Robots outof all the bidders Perform prediction for robot prediction
  • 39.
    Python Resources: Python: • http://www.bigdataexaminer.com/dealing-with-unbalanced-classes-svm-random-forests-and- decision-trees-in-python/ •http://nbviewer.ipython.org/github/justmarkham/gadsdc1/blob/master/logistic_assignment/kevi n_logistic_sklearn.ipynb • http://scikit-learn.org/stable/modules/svm.html • http://scikit-learn.org/stable/modules/tree.html • http://blog.yhathq.com/posts/random-forests-in-python.html
  • 40.
    R Resources: R: • http://www.ats.ucla.edu/stat/r/dae/logit.htm •http://www.cookbook-r.com/Statistical_analysis/Logistic_regression/ • http://www.rdatamining.com/examples/decision-tree • http://www.statmethods.net/advstats/cart.html • http://www.cair.org/conferences/cair2013/pres/58_Headstrom.pdf • http://blog.yhathq.com/posts/comparing-random-forests-in-python-and-r.html • http://www.louisaslett.com/Courses/Data_Mining/ST4003-Lab7-Introduction_to_Support_Vector_Machines.pdf • http://thinktostart.com/build-a-spam-filter-with-r/ • http://cbio.ensmp.fr/~jvert/svn/tutorials/practical/svmbasic/svmbasic_notes.pdf
  • 41.