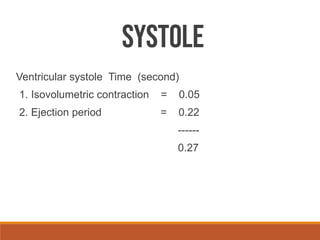
The document discusses the cardiac cycle, defined as a sequence of events during a heartbeat, consisting of systole (contraction) and diastole (relaxation). It outlines the subdivisions and durations of these phases, detailing the mechanical and electrical events involved, as well as the corresponding heart sounds. Overall, it emphasizes the importance of understanding the cardiac cycle for insights into heart function and blood flow.


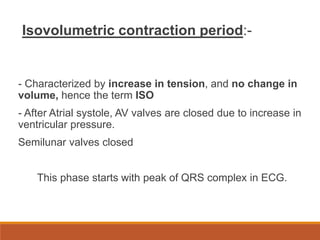


![MechanicalEventsof
CardiacCycle
1. Ventricular Filling Period [ventricular diastole, atrial systole]
2. Isovolumetric Contraction Period [ventricular systole]
3. Ventricular Ejection Period [ventricular systole]
4. Isovolumetric Relaxation Period [ventricular diastole]](https://image.slidesharecdn.com/cardiaccycle-220709064957-08747636/85/Cardiac-Cycle-pdf-32-320.jpg)


