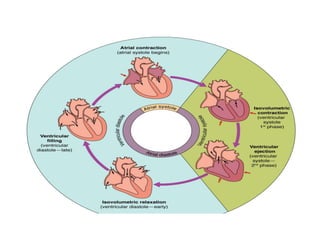
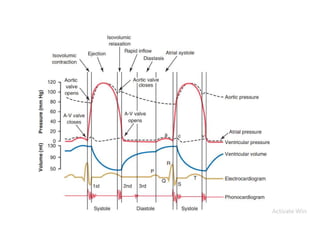
Dr. Tania A. Shakoori (MBBS, PhD)
• Relate ECG with phases of cardiac cycle
• Relate pressure changes in the atria (JVP) with phases of cardiac cycle
• Relate pressure changes in the ventricles with phases of cardiac cycle
• Relate volume changes in the ventricles with phases of cardiac cycle
• Relate heart sounds with cardiac cycle
Phases of cardiac cycle
• The cardiac events that occur from the beginning of one heartbeat to
the beginning of the next are called the cardiac cycle
1. P wave---- atrial depolarization.
(does not include atrial repolarization, which is
“buried” in the QRS complex.)
2. PR interval--- from the beginning of the P wave to
the beginning of the Q wave (initial depolarization of
the ventricle).
3. QRS complex---- depolarization of the ventricles.
4. QT interval ----is the interval from the beginning of
the Q wave to the end of the T
wave. represents the entire period of depolarization
and repolarization of the ventricles.
5. ST segment---from the end of the wave to the
beginning of the T wave. isoelectric.
represents the period when the ventricles are
depolarized.
6. T wave---ventricular repolarization
A. Atrial systole
• is preceded by the P wave, which represents electrical activation of the atria.
• contributes to, but is not essential for, ventricular filling.
• The increase in atrial pressure (venous pressure) caused by atrial systole is the a wave on the venous
pulse curve.
• In ventricular hypertrophy, filling of the ventricle by atrial systole causes the fourth heart sound, which is
not audible in normal adults.
B. Isovolumetric ventricular contraction
• begins during the QRS complex, which represents electrical activation of the ventricles.
• When ventricular pressure becomes greater than atrial pressure, the AV valves close.
• Their closure corresponds to the first heart sound. (Because the mitral valve closes before the tricuspid
valve, the first heart sound may be split.)
• Ventricular pressure increases isovolumetrically as a result of ventricular contraction.
• However, no blood leaves the ventricle during this phase because the aortic valve is closed. Ventricular
volume is constant (isovolumetric) because all valves are closed.
• C. Rapid ventricular ejection
Ventricular pressure reaches its maximum value during this phase.
• C wave on venous pulse curve occurs because of bulging of
tricuspid value into right atrium during right ventricular contraction.
• When ventricular pressure becomes greater than aortic pressure, the
aortic valve opens.
• Rapid ejection of blood into the aorta occurs because of the pressure
gradient between the ventricle and the aorta.
• Ventricular volume decreases dramatically because most of the
stroke volume is ejected during this phase.
• Atrial filling begins.
• The onset of the T wave, which represents repolarization of the
ventricles, marks the end of both ventricular contraction and rapid
ventricular ejection.
D. Reduced ventricular ejection
• Ejection of blood from the ventricle continues but is slower.
Ventricular pressure begins to decrease.
Aortic pressure also decreases because of the runoff of blood
from
large arteries into smaller arteries.
Atrial filling continues.
V wave on venous pulse curve represents blood flow into right
atrium
(rising phase of wave) and from right atrium into right ventricle
(falling phase of wave).
E. Isovolumetric ventricular relaxation
• Repolarization of the ventricles is now complete (end of the T wave).
• The aortic valve closes, followed by closure of the pulmonic valve.
• Closure of the semilunar valves corresponds to the second heart
sound. Inspiration delays closure of the pulmonic valve and thus
causes splitting of the second heart sound.The AV valves remain closed
during most of this phase.
• Ventricular pressure decreases rapidly because the ventricle is now
relaxed.
• Ventricular volume is constant (isovolumetric) because all of the
valves are closed.
• The “blip” in the aortic pressure tracing occurs after closure of the
aortic valve and is called the dicrotic notch, or incisura.
F. Rapid ventricular filling
• When ventricular pressure becomes less than atrial pressure, the
mitral valve opens.
• With the mitral valve open, ventricular filling from the atrium begins.
• Aortic pressure continues to decrease because blood continues to
run off into the smaller arteries.
• Rapid flow of blood from the atria into the ventricles causes the third
heart sound, which is normal in children but, in adults, is associated
with disease.
G. Reduced ventricular filling (diastasis)
• is the longest phase of the cardiac cycle.
• Ventricular filling continues, but at a slower rate.
• The time required for diastasis and ventricular filling depends on heart
rate. For example, increases in heart rate cause decreased time available
for ventricular refilling, decreased end-diastolic volume, and decreased
stroke volume
End-Diastolic Volume, End-Systolic Volume, and
Stroke Volume Output
• enddiastolic volume----110 to 120 milliliters.
• stroke volume output---70 milliliters
• endsystolic volume----40 to 50 milliliters.
• The fraction of the end-diastolic
that is ejected is called the ejection fraction volume — usually equal
to about 0.6 (or 60 percent).
Summary?
• Relate ECG with phases of cardiac cycle
• Relate pressure changes in the atria (JVP) with phases of cardiac cycle
• Relate pressure changes in the ventricles with phases of cardiac cycle
• Relate volume changes in the ventricles with phases of cardiac cycle
• Relate heart sounds with cardiac cycle
Cardiac cycle TAS UoL

Cardiac cycle TAS UoL

  • 1.
    Dr. Tania A.Shakoori (MBBS, PhD)
  • 2.
    • Relate ECGwith phases of cardiac cycle • Relate pressure changes in the atria (JVP) with phases of cardiac cycle • Relate pressure changes in the ventricles with phases of cardiac cycle • Relate volume changes in the ventricles with phases of cardiac cycle • Relate heart sounds with cardiac cycle
  • 3.
    Phases of cardiaccycle • The cardiac events that occur from the beginning of one heartbeat to the beginning of the next are called the cardiac cycle
  • 6.
    1. P wave----atrial depolarization. (does not include atrial repolarization, which is “buried” in the QRS complex.) 2. PR interval--- from the beginning of the P wave to the beginning of the Q wave (initial depolarization of the ventricle). 3. QRS complex---- depolarization of the ventricles. 4. QT interval ----is the interval from the beginning of the Q wave to the end of the T wave. represents the entire period of depolarization and repolarization of the ventricles. 5. ST segment---from the end of the wave to the beginning of the T wave. isoelectric. represents the period when the ventricles are depolarized. 6. T wave---ventricular repolarization
  • 7.
    A. Atrial systole •is preceded by the P wave, which represents electrical activation of the atria. • contributes to, but is not essential for, ventricular filling. • The increase in atrial pressure (venous pressure) caused by atrial systole is the a wave on the venous pulse curve. • In ventricular hypertrophy, filling of the ventricle by atrial systole causes the fourth heart sound, which is not audible in normal adults. B. Isovolumetric ventricular contraction • begins during the QRS complex, which represents electrical activation of the ventricles. • When ventricular pressure becomes greater than atrial pressure, the AV valves close. • Their closure corresponds to the first heart sound. (Because the mitral valve closes before the tricuspid valve, the first heart sound may be split.) • Ventricular pressure increases isovolumetrically as a result of ventricular contraction. • However, no blood leaves the ventricle during this phase because the aortic valve is closed. Ventricular volume is constant (isovolumetric) because all valves are closed.
  • 8.
    • C. Rapidventricular ejection Ventricular pressure reaches its maximum value during this phase. • C wave on venous pulse curve occurs because of bulging of tricuspid value into right atrium during right ventricular contraction. • When ventricular pressure becomes greater than aortic pressure, the aortic valve opens. • Rapid ejection of blood into the aorta occurs because of the pressure gradient between the ventricle and the aorta. • Ventricular volume decreases dramatically because most of the stroke volume is ejected during this phase. • Atrial filling begins. • The onset of the T wave, which represents repolarization of the ventricles, marks the end of both ventricular contraction and rapid ventricular ejection.
  • 9.
    D. Reduced ventricularejection • Ejection of blood from the ventricle continues but is slower. Ventricular pressure begins to decrease. Aortic pressure also decreases because of the runoff of blood from large arteries into smaller arteries. Atrial filling continues. V wave on venous pulse curve represents blood flow into right atrium (rising phase of wave) and from right atrium into right ventricle (falling phase of wave).
  • 10.
    E. Isovolumetric ventricularrelaxation • Repolarization of the ventricles is now complete (end of the T wave). • The aortic valve closes, followed by closure of the pulmonic valve. • Closure of the semilunar valves corresponds to the second heart sound. Inspiration delays closure of the pulmonic valve and thus causes splitting of the second heart sound.The AV valves remain closed during most of this phase. • Ventricular pressure decreases rapidly because the ventricle is now relaxed. • Ventricular volume is constant (isovolumetric) because all of the valves are closed. • The “blip” in the aortic pressure tracing occurs after closure of the aortic valve and is called the dicrotic notch, or incisura.
  • 11.
    F. Rapid ventricularfilling • When ventricular pressure becomes less than atrial pressure, the mitral valve opens. • With the mitral valve open, ventricular filling from the atrium begins. • Aortic pressure continues to decrease because blood continues to run off into the smaller arteries. • Rapid flow of blood from the atria into the ventricles causes the third heart sound, which is normal in children but, in adults, is associated with disease. G. Reduced ventricular filling (diastasis) • is the longest phase of the cardiac cycle. • Ventricular filling continues, but at a slower rate. • The time required for diastasis and ventricular filling depends on heart rate. For example, increases in heart rate cause decreased time available for ventricular refilling, decreased end-diastolic volume, and decreased stroke volume
  • 12.
    End-Diastolic Volume, End-SystolicVolume, and Stroke Volume Output • enddiastolic volume----110 to 120 milliliters. • stroke volume output---70 milliliters • endsystolic volume----40 to 50 milliliters. • The fraction of the end-diastolic that is ejected is called the ejection fraction volume — usually equal to about 0.6 (or 60 percent).
  • 13.
    Summary? • Relate ECGwith phases of cardiac cycle • Relate pressure changes in the atria (JVP) with phases of cardiac cycle • Relate pressure changes in the ventricles with phases of cardiac cycle • Relate volume changes in the ventricles with phases of cardiac cycle • Relate heart sounds with cardiac cycle