Download to read offline


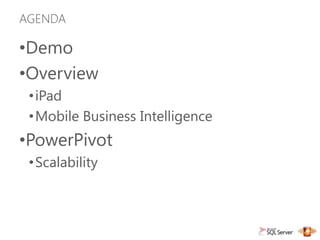
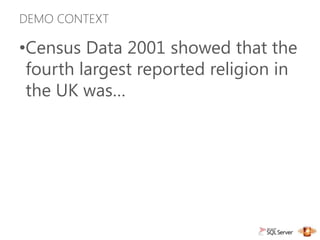

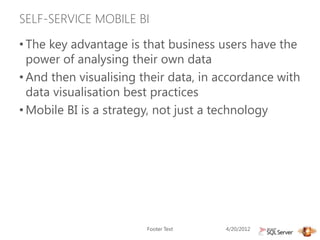


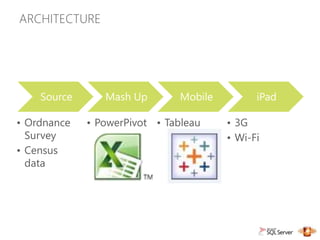


This document summarizes a presentation about mobile business intelligence. It discusses how mobile BI allows business users to analyze and visualize their own data on mobile devices like the iPad. It provides overviews of PowerPivot and Tableau for data modeling and visualization, and tips for effective mobile BI visualizations, including using filters, drill downs, tooltips, and avoiding issues with maps, zooming, and moire effects on screens. The document contains demos of analyzing UK census data on religious groups with mobile BI tools.