Sql server 2012 Mobile business intelligence
•Download as PPTX, PDF•
0 likes•729 views

This document summarizes a presentation on mobile business intelligence. It includes an agenda that covers an overview of using iPads for mobile BI and PowerPivot for scalability. It discusses how mobile BI allows business users to analyze and visualize their own data. It also outlines some best practices for mobile BI visualization, such as setting user expectations, balancing different graph types, using filters and drill downs, and avoiding issues with maps, zooming, and moire effects on some devices.

More Related Content
What's hot
What's hot (20)
Similar to Sql server 2012 Mobile business intelligence
Similar to Sql server 2012 Mobile business intelligence (20)
More from Jen Stirrup
More from Jen Stirrup (20)
Recently uploaded
Recently uploaded (20)
Sql server 2012 Mobile business intelligence
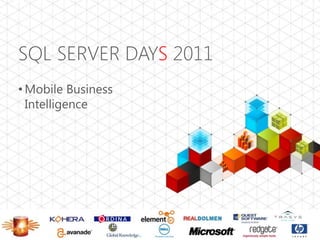
- 1. SQL SERVER DAYS 2011 • Mobile Business Intelligence
- 3. AGENDA • Demo • Overview • iPad • Mobile Business Intelligence • PowerPivot • Scalability
- 4. DEMO CONTEXT • Census Data 2001 showed that the fourth largest reported religion in the UK was…
- 5. JEDI
- 6. SELF-SERVICE MOBILE BI • The key advantage is that business users have the power of analysing their own data • And then visualising their data, in accordance with data visualisation best practices • Mobile BI is a strategy, not just a technology Footer Text 4/20/2012 6
- 8. IPAD
- 9. WHY MOBILE BUSINESS INTELLIGENCE? • Vendors have shifted in favor of Apple’s iPad tablet computer making it the single top priority for Mobile BI application development. (Dresner, 2011, Mobile Business Intelligence Market Study)
- 10. ARCHITECTURE Source Mash Up Mobile iPad • Ordnance • PowerPivot • Tableau • 3G Survey • Wi-Fi • Census data
- 11. WHAT IS POWERPIVOT? • Subversive • Two types: •Free Excel add-in •Sharepoint presentation layer • Strength: Vertipaq column-oriented data store • Scaleability
- 12. POWERPIVOT MASH UP DATA SOURCES Text
- 13. WHAT IS TABLEAU?
- 14. HOW NOT TO DO MOBILE BI Profit % by Category 1% 11% 1% 22% AUDIO CAMERAS & CAMCORDERS CELL PHONES COMPUTERS 7% GAMES & TOYS 31% HOME APPLIANCES MUSIC, MOVIES & AUDIO BOOKS TV & VIDEO 1% 26% Footer Text 4/20/2012 1
- 15. TIPS FOR MOBILE BI VISUALISATION • Set User Expectations • Balance in combining graphs • Filters • Drill downs • Tooltips
- 16. TIPS FOR MOBILE BI VISUALISATION • Maps can take time to load • Zooming can be problematic e.g. Blackberry Bold • Moire Illusion
- 17. ILLUSORY EFFECTS
- 18. ILLUSORY EFFECTS
- 19. THANK YOU!
Editor's Notes
- Sample data contains two decimal places, which unnecessarily adds in additional data.The original data shows Brighton, Cambridge and Oxford as having the highest percentage of Jedi.The link is here: http://www.statistics.gov.uk/census2001/profiles/rank/jedi.asp
- 3 out of 5 workers say they don’t need to be in the office to be productive (Cisco)The Perception of work is changingUsers using web-based email less (-6%) and mobile email more (+36%)So what is mobile BI? Speaking broadly, mobile BI provides end users with the capability to access data and make informed decisions on the go. Being away from laptops or offices should no longer restrict executives’ ability to access critical data, and they should not have to rely on months or weeks-old numbers embedded in emails or presentation reports.Mobile BI is about providing BI on any technology not restricted in use at any place and at any time. Platforms for this include smartphones, iPads and tablets. But mobile BI is not just about providing access to data irrespective of place and time. It’s a methodology: a design and strategy to make sure that critical data is available in a real-time and secured manner.Senior management: interested in real-time organizational key performance indicators; ability to access data anytime and anywhere; and make decisions on the go.Sales executives: interested in customer analytics; proactive sales alerts; real-time customer data; and sales performance reporting.Service executives: interested in real-time service alerts and customer data.
- Apple iPad downloads topped 15 billion http://www.apple.com/pr/library/2011/07/07Apples-App-Store-Downloads-Top-15-Billion.htmlSince April 2010, Apple have sold 30 million iPads, $9.5 billion revenueEasier for people to justify an iPad when they already own iPod or iPhoneOther vendors playing ‘catch up’ – Apple already crafting next generationWhy the iPad? It is easy to adopt, minimal training, and many employees have an iPad at home.Why are Apple so dominant? Planned for the future. Apple Retail stores are an ‘experience’ as well as a function. Compare the Apple shopping experience with looking at a device on a tether in CarPhone Warehouse or similar. The benefit of allowing people to interact with the device, with friendly Apple fanboys at their side, is very appealing.Rest of the tablet market generated $34 million revenue.iPod or iPhone – 220 million iOS devices worldwidePeople who are wary of downloading software will download Apple apps since the store is regarded as fairly ‘safe’ and outside the remit of normal downloads. This is largely due to Apple’s checking process.
- 3 out of 5 workers say they don’t need to be in the office to be productive (Cisco)The Perception of work is changingUsers using web-based email less (-6%) and mobile email more (+36%)Why are Apple so dominant? Planned for the future. Apple Retail stores are an ‘experience’ as well as a function. Compare the Apple shopping experience with looking at a device on a tether in CarPhone Warehouse or similar. The benefit of allowing people to interact with the device, with friendly Apple fanboys at their side, is very appealing.Rest of the tablet market generated $34 million revenue.iPod or iPhone – 220 million iOS devices worldwidePeople who are wary of downloading software will download Apple apps since the store is regarded as fairly ‘safe’ and outside the remit of normal downloads. This is largely due to Apple’s checking process.
- Work is a thing people do, not a place people go2011 – Primary mobile BI device is the iPad, then the Blackberry; previously, iPhone was dominant in 2010. 2011 – Market is rapidly changing with new platforms (Android), BI evolution in technical offerings, and a higher number of deployments
- Support for slicers Takes data from ATOM feedsTakes from OLEDB Source as standard/* Potential issue for desktop version since PowerPivot takes from OLEDB */Highly scaleable
- Microsoft SQL ServerMicrosoft SQL AzureMicrosoft SQL Server Parallel Data WarehouseMicrosoft AccessOracleTeradataSybaseInformixIBM DB2Microsoft Analysis ServicesMicrosoft Reporting ServicesData Feeds (WCF Data Services formerly ADO.Net Data Services)Excel workbookText file
- Tableau’s strengths:Visualisation, visualisation, visualisation! ease-of-use for business usersLeveraging the power of DAX to build complex calculationsIn itself, low reliance on IT
- How can we make this look better in Tableau (quite easily!)The sample visualisation is supposed to show off what PowerPivot can do; however, it fails because it breaks best practices in datavisualisation, which come naturally in Tableau.
- Moire illusion(yes, tables are a type of visualization).
- Moire illusion(yes, tables are a type of visualization).