


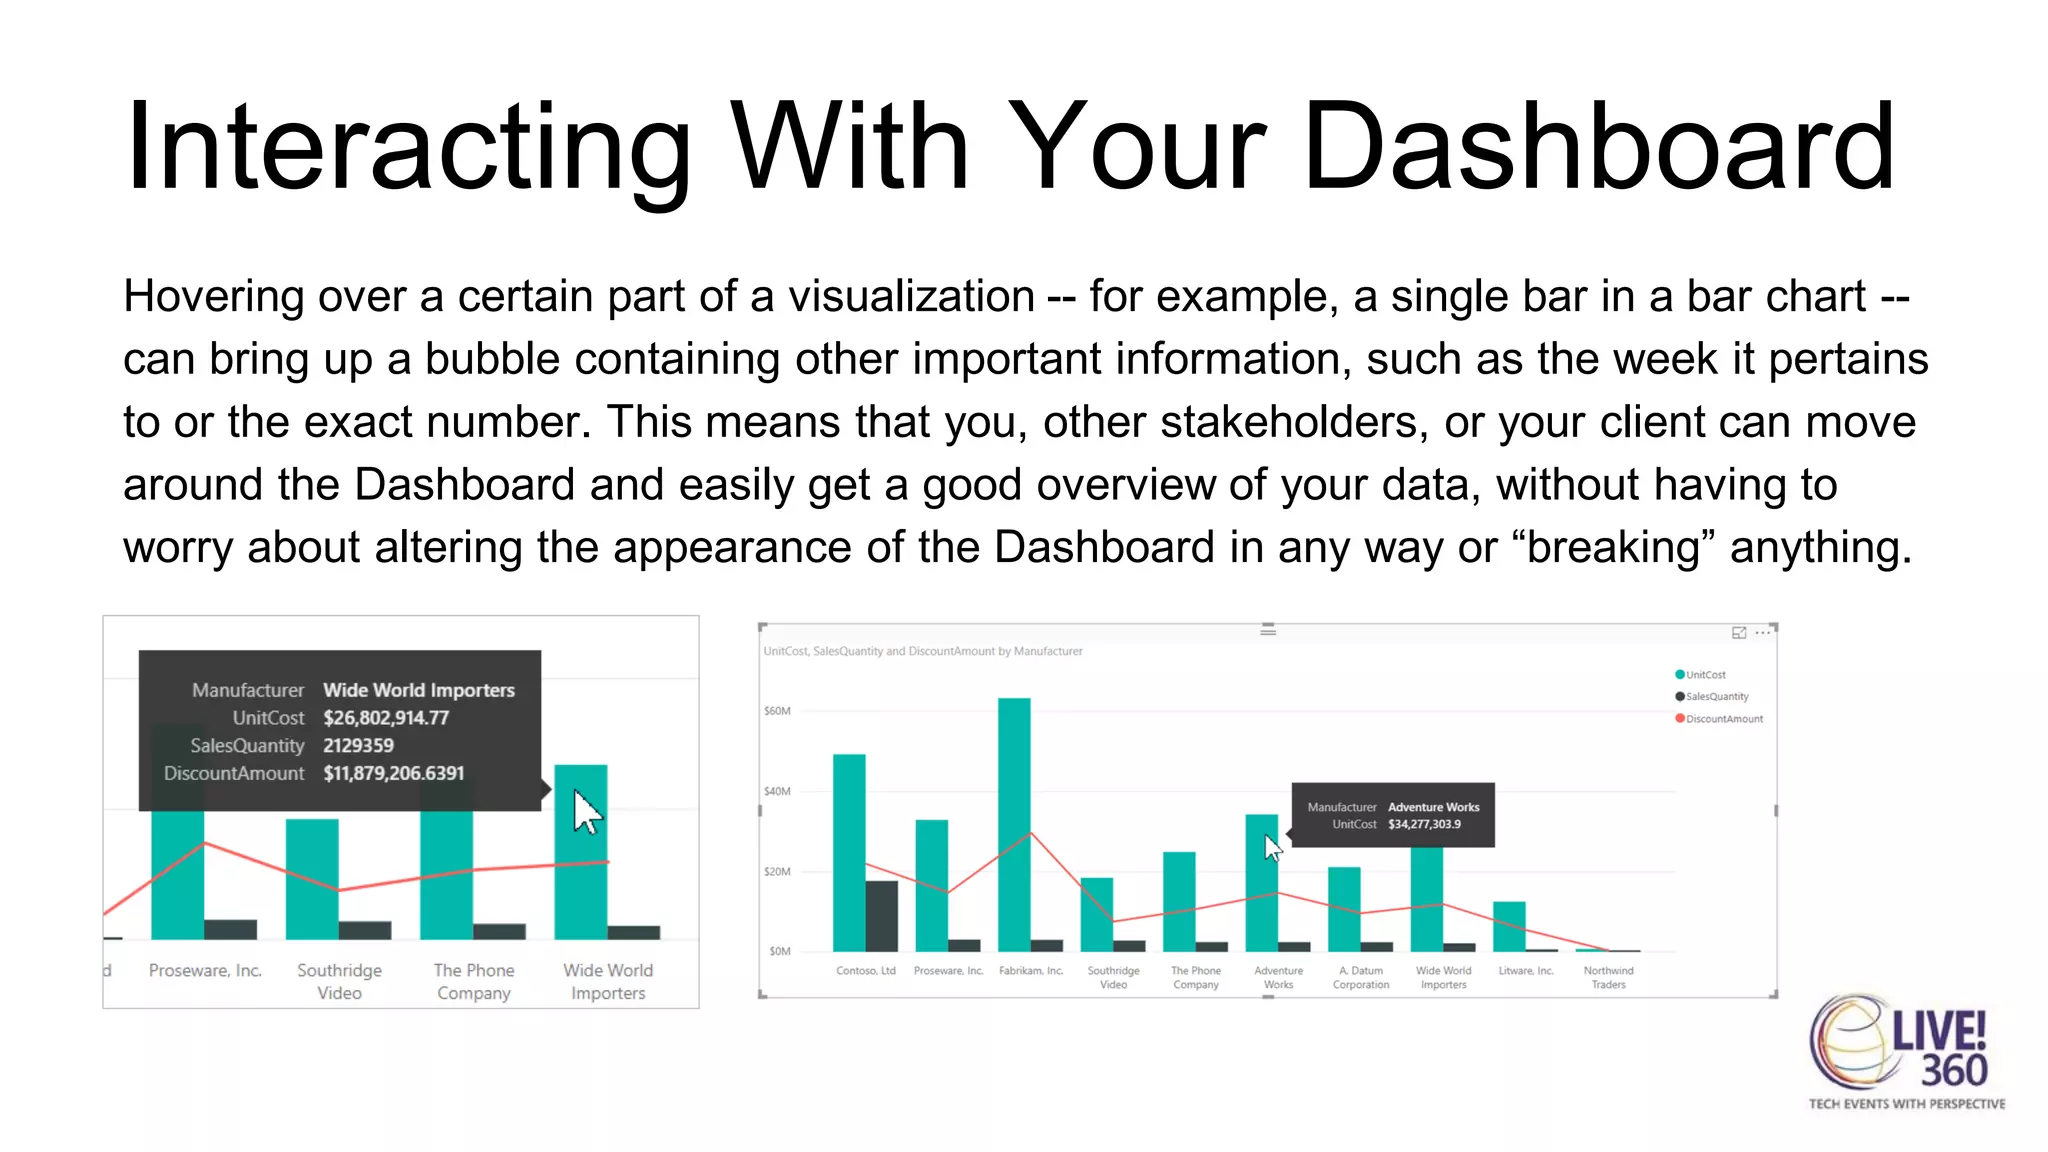


This document provides guidance on creating an effective digital marketing analytics dashboard using Power BI. It recommends connecting to Google Analytics as a primary data source and including visualizations of key performance indicators (KPIs) like impressions, clicks, and spending over time. The dashboard should allow users to interact with the data by selecting specific time periods to analyze and compare metrics. Color coding and tooltips can also help users understand relationships in the data and drill down into further details.