Download to read offline


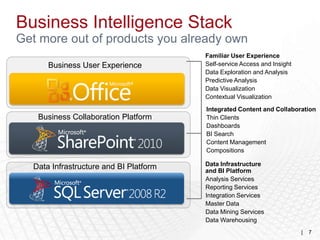
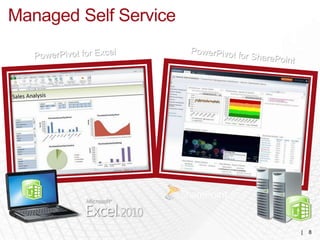
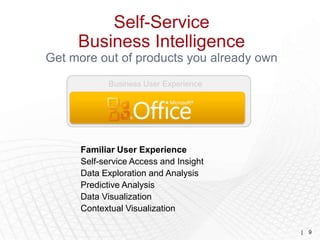


The document discusses Microsoft's self-service business intelligence solution. It notes that business owners want reporting and data-driven insights but often have lots of data and no usable information. The solution provides access to multiple data sources, brings the data together for analysis, and provides insights leading to action. It provides examples of how the solution could help a professional services firm, franchise company, and Contoso improve reporting. The solution includes tools for personal analysis, self-service reporting, rich visualizations, and SQL Server Power Pivot for Excel. It outlines topics that would be covered in a demonstration of building a solution for Contoso.