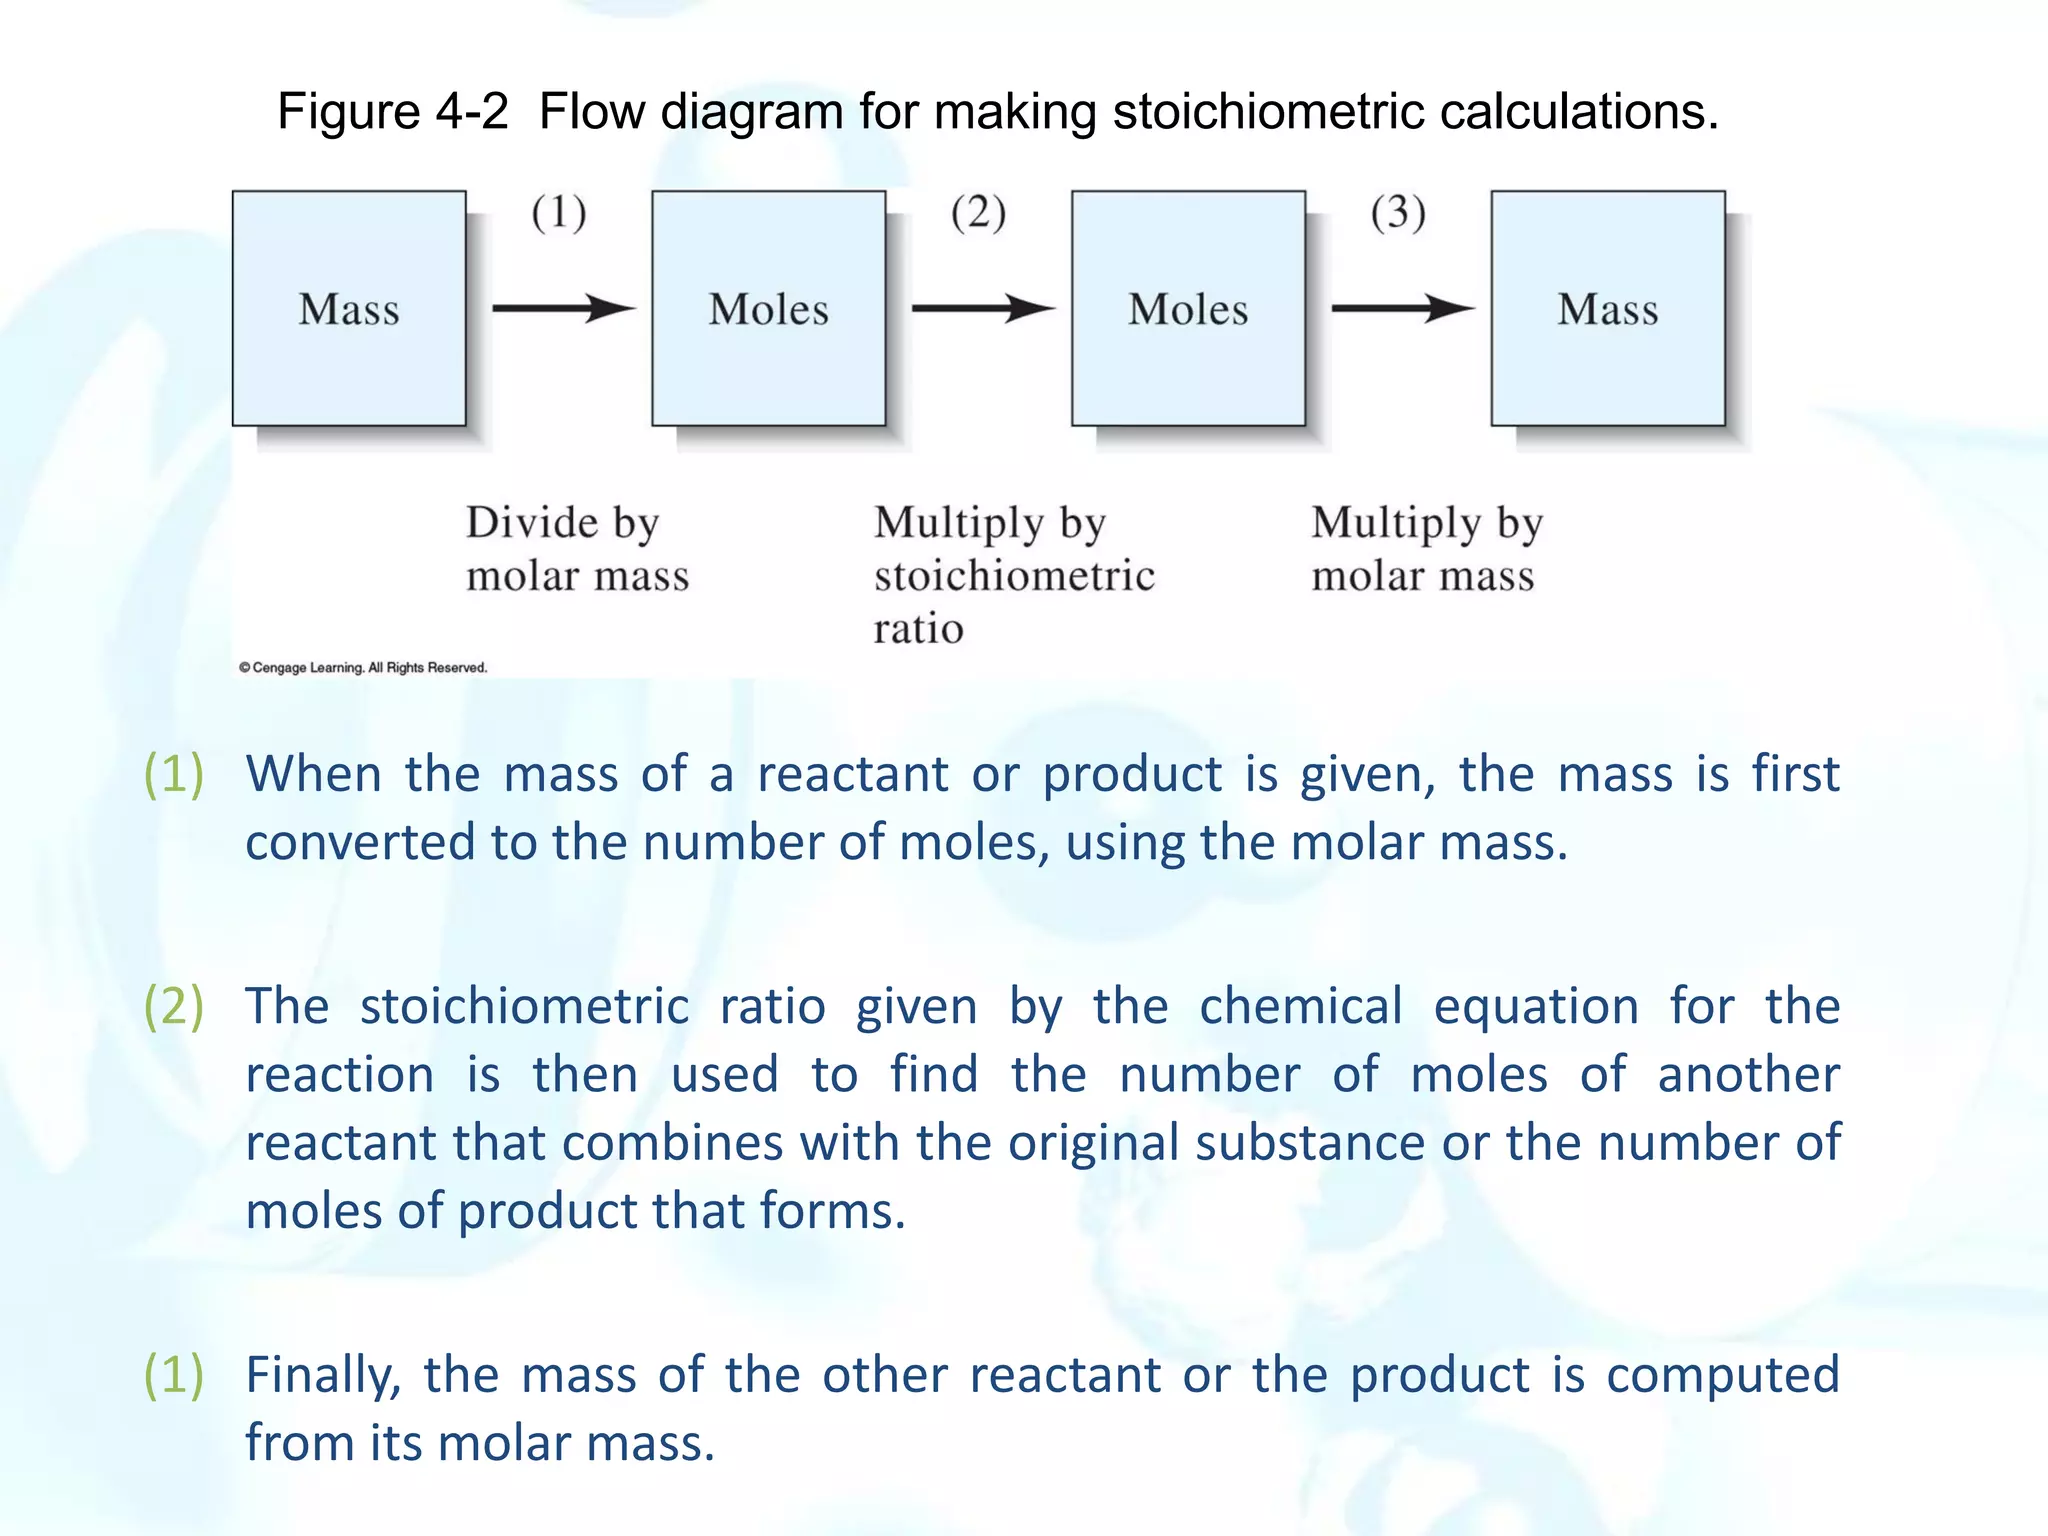
This chapter describes analytical chemistry calculations including units of measurement, the mole concept, and solution concentrations. It discusses the distinction between mass and weight, defines the mole as relating to Avogadro's number, and explains methods to express solution concentrations in molar, percent, ppm, and ppb terms. It also covers stoichiometric calculations using mole ratios from balanced chemical equations.
![There are two ways of expressing molar concentration:
Molar analytical concentration is the total number of moles of a solute,
regardless of its chemical state, in 1 L of solution. The molar analytical
concentration describes how a solution of a given concentration can be
prepared.
The molar equilibrium concentration, or just equilibrium concentration,
refers to the molar concentration of a particular species in a solution at
equilibrium.
To specify the molar equilibrium concentration of a species, it is
necessary to know how the solute behaves when it is dissolved in a
solvent.
They are usually symbolized by placing square brackets around the
chemical formula for the species. Ex., [H2SO4] = 0.00 M; [H+] = 1.01 M.](https://image.slidesharecdn.com/calculationsuseinanalyticalchemistry-230202094721-65b5e845/75/Calculations-use-in-Analytical-chemistry-pdf-12-2048.jpg)
![-The IUPAC recommends the general term “concentration” to express the
composition of a solution with respect to its volume, with four sub terms:
amount concentration, mass concentration, volume concentration, and number
concentration.
-- Molar concentration, molar analytical concentration, and molar equilibrium
concentration are all amount concentrations by this definition.
For example, the molar equilibrium concentration of H2SO4 in a solution with a
molar analytical concentration, cH2SO4
= 1 M, is actually 0.0 M, because the
sulfuric acid is completely dissociated into a mixture of H+, HSO4- , SO4-2 ions.
There are essentially no H2SO4 molecules in this solution. The equilibrium
concentrations of the ions are 1.01, 0.99, and 0.01 M, respectively.
because SO4
-2 and HSO4
-2 are the only two sulfate-containing species in the
solution.
The molar equilibrium concentrations are usually symbolized by placing square
brackets around the chemical formula for the species.
Ex., [H2SO4] = 0.00 M;
[H+] = 1.01 M.
[SO4
-2]= 0.01 M and [HSO4
-2]= 0.99 M](https://image.slidesharecdn.com/calculationsuseinanalyticalchemistry-230202094721-65b5e845/75/Calculations-use-in-Analytical-chemistry-pdf-13-2048.jpg)
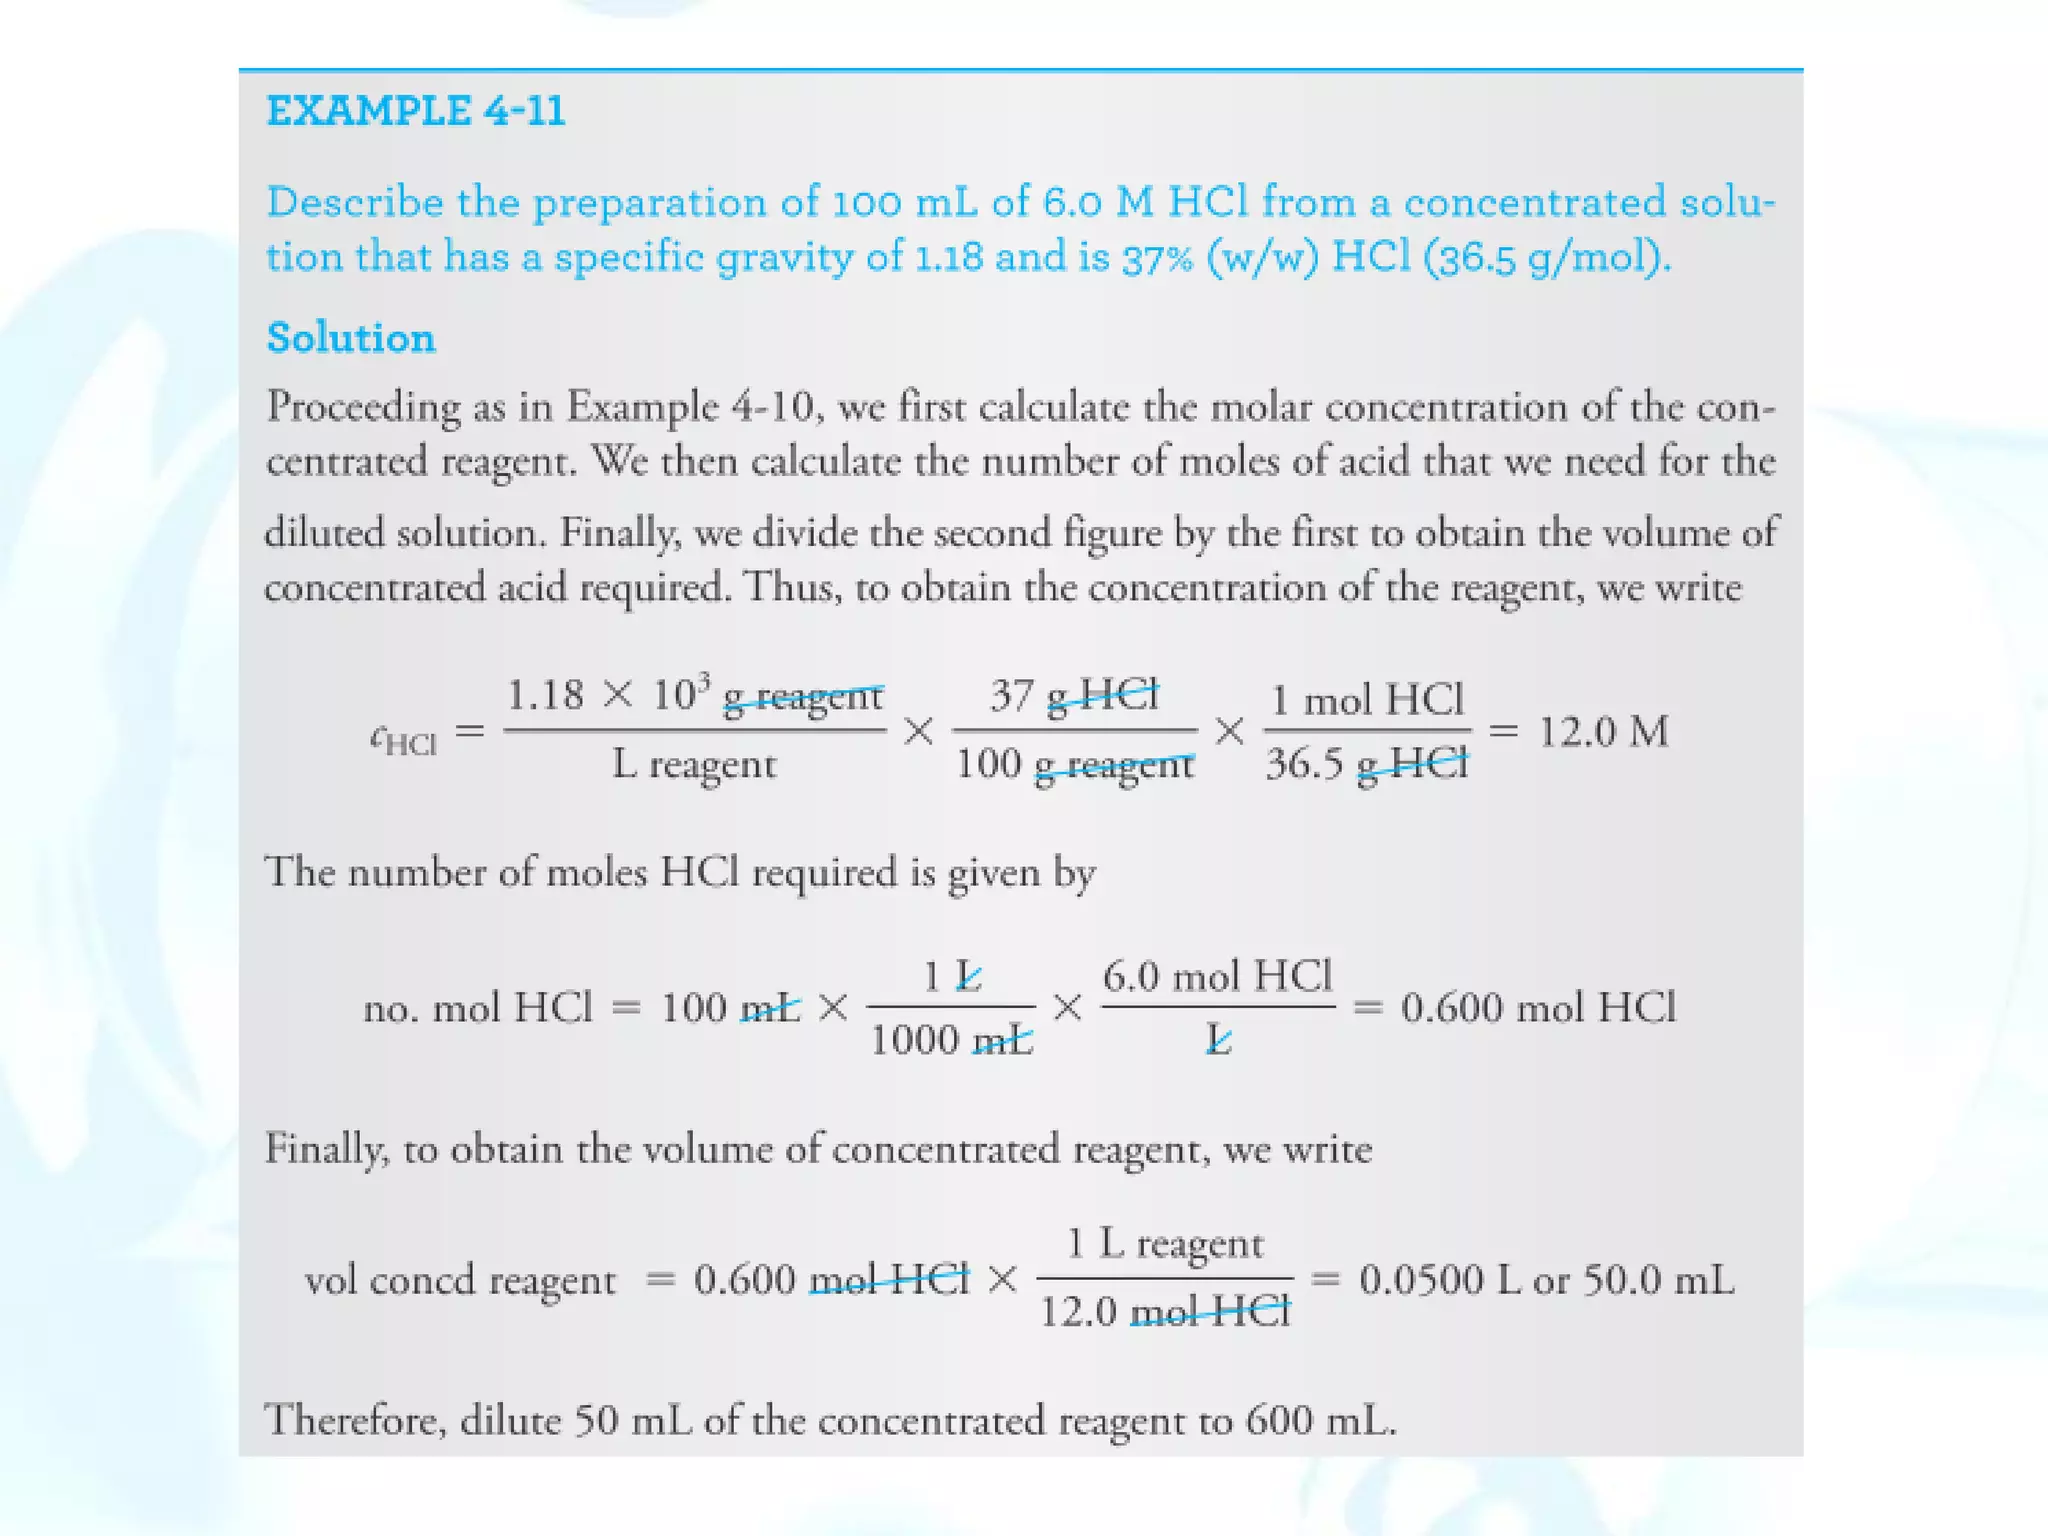
![Solution-Diluent Volume Ratios
The composition of a dilute solution is sometimes specified in terms of the
volume of a more concentrated solution and the volume of solvent used in
diluting it.
Thus, a 1:4 HCl solution contains four volumes of water for each volume of
concentrated hydrochloric acid.
This method of notation is frequently ambiguous.
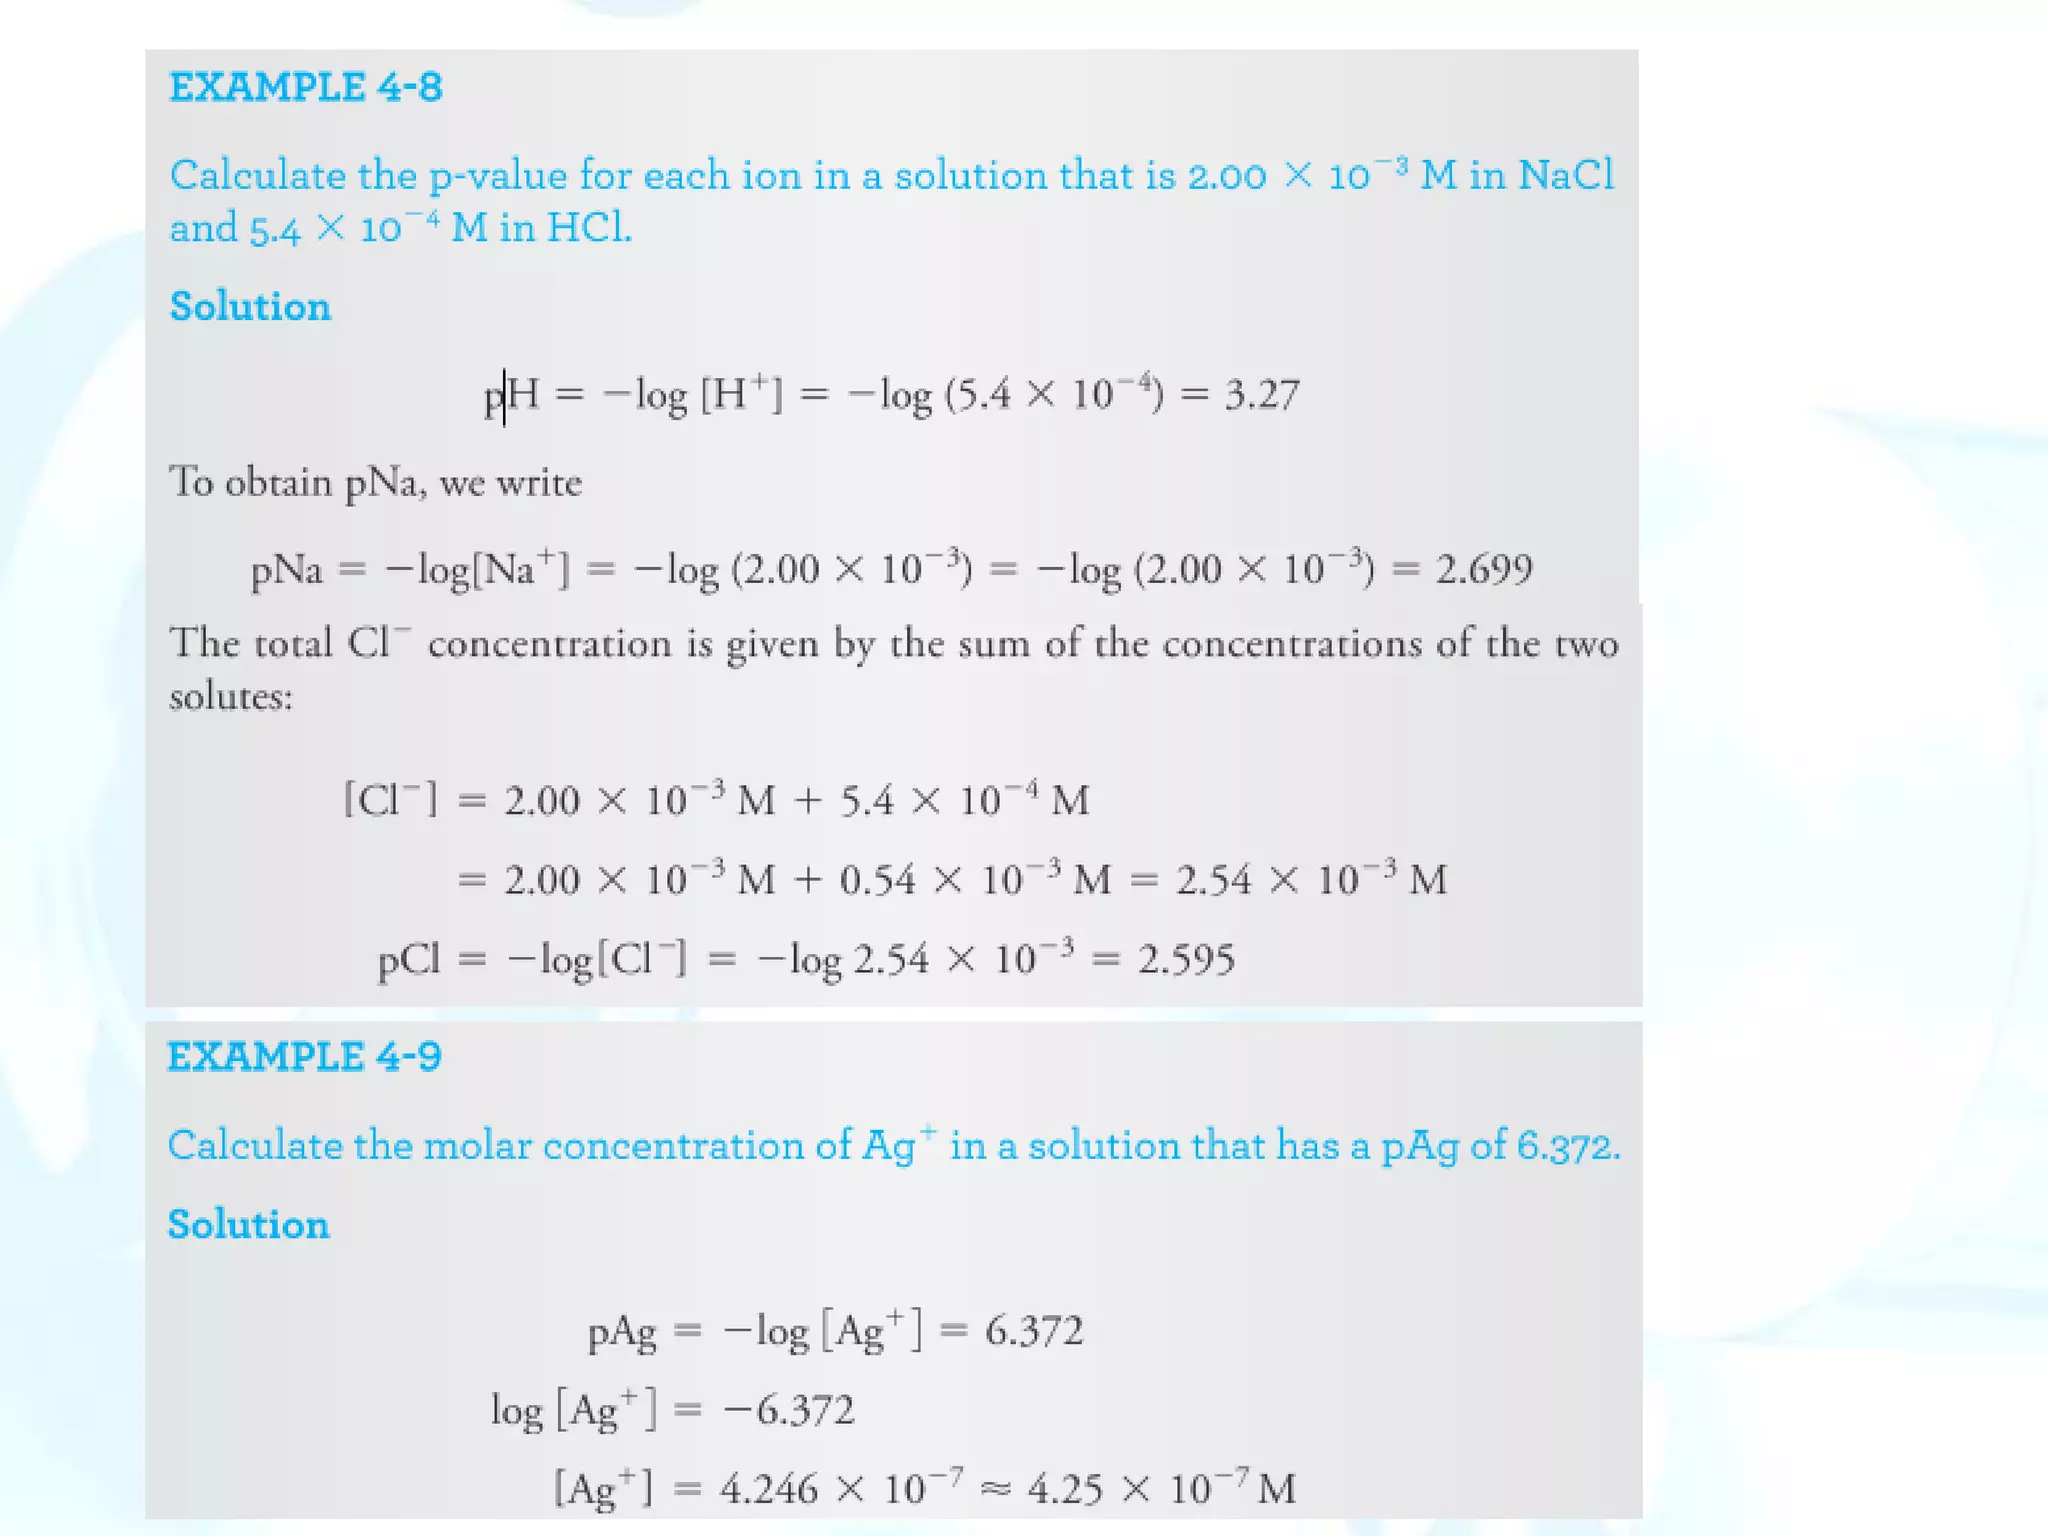
p-Functions
The concentration of a species is expressed as its p-function, or p-value. The
best-known p-function is pH, which is the negative logarithm of [H+].
The p-value is the negative logarithm (to the base 10) of the molar
concentration of that species. Thus, for the species X,
pX = - log [X]](https://image.slidesharecdn.com/calculationsuseinanalyticalchemistry-230202094721-65b5e845/75/Calculations-use-in-Analytical-chemistry-pdf-19-2048.jpg)


![Redox titrations [compatibility mode]](https://cdn.slidesharecdn.com/ss_thumbnails/redoxtitrationscompatibilitymode-130421132405-phpapp02-thumbnail.jpg?width=640&height=640&fit=bounds)