Triangles
Introduction
Sum of the angles of a triangle
Types of triangles
Altitude, Median and Angle Bisector
Congruence of triangles
Sides opposite congruent angles
Lines Parallel to One Side of Triangle Related to Basic Meansinventionjournals
In this work we illustrate the lines which are parallel to one side of triangle related to basic
means using homogenous barycentric coordinates of a triangle.
It helps to know about angles.It will also help them in their studies.To know the interesting and they will be inter acted to the studies.It will get idea how it is prepared and they will also try to make it
Instructions for Submissions thorugh G- Classroom.pptxJheel Barad
This presentation provides a briefing on how to upload submissions and documents in Google Classroom. It was prepared as part of an orientation for new Sainik School in-service teacher trainees. As a training officer, my goal is to ensure that you are comfortable and proficient with this essential tool for managing assignments and fostering student engagement.
A Strategic Approach: GenAI in EducationPeter Windle
Artificial Intelligence (AI) technologies such as Generative AI, Image Generators and Large Language Models have had a dramatic impact on teaching, learning and assessment over the past 18 months. The most immediate threat AI posed was to Academic Integrity with Higher Education Institutes (HEIs) focusing their efforts on combating the use of GenAI in assessment. Guidelines were developed for staff and students, policies put in place too. Innovative educators have forged paths in the use of Generative AI for teaching, learning and assessments leading to pockets of transformation springing up across HEIs, often with little or no top-down guidance, support or direction.
This Gasta posits a strategic approach to integrating AI into HEIs to prepare staff, students and the curriculum for an evolving world and workplace. We will highlight the advantages of working with these technologies beyond the realm of teaching, learning and assessment by considering prompt engineering skills, industry impact, curriculum changes, and the need for staff upskilling. In contrast, not engaging strategically with Generative AI poses risks, including falling behind peers, missed opportunities and failing to ensure our graduates remain employable. The rapid evolution of AI technologies necessitates a proactive and strategic approach if we are to remain relevant.
2024.06.01 Introducing a competency framework for languag learning materials ...Sandy Millin
http://sandymillin.wordpress.com/iateflwebinar2024
Published classroom materials form the basis of syllabuses, drive teacher professional development, and have a potentially huge influence on learners, teachers and education systems. All teachers also create their own materials, whether a few sentences on a blackboard, a highly-structured fully-realised online course, or anything in between. Despite this, the knowledge and skills needed to create effective language learning materials are rarely part of teacher training, and are mostly learnt by trial and error.
Knowledge and skills frameworks, generally called competency frameworks, for ELT teachers, trainers and managers have existed for a few years now. However, until I created one for my MA dissertation, there wasn’t one drawing together what we need to know and do to be able to effectively produce language learning materials.
This webinar will introduce you to my framework, highlighting the key competencies I identified from my research. It will also show how anybody involved in language teaching (any language, not just English!), teacher training, managing schools or developing language learning materials can benefit from using the framework.
Macroeconomics- Movie Location
This will be used as part of your Personal Professional Portfolio once graded.
Objective:
Prepare a presentation or a paper using research, basic comparative analysis, data organization and application of economic information. You will make an informed assessment of an economic climate outside of the United States to accomplish an entertainment industry objective.
Operation “Blue Star” is the only event in the history of Independent India where the state went into war with its own people. Even after about 40 years it is not clear if it was culmination of states anger over people of the region, a political game of power or start of dictatorial chapter in the democratic setup.
The people of Punjab felt alienated from main stream due to denial of their just demands during a long democratic struggle since independence. As it happen all over the word, it led to militant struggle with great loss of lives of military, police and civilian personnel. Killing of Indira Gandhi and massacre of innocent Sikhs in Delhi and other India cities was also associated with this movement.
Embracing GenAI - A Strategic ImperativePeter Windle
Artificial Intelligence (AI) technologies such as Generative AI, Image Generators and Large Language Models have had a dramatic impact on teaching, learning and assessment over the past 18 months. The most immediate threat AI posed was to Academic Integrity with Higher Education Institutes (HEIs) focusing their efforts on combating the use of GenAI in assessment. Guidelines were developed for staff and students, policies put in place too. Innovative educators have forged paths in the use of Generative AI for teaching, learning and assessments leading to pockets of transformation springing up across HEIs, often with little or no top-down guidance, support or direction.
This Gasta posits a strategic approach to integrating AI into HEIs to prepare staff, students and the curriculum for an evolving world and workplace. We will highlight the advantages of working with these technologies beyond the realm of teaching, learning and assessment by considering prompt engineering skills, industry impact, curriculum changes, and the need for staff upskilling. In contrast, not engaging strategically with Generative AI poses risks, including falling behind peers, missed opportunities and failing to ensure our graduates remain employable. The rapid evolution of AI technologies necessitates a proactive and strategic approach if we are to remain relevant.
Acetabularia Information For Class 9 .docxvaibhavrinwa19
Acetabularia acetabulum is a single-celled green alga that in its vegetative state is morphologically differentiated into a basal rhizoid and an axially elongated stalk, which bears whorls of branching hairs. The single diploid nucleus resides in the rhizoid.
Synthetic Fiber Construction in lab .pptxPavel ( NSTU)
Synthetic fiber production is a fascinating and complex field that blends chemistry, engineering, and environmental science. By understanding these aspects, students can gain a comprehensive view of synthetic fiber production, its impact on society and the environment, and the potential for future innovations. Synthetic fibers play a crucial role in modern society, impacting various aspects of daily life, industry, and the environment. ynthetic fibers are integral to modern life, offering a range of benefits from cost-effectiveness and versatility to innovative applications and performance characteristics. While they pose environmental challenges, ongoing research and development aim to create more sustainable and eco-friendly alternatives. Understanding the importance of synthetic fibers helps in appreciating their role in the economy, industry, and daily life, while also emphasizing the need for sustainable practices and innovation.
Welcome to TechSoup New Member Orientation and Q&A (May 2024).pdfTechSoup
In this webinar you will learn how your organization can access TechSoup's wide variety of product discount and donation programs. From hardware to software, we'll give you a tour of the tools available to help your nonprofit with productivity, collaboration, financial management, donor tracking, security, and more.
Introduction to AI for Nonprofits with Tapp NetworkTechSoup
Dive into the world of AI! Experts Jon Hill and Tareq Monaur will guide you through AI's role in enhancing nonprofit websites and basic marketing strategies, making it easy to understand and apply.
1. Synopsis – Grade 9 Math Term II
Chapter 4: Linear Equations in Two Variables
An equation of the form, ax + by + c = 0, where a, b, and c are real numbers, such that a and
b are both not zero, is called a linear equation in two variables.
For example, 2x + 3y + 10 = 0, 3x + 7y = 0
Equations of the form, ax + b = 0 or cy + d = 0, are also examples of linear equations in
two variables since they can be written as ax +0. y + b = 0 or 0.x + cy + d = 0
respectively.
Solution of a linear equation in two variables
A solution of a linear equation represents a pair of values, one for x and one for y which
satisfy the given equation.
Linear equation in one variable has a unique solution.
Linear equation in two variables has infinitely many solutions.
Geometrical representation of a linear equation in two variables
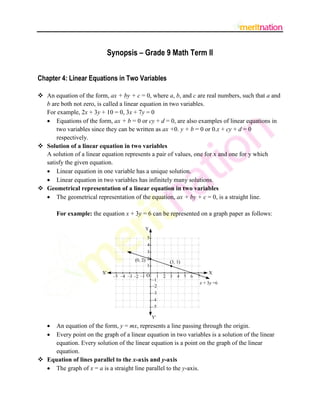
The geometrical representation of the equation, ax + by + c = 0, is a straight line.
For example: the equation x + 3y = 6 can be represented on a graph paper as follows:
An equation of the form, y = mx, represents a line passing through the origin.
Every point on the graph of a linear equation in two variables is a solution of the linear
equation. Every solution of the linear equation is a point on the graph of the linear
equation.
Equation of lines parallel to the x-axis and y-axis
The graph of x = a is a straight line parallel to the y-axis.
2.
The graph of y = b is a straight line parallel to the x-axis.
Chapter 8: Quadrilaterals
The sum of all the interior angles of a quadrilateral is 360°.
In the following quadrilateral ABCD, A + B + C + D = 360°.
Classification of quadrilaterals
Classification of parallelograms
Diagonals of a parallelogram divide it into two congruent triangles.
If ABCD is a parallelogram, then ABC CDA
In a parallelogram,
opposite sides are parallel and equal
opposite angles are equal
adjacent angles are supplementary
3. diagonals bisect each other
A quadrilateral is a parallelogram, if
each pair of opposite sides is equal
each pair of opposite angles is equal
diagonals bisect each other
a pair of opposite sides is equal and parallel
Properties of some special parallelograms
Diagonals of a rectangle are equal and bisect each other.
Diagonals of a rhombus bisect each other at right angles.
Diagonals of a square are equal and bisect each other at right angles.
Mid-point theorem and its converse
Mid-point theorem
The line segment joining the mid-point of any two sides of a triangle is parallel to the
third side and is half of it.
In ABC, if D and E are the mid-points of sides AB and AC respectively, then by the
BC
.
mid-point theorem, DE||BC and DE
2
Converse of the mid-point theorem
A line through the mid-point of one side of a triangle parallel to the other side bisects the
third side.
In the given figure, if AP = PB and PQ||BC, then PQ bisects AB i.e., Q is the mid-point
of AC.
The quadrilateral formed by joining the mid-points of the sides of a quadrilateral is a
parallelogram.
4. Chapter 9: Areas of Parallelograms and Triangles
Two congruent figures have equal areas, but the converse is not true.
If a figure is formed by two non-overlapping regions A and B, then the area of the figure =
Area (A) + Area (B).
Two figures lie on the same base and between the same parallels if they have a common base
and if the opposite vertex (or side) lies on a line parallel to the base.
For example:
In the first figure, parallelograms ABCE and ABDF lie on the same base AB and between the
same parallels AB and CF.
In the second figure, parallelogram ABCE and triangle ABD lie on the same base but they do
not lie between the same parallels.
Parallelograms on the same (or equal) base and between the same parallels are equal in area.
Its converse is also true, i.e., parallelograms on the same base and having equal areas lie
between the same parallels.
The area of a parallelogram is the product of its base and the corresponding height.
Areas of parallelogram and triangle on the same base
If a parallelogram and a triangle lie on the same (or equal) base and between the same
parallels, then the area of the triangle is half the area of the parallelogram.
If a parallelogram and a triangle lie on the same base and the area of the triangle is half
the area of the parallelogram, then the triangle and the parallelogram lie between the
same parallels.
Triangles on the same base and between the same parallels
Triangles on the same base (or equal base) and between the same parallels are equal in
area.
Triangles having the same base and equal areas lie between the same parallels.
The median of a triangle divides it into two congruent triangles.
5. Thus, a median of a triangle divides it into two triangles of equal area.
Chapter 10: Circles
Two or more circles are said to be congruent if they have the same radii.
Two or more circles are said to be concentric if their centre’s lie at the same point.
Angle subtended by chords at the centre
Chords that are equal in length subtend equal angles at the centre of the circle.
Chords subtending equal angles at the centre of the circle are equal in length.
Perpendicular from the centre to a chord
The perpendicular from the centre of a circle to a chord bisects the chord.
The line joining the centre of the circle to the mid-point of a chord is perpendicular to the
chord.
Perpendicular bisector of a chord always passes through the centre of the circle.
At least three points are required to construct a unique circle.
Equal chords and their distances from the centre
Equal chords of a circle (or congruent circles) are equidistant from the centre.
Chords which are equidistant from the centre of a circle are equal in length.
Angle subtended by an arc of a circle
Two or more chords are equal if and only if the corresponding arcs are congruent.
The angle subtended by an arc at the centre of the circle is double the angle subtended by
the arc at the remaining part of the circle.
For example:
Here, AXB is the angle subtended by arc AB at the remaining part of the circle.
AOB = 2 AXB
1
AXB 30 15
2
Angles in the same segment of a circle are equal.
6. PRQ and PSQ lie in the same segment of a circle.
PRQ = PSQ
Angle in a semicircle is a right angle.
Concyclic points
A set of points that lie on a common circle are known as concyclic points.
Here, A, B, D, and E are concyclic points.
If a line segment joining two points subtends equal angles at the two points lying on the
same side of the line segment, then the four points are concyclic.
For example:
Here, if ACB = ADB, then points A, B, C, and D are concyclic.
Cyclic quadrilaterals
A cyclic quadrilateral is a quadrilateral if all four vertices of the quadrilateral lie on a
circle.
Here, ABCD is a cyclic quadrilateral.
7.
The sum of each pair of opposite angles of a cyclic quadrilateral is 180.
If the sum of a pair of opposite angles of a quadrilateral is 180, then the quadrilateral is
cyclic.
The quadrilateral formed by the angle bisectors of interior angles of any quadrilateral is a
cyclic quadrilateral.
Non-parallel sides of a cyclic trapezium are equal in length.
Chapter 11: Constructions
When the base, base angle, and the sum of other two sides of a triangle are given, the
triangle can be constructed as follows.
Let us suppose base BC, B, and (AB + AC) are given.
Steps of construction:
(1) Draw BC and make an angle, B, at point B.
(2) Draw an arc on BX, which cuts it at point P, such that BP (= AB + AC).
(3) Join PC and draw its perpendicular bisector. Let this perpendicular bisector intersect BP
at A.
Thus, ABC is the required triangle.
When the base, base angle, and the difference between the other two sides of the
triangle are given, the triangle can be constructed as follows.
Let us suppose base BC, B, and (AB – AC) are given.
Steps of construction:
(1) Draw BC and make an angle, B, at point B.
(2) Draw an arc on BX, which cuts it at point P, such that BP (= AB – AC).
(3) Join PC and draw its perpendicular bisector. Let this perpendicular bisector intersect BX
at point A. Join AC.
8. Thus, ABC is the required triangle.
When the base BC, B, and (AC – AB) are given, the triangle can be constructed as
follows:
(1) Draw base BC and B.
(2) Draw an arc, which cuts extended BX on opposite side of BC at point Q, such that
BQ = (AC – AB).
(3) Join QC and draw its perpendicular bisector. Let this perpendicular bisector intersect BX
at point A. Join AC.
Thus, ABC is the required triangle.
When the perimeter and two base angles of the triangle are given, the triangle can be
constructed as follows.
Let us suppose that base angle, B, and C of ABC are given.
Steps of construction:
(1) Draw a line segment PQ of length equal to the perimeter of the triangle and draw the base
angles at points P and Q.
(2) Draw the angle bisectors of P and Q. Let these angle bisectors intersect each other at
point A.
(3) Draw the perpendicular bisectors of AP and AQ. Let these perpendicular bisectors
intersect PQ at points B and C respectively. Join AB and AC.
9. Thus, ABC is the required triangle.
Chapter 13: Surface Areas and Volumes
Cuboid
Consider a cuboid with dimensions l, b and h.
Lateral surface area = 2h(l + b)
Total surface area = 2(lb + bh + hl)
Volume = l × b × h
Cube
Consider a cube with edge length a.
Lateral surface area = 4a2
Total surface area = 6a2
Volume = a3
Right circular cylinder
Consider a right circular cylinder with height h and radius r.
10.
Curved surface area = 2πrh
Total surface area = 2πr (h + r)
Volume = πr2h
Right circular cone
Consider a right circular cone of height h, slant height l and base radius r.
Slant height, l h2 r 2
Curved surface area = πrl
Total surface area = πr (l + r)
1
Volume = πr 2 h
3
Sphere
Consider a sphere of radius r.
Curved surface area = Total surface area = 4πr2
4
Volume πr 3
3
11. Hemisphere
Consider a hemisphere of radius r.
Curved surface area = 2πr2
Total surface area = 3πr2
2
Volume πr 3
3
Chapter 14: Statistics
The marks of 20 students of a school are as follows.
86 49
52
78
46
54
62 71
92
87
84
45
58 52
50
60
77
85
88 63
The above data can be written in the form of class intervals as follows.
Marks
40 – 50
50 – 60
60 –70
70 – 80
80 –90
90 –100
Number of students
3
5
3
3
5
1
This table is called grouped frequency distribution table.
40 – 50, 50 – 60, etc. are class intervals.
40 is the lower limit and 50 is the upper limit of class interval 40 – 50.
The number of students for each class interval is the frequency of that class interval.
Exclusive frequency distribution table
The frequency distribution tables in which the upper limit of any class interval coincides with
the lower limit of the next class interval are known as exclusive frequency distribution tables.
12. Inclusive frequency distribution table
Consider the following table.
Class interval
10 – 19
20 –29
30 – 39
40 – 49
Frequency
2
7
4
1
Here, the upper limit of any class interval does not coincide with the lower class limit of next
class interval. Such frequency distribution table is known as inclusive frequency distribution
table.
20 19 1
It can be converted into exclusive table by subtracting
0.5 from the upper limit
2
2
and lower limit of each class interval as follows.
Class interval
(10 – 0.5) – (19 + 0.5)
(20 – 0.5) – (29 + 0.5)
(30 – 0.5) – (39 + 0.5)
(40 – 0.5) – (49 + 0.5)
Class interval
9.5 –19.5
19.5 – 29.5
29.5 –39.5
39.5 – 49.5
Frequency
2
7
4
1
A histogram is a graphical representation of data.
Example: Represent the given data in the form of a histogram.
Height (in cm)
140 – 150
150 – 160
160 – 170
170 –180
Number of students
10
6
15
4
Solution:
For this data, histogram can be drawn by taking class intervals along x-axis and frequency
along y-axis and then drawing bars parallel to y-axis.
The histogram for this data is as follows.
13. If the class intervals are not of uniform width, then in the histogram, the length of bars is
equal to adjusted frequencies. For example, consider the following data.
Frequency
1
5
8
6
Class interval
0 – 10
10 – 20
20 – 40
40 –70
Here, minimum class size is 10.
The adjusted frequencies can be calculated by,
Frequency
× Minimum class size
Class width
Therefore, we obtain the table as:
Class interval
Frequency
0 – 10
1
10 – 20
5
20 – 40
8
40 – 70
6
Adjusted frequency
1
10 1
10
5
10 5
10
8
10 4
20
6
10 2
30
The histogram can be drawn by taking class intervals on x-axis and adjusted frequencies on
y-axis.
14. The frequency polygon for a grouped data is drawn by first drawing its histogram and then
by joining the mid-points of the top of bars. For example, the frequency polygon for the data
given in the previous table can be drawn as follows.
ABCDEF is the required frequency polygon.
Measures of central tendency
Mean, median, and mode are the measures of central tendency.
Mean: Mean is defined by,
Sum of all observations
fi xi
Mean x
Total number of observations
fi
Median: To find the median, the observations are arranged in ascending or descending
order.
(i) If the number of observations (n) is odd, then value of
n 1
2
th
observation is the
median.
(ii) If the number of observations (n) is even, then the mean of the values of
n
2
th
th
n
and 1 observations is the median.
2
Mode: The value of the observation that occurs most frequently is called mode. Mode is
the value of observation whose frequency is maximum.
Chapter 15: Probability
Experiment: An experiment is a situation involving chance or probability.
For example, tossing a coin is an experiment.
15. Outcome: An outcome is the result of an experiment.
For example, getting a head on tossing a coin is an outcome.
Sample space: The set of all possible outcomes of an experiment is called sample space.
The sample space of the experiment of throwing a die is {1, 2, 3, 4, 5, 6}.
Event: An event is the set of one or more outcomes of an experiment.
For example, in the experiment of throwing a die, the event of getting an even number is {2,
4, 6}.
Probability: The empirical (or experimental) probability of an event A is given by
Number of favorable outcomes
P A
Total number of outcomes
Example: When a coin is tossed 500 times and on the upper face of the coin tail comes up
280 times, what is the probability of getting head on the upper face of the coin?
Solution: Let A be the event of getting head on the upper face of the coin.
Total number of trials = 500
Number of trials in which tail comes up = 280
Number of trials in which head comes up = 500 – 280 = 220
220 11
P A
500 25
The probability of an event always lies between 0 and 1.