This document provides an overview of research methods and processes. It discusses:
1) Three ways to understand the world - experience, reasoning, and research. Research involves forming hypotheses, testing theories, and problem solving.
2) Types of reasoning - deductive, inductive, and inductive-deductive. Inductive reasoning leads to hypothesis formation while deductive reasoning moves from general to specific.
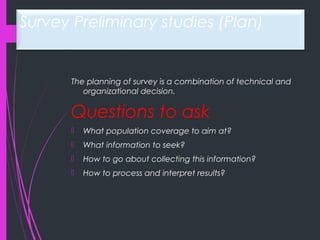
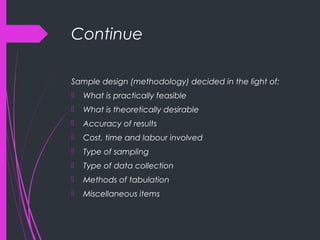
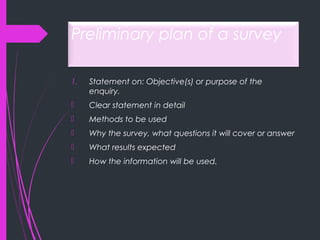
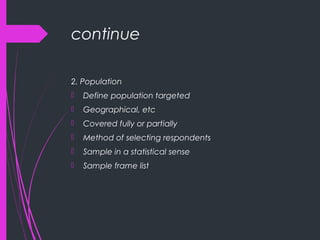
3) The research process which involves defining the problem, objectives, hypotheses, methodology, data collection and analysis, and reporting results.