Download to read offline

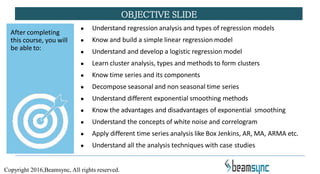
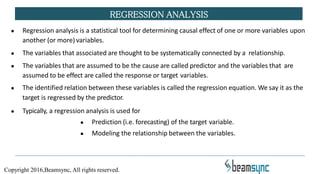
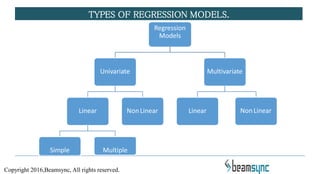
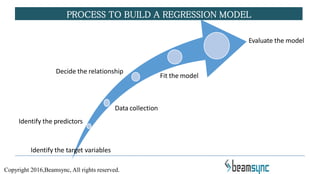
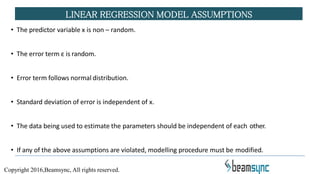

The document covers various predictive modeling techniques using R tools, focusing on regression analysis, including linear and logistic regression, cluster analysis, and time series analysis. It explains the purpose of regression analysis as a statistical tool for predicting and modeling relationships between variables, detailing how simple linear regression is established and its underlying assumptions. Additionally, it provides insights on model building processes and practical applications in business analytics.


![[Xin yan, xiao_gang_su]_linear_regression_analysis(book_fi.org)](https://cdn.slidesharecdn.com/ss_thumbnails/xinyanxiaogangsulinearregressionanalysisbookfi-140714092751-phpapp02-thumbnail.jpg?width=640&height=640&fit=bounds)