Download as PDF, PPTX

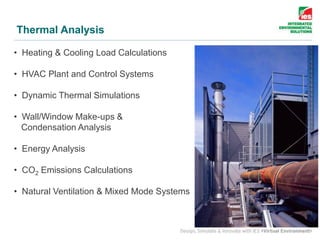
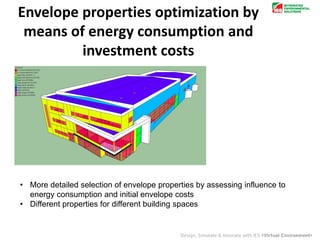
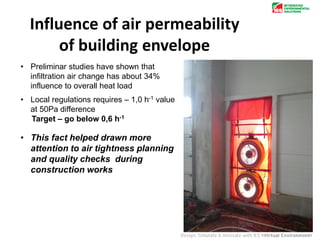
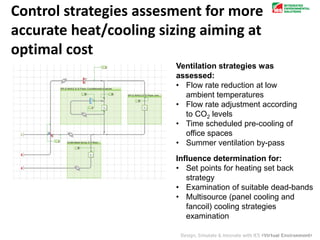
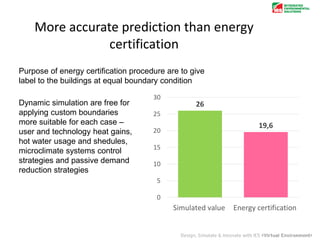

The document presents various features and capabilities of an integrated environmental solution for building energy simulation, covering aspects like HVAC modeling, dynamic thermal simulations, and energy consumption calculations. It highlights the importance of factors such as building geometry, air permeability, and ventilation strategies in optimizing energy efficiency and thermal comfort. Furthermore, the document discusses advancements in software tools that facilitate detailed analyses and assessments to achieve energy efficiency targets in building designs.


![[Deck] What's New in Spark-Iceberg Integration via DSV2.pptx](https://cdn.slidesharecdn.com/ss_thumbnails/deckwhatsnewinspark-icebergintegrationviadsv2-260210005337-25955b12-thumbnail.jpg?width=640&height=640&fit=bounds)


