SlideShare a Scribd company logo
1
BOSTON HOUSING DATA ANALYSIS
The Boston housing data is a classic dataset that has details about the median values of 506 properties
with details such as crime rate in the town, industrial properties intown, average number of rooms per
property among others. The goal of this exercise is to solve the prediction problem with medv,median
value of owner-occupied homes in $1000s as the response variable.
The data was sampled to split it into an 80-20 training – test data. Multiple methods were employed to
solve the predictionproblemsuchasGeneralizedlinearregression,RegressionTree,GeneralizedAdditive
Model and Neural networkto predictthe medvin the trainingand test data. The bestmodel foreach of
the models were evaluated and the below results were found.
GLM (Stepwise
Variable
Selection)
LASSO
Regression
Regression
Tree
GAM Neural
Network
Model equation -indus -age . lstat+ nox +
crim + rm +
dis
Smoothing term:
-age, - black, - zn,
-ptratio,
-chas, -rad
-
Model MSE 23.73 24.97 - - -
R-squared 0.7216 0.7216 - - -
Adj R-squared 0.7138 - - 0.877 -
AIC 2439.68 - - 2137.64 -
MSPE
(In-sample)
23.02 23.01 13.43 10.18 0.077
MSPE
(Out-of-sample)
18.15 18.30 16.53 10.15 9.00
Exploringthe above modelsshowsclearlythatthe Neural networkbuiltafterevaluatingthe numberof
nodesthatresultsinlowesttestSSE performedthe bestforpredictingthe housingpricesinBoston.For
the sake of interpretability,the GAM/ RegressionTree also performedfairlyandcan be usedto gainan
understandingof the predictionvariable.
2
BOSTON HOUSING DATA:
BACKGROUND:
The Bostondataset isa classicdataset inthe Data science worldthat’s usedto benchmarkalgorithms.It
wascollectedbytheUSCensusService BostonMass area.Itwasoriginallypublishedintheresearchpaper,
Harrison, D. and Rubinfeld, D.L. `Hedonic prices and the demand for clean air', J. Environ. Economics &
Management,vol.5,81-102, 1978. Clearly,amongitsmany applications,thisdatasetisaptfor exercising
variable selection methods and building predictive models.
ABOUT THE DATA:
The datasetcontains506observationsand14variables,suchascrime rate,proportionofresidentiallands
over25,000 sq.feet,proportionof non-retailbusinessacresamongothers. The datawasfurthersampled
to split it into an 80-20 training – test data using a seed value of 12420360.
MODEL SELECTION:
1. GENERALIZED LINEAR REGRESSION:
I) Full Model:
For the full model,the responsevariable,medvwasmodeledagainstall the 13 explanatoryvariables.
The resultantp-value of the full modelwas< 0.05, makingthe regressionmodel meaningful.The
adjustedR-squaredof the full modelwas0.7217, implyingthat72.17% of the variationinmedvis
explainedbythe regressionmodel.All variables,exceptforindusandage,were foundtobe significant,
hence explainingmedv.
R-squared Adj R-squared MSE AIC MSPE
(In-sample)
MSPE
(Out-of-sample)
0.7217 0.7124 23.84 2443.48 23.01 18.33
II) Step-wise Variable Selection:
Employing stepwise variable selection methods to identify the best model to predict medv, forward,
backward and step-wise variable selection was used. For all three cases, the null model was built witha
constant and the full model was built with all variables. AIC was used as the criterion for the variable
selection methods employed. All three methods produced the same result and the results of the step
function moving in both directions identified the best model with the lowest AIC value of 2439.68.
Final Model: medv~ lstat + rm + ptratio+ dis+ nox + chas + black+ zn + rad + tax + crim
The above identifiedfinal model wasfitintoalinearregressionmodel tocalculate the MSE,MSPE and
AIC.
R-squared Adj R-squared MSE AIC MSPE
(In-sample)
MSPE
(Out-of-sample)
0.7216 0.7138 23.73 2439.68 23.02 18.15
3
III) Reduced Model: LASSOregression
To identifythe bestmodel through LASSOregression, the independent variables were standardized and
the glmnetmethodwasusedto run the LASSOregression model.Fig. 1 showsthe LASSO plotindicating
the best variables at different values of lambda. As lambda increases, the number of best variables
decreases. Cross-validation techniques were used to identify an optimal lambda, lambda.min (tuning
parameter) of 0.0117. This optimal lambda is the value of lambda at which the MSE is the smallest.
Fig 1. LASSORegression plot forVariableselection
Final Model: medv~ crim + zn+ indus+ chas + nox + rm + age + dis+ rad + tax + ptratio + black+ lstat
The model wasre-builtusingthe optimal lambdaresultinginthe bestmodel withall the variables.The
out of sample error(MSPE) calculatedonthe testdata,was foundto be 18.30.
R-squared Adj R-squared MSE AIC MSPE
(In-sample)
MSPE
(Out-of-sample)
0.7216 - 24.97 - 23.01 18.30
2. REGRESSION TREE:
The CART technique separatesthe datasetintobinsbyprogressivelyaddingvariable-valuecombinations
to the sequence,ensuringthatat each stepthe splitincreasesthe homogeneityof the resultingsubsets
of observations. All 404 observations in the training dataset were fed into the regression tree and the
below tree was observed.
From the regressiontree, the MSPE on the trainingdata was foundto be 13.43 and on the test data was
found to be 16.53.
4
Fig 2. Regression tree plot from CART method
MSPE
(In-sample)
MSPE
(Out-of-sample)
13.43 16.53
3. GENERALIZED ADDITIVE MODELS:
A generalizedadditive model was builtwith a non-linear component to all the variables except for chas
and rad, both of which are binary categorical variables. From the summary of this GAMmodel, zn, age,
blackand ptratiowere foundtonothave a polynomial relationshipwiththe responsevariable,medv. Zn,
age and black were found to be insignificant. , while the edf of ptratio was found to be 1.
5
Basedon the above inference,anewgeneralizedadditive model wasbuiltwithanon-linearsmoothing
termon the significantparameters. The below summary wasobservedasthe outputof the GAM model.
Model (Smoothing) Adj R-squared AIC MSPE (In-sample) MSPE (Out-of-sample)
-age, - black, - zn, -ptratio,
-chas, -rad
0.877 2173.64 10.18 10.65
6
A large reduction in the MSPE (in-sample) and (out-of-sample) for the GAMmodel indicates that there
mightbe a strong polynomialrelationshipbetween some of the independentvariablesandthe response
variable.Hence,the GAM model providingalargerflexibilitymightbe a bettermodel for thisprediction
problem.
4. NEURAL NETWORK:
Toimplementtheneural networkalgorithm,adatapreprocessingstepisrequired. The datapreprocessing
step is necessary to ensure that the algorithm converges. The independent variables were normalized
with the max-min scaling using x = (X-Xmin)/(Xmax-Xmin).
Once the independentvariableswerescaled,the nnetfunctionwasusedtoevaluate the perfectnumber
of nodes to use in the neural network using a loop to evaluate the best number that minimizes the test
SSE.
Fig 3. Plot to evaluate optimal number of nodes
Fromthe above plot,itisevidentthatfor14 hiddennodes,the testSSEisminimum.Withthisevaluation,
the neural networkwasrebuiltusing14 hiddennodestoobtainthe best MSPE for in-sample andout-of-
sample set.
MSPE
(In-sample)
MSPE
(Out-of-sample)
0.076 9.001
Basedon the MSPE valuescalculatedforthe Neural network,the modelperformsthe bestin
comparisonwithall the modelsrun.
7
CONCLUSION:
Summarizing the results from all the models run for the prediction problem, the below table was
populated. Fromthe belowtable,comparisonsinthe performance betweenin-sample measurescanbe
done usingAIC,In-sample MSPE,while betweenthe out-of-sample measurescanbe done usingthe out-
of-sample MSE.
GLM (Stepwise
Variable
Selection)
LASSO
Regression
Regression
Tree
GAM Neural
Network
Model equation -indus -age . lstat+ nox +
crim + rm +
dis
Smoothing term:
-age, - black, - zn,
-ptratio,
-chas, -rad
-
Model MSE 23.73 24.97 - - -
R-squared 0.7216 0.7216 - - -
Adj R-squared 0.7138 - - 0.877 -
AIC 2439.68 - - 2137.64 -
MSPE
(In-sample)
23.02 23.01 13.43 10.18 0.076
MSPE
(Out-of-sample)
18.15 18.30 16.53 10.15 9.001
Forthe Bostonhousingdata,clearlythe Neuralnetwork modelgeneratedthe lowestMSPEforthe training
sample chosen. The In-sample MSPE was 0.076 and the out-of-sample MSPE was 9.001 indicating the
lowest value achievable for the sample. For the sake of interpretability, the Regression model and GAM
could also be further evaluated and better understood to predict the response variable, medv.
Extending this study, cross-validation methods can be used for all the models to generate a more
comparable value of the MSPE that is independent of the sample chosen.

More Related Content

What's hot

House Price Prediction.pptx
House Price Prediction.pptxHouse Price Prediction.pptx
House Price Prediction.pptx
CodingWorld5
 
Prediction of house price using multiple regression
Prediction of house price using multiple regressionPrediction of house price using multiple regression
Prediction of house price using multiple regression
vinovk
 
IRJET- House Rent Price Prediction
IRJET- House Rent Price PredictionIRJET- House Rent Price Prediction
IRJET- House Rent Price Prediction
IRJET Journal
 
Maximum Likelihood Estimation
Maximum Likelihood EstimationMaximum Likelihood Estimation
Maximum Likelihood Estimation
guestfee8698
 
Predicting house price
Predicting house pricePredicting house price
Predicting house price
Divya Tiwari
 
House price prediction
House price predictionHouse price prediction
House price prediction
Karanseth30
 
Ames housing
Ames housingAmes housing
Ames housing
Archit Vora
 
House price prediction
House price predictionHouse price prediction
House price prediction
SabahBegum
 
House Price Estimates Based on Machine Learning Algorithm
House Price Estimates Based on Machine Learning AlgorithmHouse Price Estimates Based on Machine Learning Algorithm
House Price Estimates Based on Machine Learning Algorithm
ijtsrd
 
Predicting King County House Prices
Predicting King County House PricesPredicting King County House Prices
Predicting King County House Prices
Pawan Shivhare
 
Statistical Analysis with R -I
Statistical Analysis with R -IStatistical Analysis with R -I
Statistical Analysis with R -I
Akhila Prabhakaran
 
Prediction of customer propensity to churn - Telecom Industry
Prediction of customer propensity to churn - Telecom IndustryPrediction of customer propensity to churn - Telecom Industry
Prediction of customer propensity to churn - Telecom Industry
Pranov Mishra
 
Machine learning session5(logistic regression)
Machine learning   session5(logistic regression)Machine learning   session5(logistic regression)
Machine learning session5(logistic regression)
Abhimanyu Dwivedi
 
House price prediction
House price predictionHouse price prediction
House price prediction
AdityaKumar1505
 
Maximum likelihood estimation
Maximum likelihood estimationMaximum likelihood estimation
Maximum likelihood estimation
zihad164
 
Time series predictions using LSTMs
Time series predictions using LSTMsTime series predictions using LSTMs
Time series predictions using LSTMs
Setu Chokshi
 
Machine learning
Machine learningMachine learning
Machine learning
Mike Martinez
 
Denoising autoencoder by Harish.R
Denoising autoencoder by Harish.RDenoising autoencoder by Harish.R
Denoising autoencoder by Harish.R
HARISH R
 
Variational Autoencoder
Variational AutoencoderVariational Autoencoder
Variational Autoencoder
Mark Chang
 
Machine Learning - Simple Linear Regression
Machine Learning - Simple Linear RegressionMachine Learning - Simple Linear Regression
Machine Learning - Simple Linear Regression
Siddharth Shrivastava
 

What's hot (20)

House Price Prediction.pptx
House Price Prediction.pptxHouse Price Prediction.pptx
House Price Prediction.pptx
 
Prediction of house price using multiple regression
Prediction of house price using multiple regressionPrediction of house price using multiple regression
Prediction of house price using multiple regression
 
IRJET- House Rent Price Prediction
IRJET- House Rent Price PredictionIRJET- House Rent Price Prediction
IRJET- House Rent Price Prediction
 
Maximum Likelihood Estimation
Maximum Likelihood EstimationMaximum Likelihood Estimation
Maximum Likelihood Estimation
 
Predicting house price
Predicting house pricePredicting house price
Predicting house price
 
House price prediction
House price predictionHouse price prediction
House price prediction
 
Ames housing
Ames housingAmes housing
Ames housing
 
House price prediction
House price predictionHouse price prediction
House price prediction
 
House Price Estimates Based on Machine Learning Algorithm
House Price Estimates Based on Machine Learning AlgorithmHouse Price Estimates Based on Machine Learning Algorithm
House Price Estimates Based on Machine Learning Algorithm
 
Predicting King County House Prices
Predicting King County House PricesPredicting King County House Prices
Predicting King County House Prices
 
Statistical Analysis with R -I
Statistical Analysis with R -IStatistical Analysis with R -I
Statistical Analysis with R -I
 
Prediction of customer propensity to churn - Telecom Industry
Prediction of customer propensity to churn - Telecom IndustryPrediction of customer propensity to churn - Telecom Industry
Prediction of customer propensity to churn - Telecom Industry
 
Machine learning session5(logistic regression)
Machine learning   session5(logistic regression)Machine learning   session5(logistic regression)
Machine learning session5(logistic regression)
 
House price prediction
House price predictionHouse price prediction
House price prediction
 
Maximum likelihood estimation
Maximum likelihood estimationMaximum likelihood estimation
Maximum likelihood estimation
 
Time series predictions using LSTMs
Time series predictions using LSTMsTime series predictions using LSTMs
Time series predictions using LSTMs
 
Machine learning
Machine learningMachine learning
Machine learning
 
Denoising autoencoder by Harish.R
Denoising autoencoder by Harish.RDenoising autoencoder by Harish.R
Denoising autoencoder by Harish.R
 
Variational Autoencoder
Variational AutoencoderVariational Autoencoder
Variational Autoencoder
 
Machine Learning - Simple Linear Regression
Machine Learning - Simple Linear RegressionMachine Learning - Simple Linear Regression
Machine Learning - Simple Linear Regression
 

Similar to Boston housing data analysis

Variable Selection Methods
Variable Selection MethodsVariable Selection Methods
Variable Selection Methods
joycemi_la
 
Variable Selection Methods
Variable Selection MethodsVariable Selection Methods
Variable Selection Methods
joycemi_la
 
German credit data analysis
German credit data analysisGerman credit data analysis
German credit data analysis
Preethi Jayaram Jayaraman
 
P1121133727
P1121133727P1121133727
P1121133727
Ashraf Aboshosha
 
Parameter Optimisation for Automated Feature Point Detection
Parameter Optimisation for Automated Feature Point DetectionParameter Optimisation for Automated Feature Point Detection
Parameter Optimisation for Automated Feature Point Detection
Dario Panada
 
An ann approach for network
An ann approach for networkAn ann approach for network
An ann approach for network
IJNSA Journal
 
Black-box modeling of nonlinear system using evolutionary neural NARX model
Black-box modeling of nonlinear system using evolutionary neural NARX modelBlack-box modeling of nonlinear system using evolutionary neural NARX model
Black-box modeling of nonlinear system using evolutionary neural NARX model
IJECEIAES
 
Disease Classification using ECG Signal Based on PCA Feature along with GA & ...
Disease Classification using ECG Signal Based on PCA Feature along with GA & ...Disease Classification using ECG Signal Based on PCA Feature along with GA & ...
Disease Classification using ECG Signal Based on PCA Feature along with GA & ...
IRJET Journal
 
General pipeline of transcriptomics analysis
General pipeline of transcriptomics analysisGeneral pipeline of transcriptomics analysis
General pipeline of transcriptomics analysis
Santy Marques-Ladeira
 
Computational Intelligence Assisted Engineering Design Optimization (using MA...
Computational Intelligence Assisted Engineering Design Optimization (using MA...Computational Intelligence Assisted Engineering Design Optimization (using MA...
Computational Intelligence Assisted Engineering Design Optimization (using MA...
AmirParnianifard1
 
AN ANN APPROACH FOR NETWORK INTRUSION DETECTION USING ENTROPY BASED FEATURE S...
AN ANN APPROACH FOR NETWORK INTRUSION DETECTION USING ENTROPY BASED FEATURE S...AN ANN APPROACH FOR NETWORK INTRUSION DETECTION USING ENTROPY BASED FEATURE S...
AN ANN APPROACH FOR NETWORK INTRUSION DETECTION USING ENTROPY BASED FEATURE S...
IJNSA Journal
 
Dm
DmDm
crowd counting.pptx
crowd counting.pptxcrowd counting.pptx
crowd counting.pptx
shubhampawar445982
 
EFFICIENT USE OF HYBRID ADAPTIVE NEURO-FUZZY INFERENCE SYSTEM COMBINED WITH N...
EFFICIENT USE OF HYBRID ADAPTIVE NEURO-FUZZY INFERENCE SYSTEM COMBINED WITH N...EFFICIENT USE OF HYBRID ADAPTIVE NEURO-FUZZY INFERENCE SYSTEM COMBINED WITH N...
EFFICIENT USE OF HYBRID ADAPTIVE NEURO-FUZZY INFERENCE SYSTEM COMBINED WITH N...
csandit
 
A Mathematical Programming Approach for Selection of Variables in Cluster Ana...
A Mathematical Programming Approach for Selection of Variables in Cluster Ana...A Mathematical Programming Approach for Selection of Variables in Cluster Ana...
A Mathematical Programming Approach for Selection of Variables in Cluster Ana...
IJRES Journal
 
MEM and SEM in the GME framework: Modelling Perception and Satisfaction - Car...
MEM and SEM in the GME framework: Modelling Perception and Satisfaction - Car...MEM and SEM in the GME framework: Modelling Perception and Satisfaction - Car...
MEM and SEM in the GME framework: Modelling Perception and Satisfaction - Car...
SYRTO Project
 
23
2323
Feed forward neural network for sine
Feed forward neural network for sineFeed forward neural network for sine
Feed forward neural network for sine
ijcsa
 
AIAA-SDM-PEMF-2013
AIAA-SDM-PEMF-2013AIAA-SDM-PEMF-2013
AIAA-SDM-PEMF-2013
OptiModel
 
A genetic algorithm to solve the
A genetic algorithm to solve theA genetic algorithm to solve the
A genetic algorithm to solve the
IJCNCJournal
 

Similar to Boston housing data analysis (20)

Variable Selection Methods
Variable Selection MethodsVariable Selection Methods
Variable Selection Methods
 
Variable Selection Methods
Variable Selection MethodsVariable Selection Methods
Variable Selection Methods
 
German credit data analysis
German credit data analysisGerman credit data analysis
German credit data analysis
 
P1121133727
P1121133727P1121133727
P1121133727
 
Parameter Optimisation for Automated Feature Point Detection
Parameter Optimisation for Automated Feature Point DetectionParameter Optimisation for Automated Feature Point Detection
Parameter Optimisation for Automated Feature Point Detection
 
An ann approach for network
An ann approach for networkAn ann approach for network
An ann approach for network
 
Black-box modeling of nonlinear system using evolutionary neural NARX model
Black-box modeling of nonlinear system using evolutionary neural NARX modelBlack-box modeling of nonlinear system using evolutionary neural NARX model
Black-box modeling of nonlinear system using evolutionary neural NARX model
 
Disease Classification using ECG Signal Based on PCA Feature along with GA & ...
Disease Classification using ECG Signal Based on PCA Feature along with GA & ...Disease Classification using ECG Signal Based on PCA Feature along with GA & ...
Disease Classification using ECG Signal Based on PCA Feature along with GA & ...
 
General pipeline of transcriptomics analysis
General pipeline of transcriptomics analysisGeneral pipeline of transcriptomics analysis
General pipeline of transcriptomics analysis
 
Computational Intelligence Assisted Engineering Design Optimization (using MA...
Computational Intelligence Assisted Engineering Design Optimization (using MA...Computational Intelligence Assisted Engineering Design Optimization (using MA...
Computational Intelligence Assisted Engineering Design Optimization (using MA...
 
AN ANN APPROACH FOR NETWORK INTRUSION DETECTION USING ENTROPY BASED FEATURE S...
AN ANN APPROACH FOR NETWORK INTRUSION DETECTION USING ENTROPY BASED FEATURE S...AN ANN APPROACH FOR NETWORK INTRUSION DETECTION USING ENTROPY BASED FEATURE S...
AN ANN APPROACH FOR NETWORK INTRUSION DETECTION USING ENTROPY BASED FEATURE S...
 
Dm
DmDm
Dm
 
crowd counting.pptx
crowd counting.pptxcrowd counting.pptx
crowd counting.pptx
 
EFFICIENT USE OF HYBRID ADAPTIVE NEURO-FUZZY INFERENCE SYSTEM COMBINED WITH N...
EFFICIENT USE OF HYBRID ADAPTIVE NEURO-FUZZY INFERENCE SYSTEM COMBINED WITH N...EFFICIENT USE OF HYBRID ADAPTIVE NEURO-FUZZY INFERENCE SYSTEM COMBINED WITH N...
EFFICIENT USE OF HYBRID ADAPTIVE NEURO-FUZZY INFERENCE SYSTEM COMBINED WITH N...
 
A Mathematical Programming Approach for Selection of Variables in Cluster Ana...
A Mathematical Programming Approach for Selection of Variables in Cluster Ana...A Mathematical Programming Approach for Selection of Variables in Cluster Ana...
A Mathematical Programming Approach for Selection of Variables in Cluster Ana...
 
MEM and SEM in the GME framework: Modelling Perception and Satisfaction - Car...
MEM and SEM in the GME framework: Modelling Perception and Satisfaction - Car...MEM and SEM in the GME framework: Modelling Perception and Satisfaction - Car...
MEM and SEM in the GME framework: Modelling Perception and Satisfaction - Car...
 
23
2323
23
 
Feed forward neural network for sine
Feed forward neural network for sineFeed forward neural network for sine
Feed forward neural network for sine
 
AIAA-SDM-PEMF-2013
AIAA-SDM-PEMF-2013AIAA-SDM-PEMF-2013
AIAA-SDM-PEMF-2013
 
A genetic algorithm to solve the
A genetic algorithm to solve theA genetic algorithm to solve the
A genetic algorithm to solve the
 

Recently uploaded

State of Artificial intelligence Report 2023
State of Artificial intelligence Report 2023State of Artificial intelligence Report 2023
State of Artificial intelligence Report 2023
kuntobimo2016
 
一比一原版(UO毕业证)渥太华大学毕业证如何办理
一比一原版(UO毕业证)渥太华大学毕业证如何办理一比一原版(UO毕业证)渥太华大学毕业证如何办理
一比一原版(UO毕业证)渥太华大学毕业证如何办理
aqzctr7x
 
Learn SQL from basic queries to Advance queries
Learn SQL from basic queries to Advance queriesLearn SQL from basic queries to Advance queries
Learn SQL from basic queries to Advance queries
manishkhaire30
 
原版制作(Deakin毕业证书)迪肯大学毕业证学位证一模一样
原版制作(Deakin毕业证书)迪肯大学毕业证学位证一模一样原版制作(Deakin毕业证书)迪肯大学毕业证学位证一模一样
原版制作(Deakin毕业证书)迪肯大学毕业证学位证一模一样
u86oixdj
 
一比一原版(UofS毕业证书)萨省大学毕业证如何办理
一比一原版(UofS毕业证书)萨省大学毕业证如何办理一比一原版(UofS毕业证书)萨省大学毕业证如何办理
一比一原版(UofS毕业证书)萨省大学毕业证如何办理
v3tuleee
 
End-to-end pipeline agility - Berlin Buzzwords 2024
End-to-end pipeline agility - Berlin Buzzwords 2024End-to-end pipeline agility - Berlin Buzzwords 2024
End-to-end pipeline agility - Berlin Buzzwords 2024
Lars Albertsson
 
一比一原版(GWU,GW文凭证书)乔治·华盛顿大学毕业证如何办理
一比一原版(GWU,GW文凭证书)乔治·华盛顿大学毕业证如何办理一比一原版(GWU,GW文凭证书)乔治·华盛顿大学毕业证如何办理
一比一原版(GWU,GW文凭证书)乔治·华盛顿大学毕业证如何办理
bopyb
 
ViewShift: Hassle-free Dynamic Policy Enforcement for Every Data Lake
ViewShift: Hassle-free Dynamic Policy Enforcement for Every Data LakeViewShift: Hassle-free Dynamic Policy Enforcement for Every Data Lake
ViewShift: Hassle-free Dynamic Policy Enforcement for Every Data Lake
Walaa Eldin Moustafa
 
The Ipsos - AI - Monitor 2024 Report.pdf
The  Ipsos - AI - Monitor 2024 Report.pdfThe  Ipsos - AI - Monitor 2024 Report.pdf
The Ipsos - AI - Monitor 2024 Report.pdf
Social Samosa
 
一比一原版(Chester毕业证书)切斯特大学毕业证如何办理
一比一原版(Chester毕业证书)切斯特大学毕业证如何办理一比一原版(Chester毕业证书)切斯特大学毕业证如何办理
一比一原版(Chester毕业证书)切斯特大学毕业证如何办理
74nqk8xf
 
Enhanced Enterprise Intelligence with your personal AI Data Copilot.pdf
Enhanced Enterprise Intelligence with your personal AI Data Copilot.pdfEnhanced Enterprise Intelligence with your personal AI Data Copilot.pdf
Enhanced Enterprise Intelligence with your personal AI Data Copilot.pdf
GetInData
 
Influence of Marketing Strategy and Market Competition on Business Plan
Influence of Marketing Strategy and Market Competition on Business PlanInfluence of Marketing Strategy and Market Competition on Business Plan
Influence of Marketing Strategy and Market Competition on Business Plan
jerlynmaetalle
 
一比一原版(BCU毕业证书)伯明翰城市大学毕业证如何办理
一比一原版(BCU毕业证书)伯明翰城市大学毕业证如何办理一比一原版(BCU毕业证书)伯明翰城市大学毕业证如何办理
一比一原版(BCU毕业证书)伯明翰城市大学毕业证如何办理
dwreak4tg
 
STATATHON: Unleashing the Power of Statistics in a 48-Hour Knowledge Extravag...
STATATHON: Unleashing the Power of Statistics in a 48-Hour Knowledge Extravag...STATATHON: Unleashing the Power of Statistics in a 48-Hour Knowledge Extravag...
STATATHON: Unleashing the Power of Statistics in a 48-Hour Knowledge Extravag...
sameer shah
 
Everything you wanted to know about LIHTC
Everything you wanted to know about LIHTCEverything you wanted to know about LIHTC
Everything you wanted to know about LIHTC
Roger Valdez
 
一比一原版(Dalhousie毕业证书)达尔豪斯大学毕业证如何办理
一比一原版(Dalhousie毕业证书)达尔豪斯大学毕业证如何办理一比一原版(Dalhousie毕业证书)达尔豪斯大学毕业证如何办理
一比一原版(Dalhousie毕业证书)达尔豪斯大学毕业证如何办理
mzpolocfi
 
一比一原版(爱大毕业证书)爱丁堡大学毕业证如何办理
一比一原版(爱大毕业证书)爱丁堡大学毕业证如何办理一比一原版(爱大毕业证书)爱丁堡大学毕业证如何办理
一比一原版(爱大毕业证书)爱丁堡大学毕业证如何办理
g4dpvqap0
 
一比一原版(UMN文凭证书)明尼苏达大学毕业证如何办理
一比一原版(UMN文凭证书)明尼苏达大学毕业证如何办理一比一原版(UMN文凭证书)明尼苏达大学毕业证如何办理
一比一原版(UMN文凭证书)明尼苏达大学毕业证如何办理
nyfuhyz
 
My burning issue is homelessness K.C.M.O.
My burning issue is homelessness K.C.M.O.My burning issue is homelessness K.C.M.O.
My burning issue is homelessness K.C.M.O.
rwarrenll
 
Population Growth in Bataan: The effects of population growth around rural pl...
Population Growth in Bataan: The effects of population growth around rural pl...Population Growth in Bataan: The effects of population growth around rural pl...
Population Growth in Bataan: The effects of population growth around rural pl...
Bill641377
 

Recently uploaded (20)

State of Artificial intelligence Report 2023
State of Artificial intelligence Report 2023State of Artificial intelligence Report 2023
State of Artificial intelligence Report 2023
 
一比一原版(UO毕业证)渥太华大学毕业证如何办理
一比一原版(UO毕业证)渥太华大学毕业证如何办理一比一原版(UO毕业证)渥太华大学毕业证如何办理
一比一原版(UO毕业证)渥太华大学毕业证如何办理
 
Learn SQL from basic queries to Advance queries
Learn SQL from basic queries to Advance queriesLearn SQL from basic queries to Advance queries
Learn SQL from basic queries to Advance queries
 
原版制作(Deakin毕业证书)迪肯大学毕业证学位证一模一样
原版制作(Deakin毕业证书)迪肯大学毕业证学位证一模一样原版制作(Deakin毕业证书)迪肯大学毕业证学位证一模一样
原版制作(Deakin毕业证书)迪肯大学毕业证学位证一模一样
 
一比一原版(UofS毕业证书)萨省大学毕业证如何办理
一比一原版(UofS毕业证书)萨省大学毕业证如何办理一比一原版(UofS毕业证书)萨省大学毕业证如何办理
一比一原版(UofS毕业证书)萨省大学毕业证如何办理
 
End-to-end pipeline agility - Berlin Buzzwords 2024
End-to-end pipeline agility - Berlin Buzzwords 2024End-to-end pipeline agility - Berlin Buzzwords 2024
End-to-end pipeline agility - Berlin Buzzwords 2024
 
一比一原版(GWU,GW文凭证书)乔治·华盛顿大学毕业证如何办理
一比一原版(GWU,GW文凭证书)乔治·华盛顿大学毕业证如何办理一比一原版(GWU,GW文凭证书)乔治·华盛顿大学毕业证如何办理
一比一原版(GWU,GW文凭证书)乔治·华盛顿大学毕业证如何办理
 
ViewShift: Hassle-free Dynamic Policy Enforcement for Every Data Lake
ViewShift: Hassle-free Dynamic Policy Enforcement for Every Data LakeViewShift: Hassle-free Dynamic Policy Enforcement for Every Data Lake
ViewShift: Hassle-free Dynamic Policy Enforcement for Every Data Lake
 
The Ipsos - AI - Monitor 2024 Report.pdf
The  Ipsos - AI - Monitor 2024 Report.pdfThe  Ipsos - AI - Monitor 2024 Report.pdf
The Ipsos - AI - Monitor 2024 Report.pdf
 
一比一原版(Chester毕业证书)切斯特大学毕业证如何办理
一比一原版(Chester毕业证书)切斯特大学毕业证如何办理一比一原版(Chester毕业证书)切斯特大学毕业证如何办理
一比一原版(Chester毕业证书)切斯特大学毕业证如何办理
 
Enhanced Enterprise Intelligence with your personal AI Data Copilot.pdf
Enhanced Enterprise Intelligence with your personal AI Data Copilot.pdfEnhanced Enterprise Intelligence with your personal AI Data Copilot.pdf
Enhanced Enterprise Intelligence with your personal AI Data Copilot.pdf
 
Influence of Marketing Strategy and Market Competition on Business Plan
Influence of Marketing Strategy and Market Competition on Business PlanInfluence of Marketing Strategy and Market Competition on Business Plan
Influence of Marketing Strategy and Market Competition on Business Plan
 
一比一原版(BCU毕业证书)伯明翰城市大学毕业证如何办理
一比一原版(BCU毕业证书)伯明翰城市大学毕业证如何办理一比一原版(BCU毕业证书)伯明翰城市大学毕业证如何办理
一比一原版(BCU毕业证书)伯明翰城市大学毕业证如何办理
 
STATATHON: Unleashing the Power of Statistics in a 48-Hour Knowledge Extravag...
STATATHON: Unleashing the Power of Statistics in a 48-Hour Knowledge Extravag...STATATHON: Unleashing the Power of Statistics in a 48-Hour Knowledge Extravag...
STATATHON: Unleashing the Power of Statistics in a 48-Hour Knowledge Extravag...
 
Everything you wanted to know about LIHTC
Everything you wanted to know about LIHTCEverything you wanted to know about LIHTC
Everything you wanted to know about LIHTC
 
一比一原版(Dalhousie毕业证书)达尔豪斯大学毕业证如何办理
一比一原版(Dalhousie毕业证书)达尔豪斯大学毕业证如何办理一比一原版(Dalhousie毕业证书)达尔豪斯大学毕业证如何办理
一比一原版(Dalhousie毕业证书)达尔豪斯大学毕业证如何办理
 
一比一原版(爱大毕业证书)爱丁堡大学毕业证如何办理
一比一原版(爱大毕业证书)爱丁堡大学毕业证如何办理一比一原版(爱大毕业证书)爱丁堡大学毕业证如何办理
一比一原版(爱大毕业证书)爱丁堡大学毕业证如何办理
 
一比一原版(UMN文凭证书)明尼苏达大学毕业证如何办理
一比一原版(UMN文凭证书)明尼苏达大学毕业证如何办理一比一原版(UMN文凭证书)明尼苏达大学毕业证如何办理
一比一原版(UMN文凭证书)明尼苏达大学毕业证如何办理
 
My burning issue is homelessness K.C.M.O.
My burning issue is homelessness K.C.M.O.My burning issue is homelessness K.C.M.O.
My burning issue is homelessness K.C.M.O.
 
Population Growth in Bataan: The effects of population growth around rural pl...
Population Growth in Bataan: The effects of population growth around rural pl...Population Growth in Bataan: The effects of population growth around rural pl...
Population Growth in Bataan: The effects of population growth around rural pl...
 

Boston housing data analysis

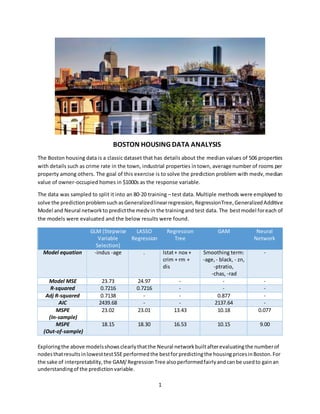
  • 1. 1 BOSTON HOUSING DATA ANALYSIS The Boston housing data is a classic dataset that has details about the median values of 506 properties with details such as crime rate in the town, industrial properties intown, average number of rooms per property among others. The goal of this exercise is to solve the prediction problem with medv,median value of owner-occupied homes in $1000s as the response variable. The data was sampled to split it into an 80-20 training – test data. Multiple methods were employed to solve the predictionproblemsuchasGeneralizedlinearregression,RegressionTree,GeneralizedAdditive Model and Neural networkto predictthe medvin the trainingand test data. The bestmodel foreach of the models were evaluated and the below results were found. GLM (Stepwise Variable Selection) LASSO Regression Regression Tree GAM Neural Network Model equation -indus -age . lstat+ nox + crim + rm + dis Smoothing term: -age, - black, - zn, -ptratio, -chas, -rad - Model MSE 23.73 24.97 - - - R-squared 0.7216 0.7216 - - - Adj R-squared 0.7138 - - 0.877 - AIC 2439.68 - - 2137.64 - MSPE (In-sample) 23.02 23.01 13.43 10.18 0.077 MSPE (Out-of-sample) 18.15 18.30 16.53 10.15 9.00 Exploringthe above modelsshowsclearlythatthe Neural networkbuiltafterevaluatingthe numberof nodesthatresultsinlowesttestSSE performedthe bestforpredictingthe housingpricesinBoston.For the sake of interpretability,the GAM/ RegressionTree also performedfairlyandcan be usedto gainan understandingof the predictionvariable.
  • 2. 2 BOSTON HOUSING DATA: BACKGROUND: The Bostondataset isa classicdataset inthe Data science worldthat’s usedto benchmarkalgorithms.It wascollectedbytheUSCensusService BostonMass area.Itwasoriginallypublishedintheresearchpaper, Harrison, D. and Rubinfeld, D.L. `Hedonic prices and the demand for clean air', J. Environ. Economics & Management,vol.5,81-102, 1978. Clearly,amongitsmany applications,thisdatasetisaptfor exercising variable selection methods and building predictive models. ABOUT THE DATA: The datasetcontains506observationsand14variables,suchascrime rate,proportionofresidentiallands over25,000 sq.feet,proportionof non-retailbusinessacresamongothers. The datawasfurthersampled to split it into an 80-20 training – test data using a seed value of 12420360. MODEL SELECTION: 1. GENERALIZED LINEAR REGRESSION: I) Full Model: For the full model,the responsevariable,medvwasmodeledagainstall the 13 explanatoryvariables. The resultantp-value of the full modelwas< 0.05, makingthe regressionmodel meaningful.The adjustedR-squaredof the full modelwas0.7217, implyingthat72.17% of the variationinmedvis explainedbythe regressionmodel.All variables,exceptforindusandage,were foundtobe significant, hence explainingmedv. R-squared Adj R-squared MSE AIC MSPE (In-sample) MSPE (Out-of-sample) 0.7217 0.7124 23.84 2443.48 23.01 18.33 II) Step-wise Variable Selection: Employing stepwise variable selection methods to identify the best model to predict medv, forward, backward and step-wise variable selection was used. For all three cases, the null model was built witha constant and the full model was built with all variables. AIC was used as the criterion for the variable selection methods employed. All three methods produced the same result and the results of the step function moving in both directions identified the best model with the lowest AIC value of 2439.68. Final Model: medv~ lstat + rm + ptratio+ dis+ nox + chas + black+ zn + rad + tax + crim The above identifiedfinal model wasfitintoalinearregressionmodel tocalculate the MSE,MSPE and AIC. R-squared Adj R-squared MSE AIC MSPE (In-sample) MSPE (Out-of-sample) 0.7216 0.7138 23.73 2439.68 23.02 18.15
  • 3. 3 III) Reduced Model: LASSOregression To identifythe bestmodel through LASSOregression, the independent variables were standardized and the glmnetmethodwasusedto run the LASSOregression model.Fig. 1 showsthe LASSO plotindicating the best variables at different values of lambda. As lambda increases, the number of best variables decreases. Cross-validation techniques were used to identify an optimal lambda, lambda.min (tuning parameter) of 0.0117. This optimal lambda is the value of lambda at which the MSE is the smallest. Fig 1. LASSORegression plot forVariableselection Final Model: medv~ crim + zn+ indus+ chas + nox + rm + age + dis+ rad + tax + ptratio + black+ lstat The model wasre-builtusingthe optimal lambdaresultinginthe bestmodel withall the variables.The out of sample error(MSPE) calculatedonthe testdata,was foundto be 18.30. R-squared Adj R-squared MSE AIC MSPE (In-sample) MSPE (Out-of-sample) 0.7216 - 24.97 - 23.01 18.30 2. REGRESSION TREE: The CART technique separatesthe datasetintobinsbyprogressivelyaddingvariable-valuecombinations to the sequence,ensuringthatat each stepthe splitincreasesthe homogeneityof the resultingsubsets of observations. All 404 observations in the training dataset were fed into the regression tree and the below tree was observed. From the regressiontree, the MSPE on the trainingdata was foundto be 13.43 and on the test data was found to be 16.53.
  • 4. 4 Fig 2. Regression tree plot from CART method MSPE (In-sample) MSPE (Out-of-sample) 13.43 16.53 3. GENERALIZED ADDITIVE MODELS: A generalizedadditive model was builtwith a non-linear component to all the variables except for chas and rad, both of which are binary categorical variables. From the summary of this GAMmodel, zn, age, blackand ptratiowere foundtonothave a polynomial relationshipwiththe responsevariable,medv. Zn, age and black were found to be insignificant. , while the edf of ptratio was found to be 1.
  • 5. 5 Basedon the above inference,anewgeneralizedadditive model wasbuiltwithanon-linearsmoothing termon the significantparameters. The below summary wasobservedasthe outputof the GAM model. Model (Smoothing) Adj R-squared AIC MSPE (In-sample) MSPE (Out-of-sample) -age, - black, - zn, -ptratio, -chas, -rad 0.877 2173.64 10.18 10.65
  • 6. 6 A large reduction in the MSPE (in-sample) and (out-of-sample) for the GAMmodel indicates that there mightbe a strong polynomialrelationshipbetween some of the independentvariablesandthe response variable.Hence,the GAM model providingalargerflexibilitymightbe a bettermodel for thisprediction problem. 4. NEURAL NETWORK: Toimplementtheneural networkalgorithm,adatapreprocessingstepisrequired. The datapreprocessing step is necessary to ensure that the algorithm converges. The independent variables were normalized with the max-min scaling using x = (X-Xmin)/(Xmax-Xmin). Once the independentvariableswerescaled,the nnetfunctionwasusedtoevaluate the perfectnumber of nodes to use in the neural network using a loop to evaluate the best number that minimizes the test SSE. Fig 3. Plot to evaluate optimal number of nodes Fromthe above plot,itisevidentthatfor14 hiddennodes,the testSSEisminimum.Withthisevaluation, the neural networkwasrebuiltusing14 hiddennodestoobtainthe best MSPE for in-sample andout-of- sample set. MSPE (In-sample) MSPE (Out-of-sample) 0.076 9.001 Basedon the MSPE valuescalculatedforthe Neural network,the modelperformsthe bestin comparisonwithall the modelsrun.
  • 7. 7 CONCLUSION: Summarizing the results from all the models run for the prediction problem, the below table was populated. Fromthe belowtable,comparisonsinthe performance betweenin-sample measurescanbe done usingAIC,In-sample MSPE,while betweenthe out-of-sample measurescanbe done usingthe out- of-sample MSE. GLM (Stepwise Variable Selection) LASSO Regression Regression Tree GAM Neural Network Model equation -indus -age . lstat+ nox + crim + rm + dis Smoothing term: -age, - black, - zn, -ptratio, -chas, -rad - Model MSE 23.73 24.97 - - - R-squared 0.7216 0.7216 - - - Adj R-squared 0.7138 - - 0.877 - AIC 2439.68 - - 2137.64 - MSPE (In-sample) 23.02 23.01 13.43 10.18 0.076 MSPE (Out-of-sample) 18.15 18.30 16.53 10.15 9.001 Forthe Bostonhousingdata,clearlythe Neuralnetwork modelgeneratedthe lowestMSPEforthe training sample chosen. The In-sample MSPE was 0.076 and the out-of-sample MSPE was 9.001 indicating the lowest value achievable for the sample. For the sake of interpretability, the Regression model and GAM could also be further evaluated and better understood to predict the response variable, medv. Extending this study, cross-validation methods can be used for all the models to generate a more comparable value of the MSPE that is independent of the sample chosen.